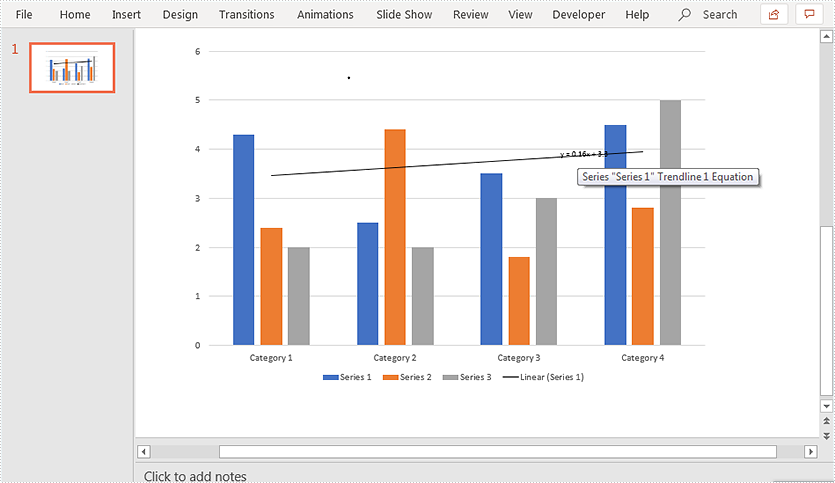
A trendline is a line superimposed on a chart revealing the overall direction of the data. Spire.Presentation for Java supports adding six different types of trendlines to chart, i.e. linear, logarithmic, polynomial, power, exponential and moving average.
The below example demonstrates how to use Spire.Presentation for Java to add a linear trendline to a chart.
import com.spire.presentation.FileFormat;
import com.spire.presentation.ISlide;
import com.spire.presentation.Presentation;
import com.spire.presentation.charts.IChart;
import com.spire.presentation.charts.ITrendlines;
import com.spire.presentation.charts.TrendlineSimpleType;

public class AddTrendlineToChart {
    public static void main(String[] args) throws Exception {
        //create a Presentation instance
        Presentation ppt = new Presentation();
        //load the PowerPoint document
        ppt.loadFromFile("Chart.pptx");

        //get the first slide
        ISlide slide = ppt.getSlides().get(0);
        //get the chart on the slide
        IChart chart = (IChart)slide.getShapes().get(0);

        //add a linear trendline to the first series of the chart
        ITrendlines trendLine = chart.getSeries().get(0).addTrendLine(TrendlineSimpleType.LINEAR);
        //display equation
        trendLine.setdisplayEquation(true);

        //save the resultant document
        ppt.saveToFile("AddTrendline.pptx", FileFormat.PPTX_2013);
    }
}
Output: