
React (21)
Splitting Excel files into separate files by worksheet, by row, or by column is a common requirement for data distribution and management. Spire.XLS for JavaScript performs the splitting process entirely in the browser via WebAssembly, using a virtual file system (VFS) to manage input and output files — no backend server required.
This article covers three core features:
For installation and project setup, refer to Integrating Spire.XLS for JavaScript in a React Project. The examples below assume Spire.XLS is installed and the WebAssembly module is initialized.
Split by Worksheet
Splitting by worksheet exports each sheet in a multi-sheet workbook as an independent Excel file. When a workbook contains multiple worksheets, each representing different data such as separate departments or months, you can split each worksheet into its own file. Spire.XLS accomplishes this by iterating through all worksheets in the source file, creating new workbooks, and copying each sheet. The steps are as follows:
- Create a
Workbookobject and load the source Excel document withLoadFromFile(). - Iterate through all worksheets in the source document.
- Create a new
Workbookobject. - Copy the source worksheet to the default worksheet of the new workbook using the
CopyFrommethod. - Get the worksheet name via
sheet.Nameas the output file name. - Save the new workbook as an Excel file with
SaveToFile().
Below is a complete code example demonstrating how to split worksheets into separate Excel files:
function App() {
  const splitByWorksheet = async () => {
    // Get the Spire.XLS WASM module
    const xlsModule = window.wasmModule?.spirexls;

    // Check if the module is ready
    if (!xlsModule) {
      alert('Spire.Xls is not ready yet');
      return;
    }

    // Load fonts and the Excel file into VFS
    await window.spire.FetchFileToVFS('arial.ttf', '/Library/Fonts/', `${process.env.PUBLIC_URL}/font/`);
    const inputFileName = 'Sample.xlsx';
    await window.spire.FetchFileToVFS(inputFileName, '', `${process.env.PUBLIC_URL}data/`);

    // Load the workbook
    const workbook = new xlsModule.Workbook();
    workbook.LoadFromFile({ fileName: inputFileName });

    // Iterate through each worksheet and export it as a separate file
    for (let i = 0; i < workbook.Worksheets.Count; i++) {
      let sheet = workbook.Worksheets.get(i);

      // Create a new workbook and copy the current worksheet
      let newWorkbook = new xlsModule.Workbook();
      let newSheet = newWorkbook.Worksheets.get(0);
      newSheet.CopyFrom(sheet);

      // Use the worksheet name as the output file name
      const outputFileName = `${sheet.Name}.xlsx`;
      newWorkbook.SaveToFile({ fileName: outputFileName, version: xlsModule.ExcelVersion.Version2010 });
      newWorkbook.Dispose();

      // Read the split file from VFS and trigger a browser download
      const fileArray = window.dotnetRuntime.Module.FS.readFile(outputFileName);
      const blob = new Blob([fileArray], { type: 'application/vnd.openxmlformats-officedocument.spreadsheetml.sheet' });
      const url = URL.createObjectURL(blob);
      const a = document.createElement('a');
      a.href = url;
      a.download = outputFileName;
      a.click();
      URL.revokeObjectURL(url);
    }

    // Release resources
    workbook.Dispose();
  };

  return (
    <div style={{ textAlign: 'center', height: '300px' }}>
      <h1>Split Excel By Worksheet</h1>
      <button onClick={splitByWorksheet}>
        Generate
      </button>
    </div>
  );
}

export default App;
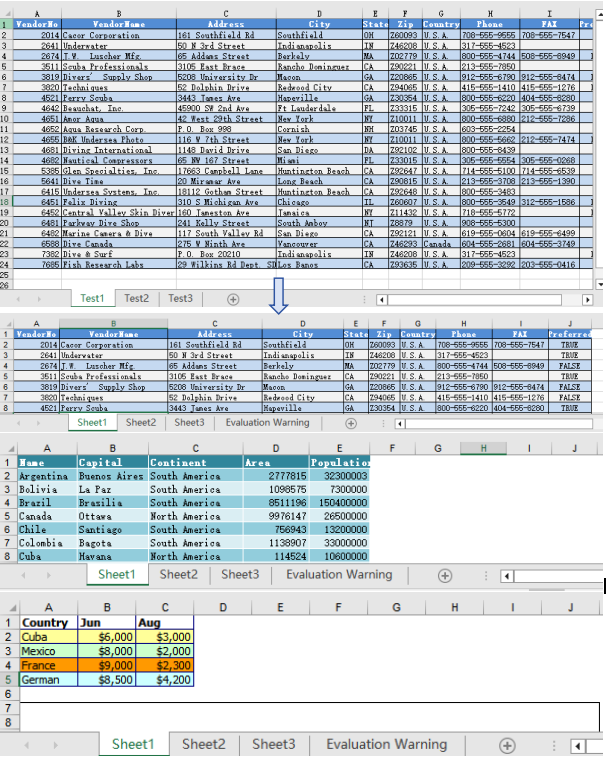
After splitting by worksheet, each resulting file contains a single worksheet from the original workbook
Split by Row
Splitting by row is suitable for breaking up large tables into multiple smaller files by a fixed number of rows, making pagination and distribution easier. When a worksheet contains a large amount of data rows that need to be split into multiple files, Spire.XLS accomplishes this by copying source rows one by one into a new workbook. The steps are as follows:
- Create a
Workbookobject, load the source Excel document withLoadFromFile(), and retrieve the first worksheet. - Create a new
Workbookobject. - Use a loop to call the
Copymethod row by row, copying specified rows from the source worksheet to the new worksheet. - Copy the column widths from the source worksheet to the new worksheet.
- Save the new workbook as an Excel file with
SaveToFile(). - Repeat the steps above to create more split files, copying the header row separately when needed.
Below is a complete code example demonstrating how to split a worksheet into multiple Excel files by row:
function App() {
  const splitByRow = async () => {
    // Get the Spire.XLS WASM module
    const xlsModule = window.wasmModule?.spirexls;

    // Check if the module is ready
    if (!xlsModule) {
      alert('Spire.Xls is not ready yet');
      return;
    }

    // Load fonts and the Excel file into VFS
    await window.spire.FetchFileToVFS('arial.ttf', '/Library/Fonts/', `${process.env.PUBLIC_URL}/font/`);
    const inputFileName = 'Sample.xlsx';
    await window.spire.FetchFileToVFS(inputFileName, '', `${process.env.PUBLIC_URL}data/`);

    // Load the workbook and get the first worksheet
    const workbook = new xlsModule.Workbook();
    workbook.LoadFromFile({ fileName: inputFileName });
    const sheet = workbook.Worksheets.get(0);

    // Create a new workbook (comes with one default worksheet)
    let newWorkbook1 = new xlsModule.Workbook();
    let newSheet1 = newWorkbook1.Worksheets.get(0);

    // Copy rows 1-5 to the target file
    let destRow = 1;
    for (let i = 0; i < 5; i++) {
      sheet.Copy({
        sourceRange: sheet.Rows[i],
        worksheet: newSheet1,
        destRow: destRow,
        destColumn: 1,
        copyStyle: true
      });
      destRow++;
    }

    // Copy column widths
    for (let c = 0; c < sheet.Columns.length; c++) {
      newSheet1.SetColumnWidth(c + 1, sheet.GetColumnWidth(c + 1));
    }

    // Save the first split file
    const outputFileName1 = "Rows1-5.xlsx";
    newWorkbook1.SaveToFile({ fileName: outputFileName1, version: xlsModule.ExcelVersion.Version2010 });
    newWorkbook1.Dispose();

    // Read file data from VFS
    const fileData1 = window.dotnetRuntime.Module.FS.readFile(outputFileName1);

    // Create a second new workbook
    let newWorkbook2 = new xlsModule.Workbook();
    let newSheet2 = newWorkbook2.Worksheets.get(0);

    destRow = 1;

    // Copy the header row
    sheet.Copy({
      sourceRange: sheet.Rows[0],
      worksheet: newSheet2,
      destRow: destRow,
      destColumn: 1,
      copyStyle: true
    });
    destRow++;

    // Copy rows 6-10 to the second target file
    for (let i = 5; i < 10; i++) {
      sheet.Copy({
        sourceRange: sheet.Rows[i],
        worksheet: newSheet2,
        destRow: destRow,
        destColumn: 1,
        copyStyle: true
      });
      destRow++;
    }

    // Copy column widths
    for (let c = 0; c < sheet.Columns.length; c++) {
      newSheet2.SetColumnWidth(c + 1, sheet.GetColumnWidth(c + 1));
    }

    // Save the second split file
    const outputFileName2 = "Rows6-10.xlsx";
    newWorkbook2.SaveToFile({ fileName: outputFileName2, version: xlsModule.ExcelVersion.Version2010 });
    newWorkbook2.Dispose();

    // Read file data from VFS
    const fileData2 = window.dotnetRuntime.Module.FS.readFile(outputFileName2);

    // Package the split files into a ZIP for download
    const zip = new JSZip();
    zip.file(outputFileName1, fileData1);
    zip.file(outputFileName2, fileData2);
    const zipBlob = await zip.generateAsync({ type: 'blob' });
    const zipUrl = URL.createObjectURL(zipBlob);
    const a = document.createElement('a');
    a.href = zipUrl;
    a.download = "SplitByRows.zip";
    a.click();
    URL.revokeObjectURL(zipUrl);

    // Release resources
    workbook.Dispose();
  };

  return (
    <div style={{ textAlign: 'center', height: '300px' }}>
      <h1>Split Excel By Row</h1>
      <button onClick={splitByRow}>
        Generate
      </button>
    </div>
  );
}

export default App;
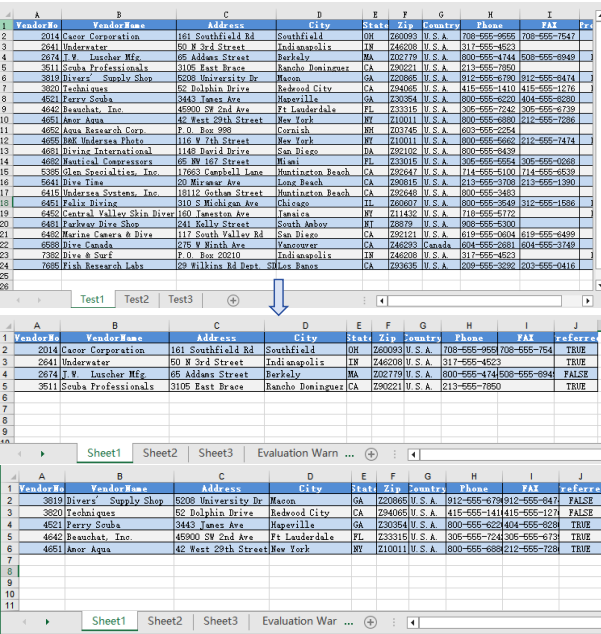
After splitting by row, each file contains the header row and the specified number of data rows
Split by Column
Splitting by column is suitable for breaking up wide tables into multiple files by column groups, making the data structure clearer. When a worksheet contains many columns and you need to split different column groups into separate files, Spire.XLS accomplishes this by copying source columns one by one into a new workbook. The steps are as follows:
- Create a
Workbookobject, load the source Excel document withLoadFromFile(), and retrieve the first worksheet. - Create a new
Workbookobject. - Use a loop to call the
Copymethod column by column, copying specified columns from the source worksheet to the new worksheet. - Copy the column widths from the source worksheet to the new worksheet.
- Save the new workbook as an Excel file with
SaveToFile(). - Repeat the steps above to create more split files.
Below is a complete code example demonstrating how to split a worksheet into multiple Excel files by column:
function App() {
  const splitByColumn = async () => {
    // Get the Spire.XLS WASM module
    const xlsModule = window.wasmModule?.spirexls;

    // Check if the module is ready
    if (!xlsModule) {
      alert('Spire.Xls is not ready yet');
      return;
    }

    // Load fonts and the Excel file into VFS
    await window.spire.FetchFileToVFS('arial.ttf', '/Library/Fonts/', `${process.env.PUBLIC_URL}/font/`);
    const inputFileName = 'Sample.xlsx';
    await window.spire.FetchFileToVFS(inputFileName, '', `${process.env.PUBLIC_URL}data/`);

    // Load the workbook and get the first worksheet
    const workbook = new xlsModule.Workbook();
    workbook.LoadFromFile({ fileName: inputFileName });
    const sheet = workbook.Worksheets.get(0);

    // Create a new workbook and copy columns 1-2 (columns A-B) to the new file
    let newWorkbook1 = new xlsModule.Workbook();
    let newSheet1 = newWorkbook1.Worksheets.get(0);

    for (let i = 1; i <= 2; i++) {
      sheet.Copy({
        sourceRange: sheet.Columns[i - 1],
        worksheet: newSheet1,
        destRow: 1,
        destColumn: i,
        copyStyle: true
      });
    }

    // Copy column widths
    for (let i = 1; i <= 2; i++) {
      newSheet1.SetColumnWidth(i, sheet.GetColumnWidth(i));
    }

    // Save the first split file
    const outputFileName1 = "ColumnsAB.xlsx";
    newWorkbook1.SaveToFile({ fileName: outputFileName1, version: xlsModule.ExcelVersion.Version2010 });
    newWorkbook1.Dispose();

    // Read file data from VFS
    const fileData1 = window.dotnetRuntime.Module.FS.readFile(outputFileName1);

    // Create a second new workbook and copy columns 3-4 (columns C-D) to the new file
    let newWorkbook2 = new xlsModule.Workbook();
    let newSheet2 = newWorkbook2.Worksheets.get(0);

    for (let i = 3; i <= 4; i++) {
      sheet.Copy({
        sourceRange: sheet.Columns[i - 1],
        worksheet: newSheet2,
        destRow: 1,
        destColumn: i - 2,
        copyStyle: true
      });
    }

    // Copy column widths
    for (let i = 3; i <= 4; i++) {
      newSheet2.SetColumnWidth(i - 2, sheet.GetColumnWidth(i));
    }

    // Save the second split file
    const outputFileName2 = "ColumnsCD.xlsx";
    newWorkbook2.SaveToFile({ fileName: outputFileName2, version: xlsModule.ExcelVersion.Version2010 });
    newWorkbook2.Dispose();

    // Read file data from VFS
    const fileData2 = window.dotnetRuntime.Module.FS.readFile(outputFileName2);

    // Package the split files into a ZIP for download
    const zip = new JSZip();
    zip.file(outputFileName1, fileData1);
    zip.file(outputFileName2, fileData2);
    const zipBlob = await zip.generateAsync({ type: 'blob' });
    const zipUrl = URL.createObjectURL(zipBlob);
    const a = document.createElement('a');
    a.href = zipUrl;
    a.download = "SplitByColumns.zip";
    a.click();
    URL.revokeObjectURL(zipUrl);

    // Release resources
    workbook.Dispose();
  };

  return (
    <div style={{ textAlign: 'center', height: '300px' }}>
      <h1>Split Excel By Column</h1>
      <button onClick={splitByColumn}>
        Generate
      </button>
    </div>
  );
}

export default App;
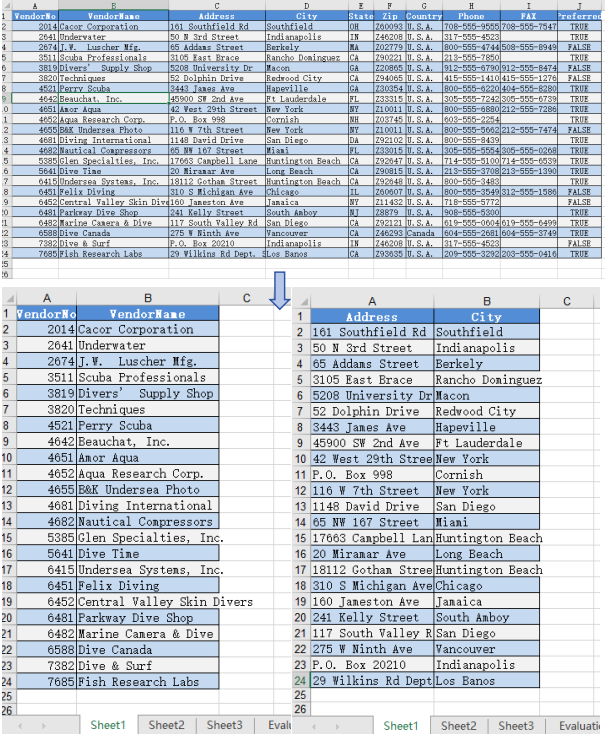
After splitting by column, each file contains a portion of the columns from the original worksheet
FAQ
Worksheet name shows as default (Sheet1) instead of the original name
Cause: The CopyFrom method only copies worksheet content — it does not retain the original worksheet name. The new workbook's default worksheet keeps its default name.
Solution: Manually set the worksheet name after copying using newSheet.Name = sheet.Name:
let newSheet = newWorkbook.Worksheets.get(0);
newSheet.CopyFrom(sheet);
newSheet.Name = sheet.Name;
VFS file loading fails or path is incorrect
Cause: The file path or VFS file name is incorrect, or the required font files have not been loaded into VFS, causing the workbook to fail to load.
Solution: Verify that the FetchFileToVFS parameters use the correct paths. The font file path should be /Library/Fonts/, and ensure the font file name matches exactly (e.g., arial.ttf):
await window.spire.FetchFileToVFS('arial.ttf', '/Library/Fonts/', fontSourcePath);
Get a Free License
Spire.XLS for JavaScript offers a 30-day full-featured free trial license with no functional limitations. Apply here to evaluate before purchasing.
Copying worksheets is one of the most common and efficient operations in everyday Excel document processing — whether you are quickly creating similar reports from a template or consolidating data across multiple documents. Spire.XLS for JavaScript handles this entirely in the browser via WebAssembly, using a virtual file system (VFS) to manage input and output files — no backend server required.
This article covers three core features:
- Copy a worksheet within the same workbook
- Copy a worksheet across workbooks
- Copy a selected cell range
For installation and project setup, refer to Integrating Spire.XLS for JavaScript in a React Project. The examples below assume Spire.XLS is installed and the WebAssembly module is initialized.
Copy a Worksheet Within the Same Workbook
Duplicating a worksheet within the same workbook is a frequent development task — for example, quickly creating next month's report copy from a monthly template. Spire.XLS for JavaScript provides the CopyFrom method to duplicate a worksheet. The copied sheet retains all content from the source worksheet, including data, styles, fonts, colors, borders, column widths, and row heights.
function App() {
  const sheetToSVG = async () => {
    // Get the Spire.XLS WASM module
    const xlsModule = window.wasmModule?.spirexls;

    // Check if the module is ready
    if (!xlsModule) {
      alert('Spire.Xls is not ready yet');
      return;
    }

    // Load fonts and the Excel file into VFS
    await window.spire.FetchFileToVFS('ARIAL.TTF', '/Library/Fonts/', `${process.env.PUBLIC_URL}/font/`);
    const inputFileName = 'Sample.xlsx';
    await window.spire.FetchFileToVFS(inputFileName, '', `${process.env.PUBLIC_URL}data/`);

    // Load the workbook
    const workbook = new xlsModule.Workbook();
    workbook.LoadFromFile({ fileName: inputFileName });

    // Get the first worksheet
    let sheet = workbook.Worksheets.get(0);

    // Add a new worksheet
    let sheet1 = workbook.Worksheets.Add("MySheet");

    // Copy the first worksheet into the newly added sheet
    sheet1.CopyFrom(sheet);

    const outputFileName = "CopySheetWithinWorkbook_output.xlsx";
    workbook.SaveToFile({ fileName: outputFileName });

    // Release the workbook object to free resources
    workbook.Dispose();

    // Read the converted file from VFS and trigger download
    const fileArray = window.dotnetRuntime.Module.FS.readFile(outputFileName);
    const blob = new Blob([fileArray], { type: "application/vnd.openxmlformats-officedocument.spreadsheetml.sheet" });
    const url = URL.createObjectURL(blob);
    const a = document.createElement('a');
    a.href = url;
    a.download = outputFileName;
    a.click();
    URL.revokeObjectURL(url);
  };

  return (
    <div style={{ textAlign: 'center', height: '300px' }}>
      <h1>Copy Worksheet Within Workbook</h1>
      <button onClick={sheetToSVG}>
        Start
      </button>
    </div>
  );
}

export default App;
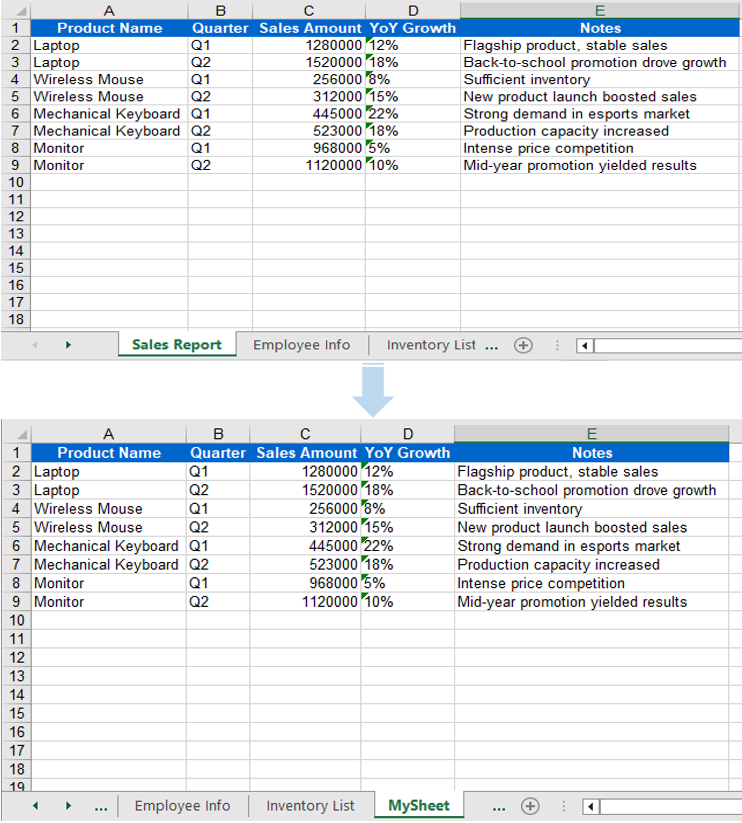
When using CopyFrom, data, styles, fonts, colors, borders, and column widths from the source worksheet are fully preserved in the new sheet.
Copy a Worksheet Across Workbooks
In real-world scenarios, data from multiple Excel files often needs to be consolidated into a single workbook — for example, extracting specific sheets from departmental reports and merging them into a master sheet. The AddCopy method lets you copy a worksheet from the source workbook into the target workbook with all its content intact.
function App() {
  const sheetToSVG = async () => {
    // Get the Spire.XLS WASM module
    const xlsModule = window.wasmModule?.spirexls;

    // Check if the module is ready
    if (!xlsModule) {
      alert('Spire.Xls is not ready yet');
      return;
    }

    // Load fonts and the Excel files into VFS
    await window.spire.FetchFileToVFS('arial.ttf', '/Library/Fonts/', `${process.env.PUBLIC_URL}/font/`);
    const sourceFileName = 'ReadImages.xlsx';
    const targetFileName = 'Sample.xlsx';
    await window.spire.FetchFileToVFS(sourceFileName, '', `${process.env.PUBLIC_URL}data/`);
    await window.spire.FetchFileToVFS(targetFileName, '', `${process.env.PUBLIC_URL}data/`);

    // Load the source workbook
    const sourceWorkbook = new xlsModule.Workbook();
    sourceWorkbook.LoadFromFile({ fileName: sourceFileName });

    // Get the first worksheet of the source workbook
    const srcWorksheet = sourceWorkbook.Worksheets.get(0);

    // Load the target workbook
    const targetWorkbook = new xlsModule.Workbook();
    targetWorkbook.LoadFromFile({ fileName: targetFileName });

    // Add a new worksheet in the target workbook and copy the source sheet into it
    targetWorkbook.Worksheets.AddCopy({ sheet: srcWorksheet });

    // Save the target workbook
    const outputFileName = "CopyAcrossWorkbooks_output.xlsx";
    targetWorkbook.SaveToFile({ fileName: outputFileName });

    // Release resources
    sourceWorkbook.Dispose();
    targetWorkbook.Dispose();

    // Read the converted file from VFS and trigger download
    const fileArray = window.dotnetRuntime.Module.FS.readFile(outputFileName);
    const blob = new Blob([fileArray], { type: "application/vnd.openxmlformats-officedocument.spreadsheetml.sheet"});
    const url = URL.createObjectURL(blob);
    const a = document.createElement('a');
    a.href = url;
    a.download = outputFileName;
    a.click();
    URL.revokeObjectURL(url);
  };

  return (
    <div style={{ textAlign: 'center', height: '300px' }}>
      <h1>Copy Worksheet Across Workbooks</h1>
      <button onClick={sheetToSVG}>
        Start
      </button>
    </div>
  );
}

export default App;
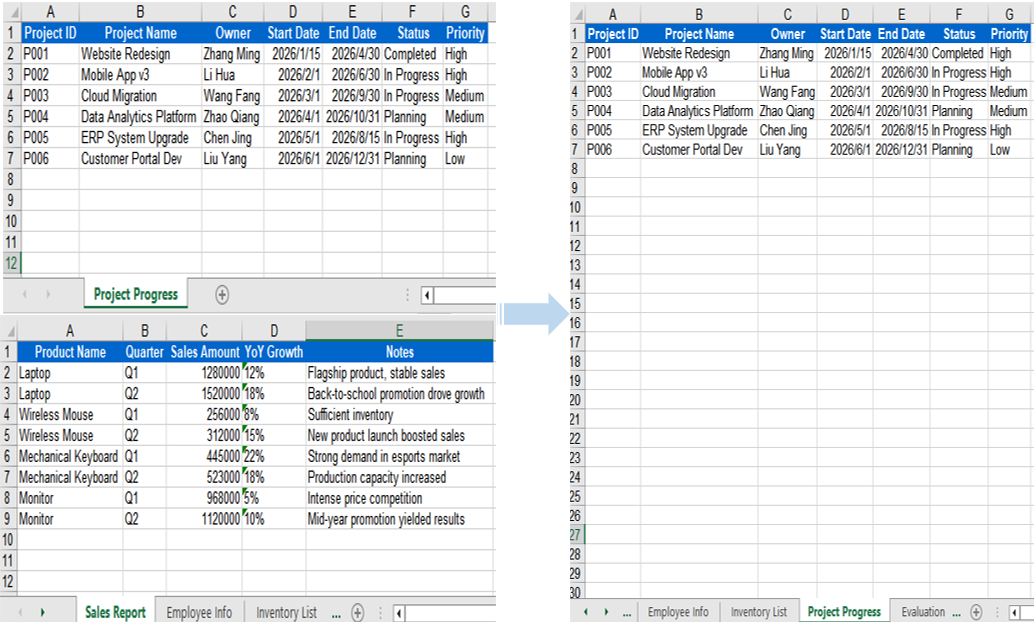
When copying across workbooks, all data and styles from the source worksheet are preserved — AddCopy copies the complete worksheet content into the target workbook.
Copy a Selected Cell Range
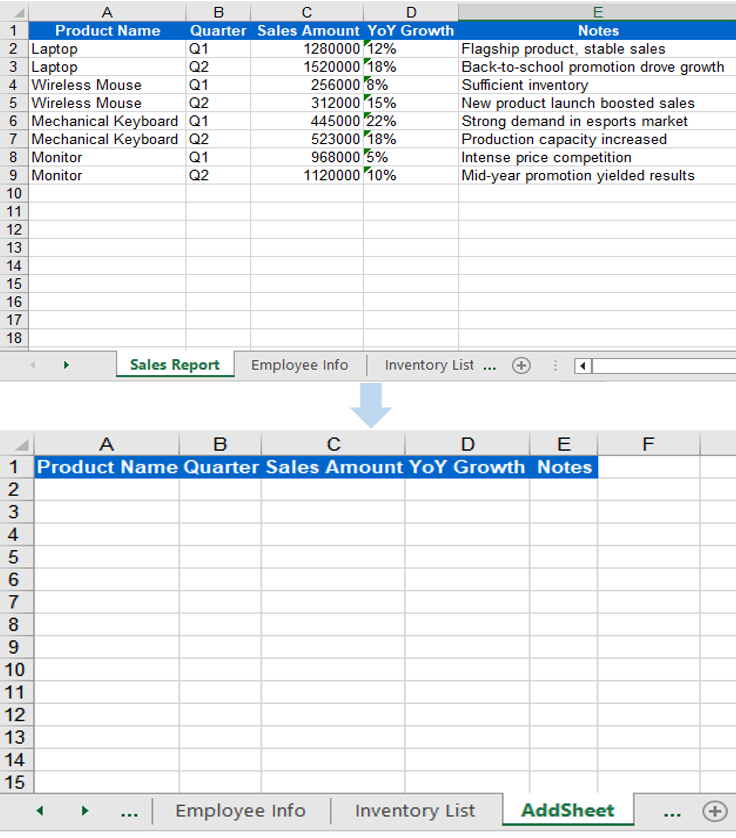
Sometimes you do not need to copy an entire worksheet — you only need to copy a specific cell range (such as a particular data table or summary result) to a target location. Spire.XLS for JavaScript provides the Copy method, which copies data, styles, and formatting from the source range to the starting position of the target range.
function App() {
  const sheetToSVG = async () => {
    // Get the Spire.XLS WASM module
    const xlsModule = window.wasmModule?.spirexls;

    // Check if the module is ready
    if (!xlsModule) {
      alert('Spire.Xls is not ready yet');
      return;
    }

    // Load the source Excel file into VFS
    await window.spire.FetchFileToVFS('ARIAL.TTF', '/Library/Fonts/', `${process.env.PUBLIC_URL}/font/`);
    const inputFileName = 'Sample.xlsx';
    await window.spire.FetchFileToVFS(inputFileName, '', `${process.env.PUBLIC_URL}data/`);

    // Load the workbook
    const workbook = new xlsModule.Workbook();
    workbook.LoadFromFile({ fileName: inputFileName });

    // Get the first row of the first worksheet as the source range
    const sheet = workbook.Worksheets.get(0);
    const sourceRange = sheet.Range.get("A1:E1");

    // Add a new worksheet
    let sheet1 = workbook.Worksheets.Add("AddSheet");

    // Copy the source range to the starting position of the target worksheet
    sheet.Copy(sourceRange, sheet1, sheet.FirstRow, sheet.FirstColumn, true);

    // Save the workbook
    const outputFileName = "CopyRange_output22.xlsx";
    workbook.SaveToFile({ fileName: outputFileName });

    // Release resources
    workbook.Dispose();

    // Read the converted file from VFS and trigger download
    const fileArray = window.dotnetRuntime.Module.FS.readFile(outputFileName);
    const blob = new Blob([fileArray], { type: "application/vnd.openxmlformats-officedocument.spreadsheetml.sheet" });
    const url = URL.createObjectURL(blob);
    const a = document.createElement('a');
    a.href = url;
    a.download = outputFileName;
    a.click();
    URL.revokeObjectURL(url);
  };

  return (
    <div style={{ textAlign: 'center', height: '300px' }}>
      <h1>Copy Range</h1>
      <button onClick={sheetToSVG}>
        Start
      </button>
    </div>
  );
}

export default App;
The Copy method transfers data, styles, and formatting from the source range to the target range — ideal for lightweight scenarios where only partial data extraction is needed.
FAQ
Column width differs after copying
Cause: Font mismatch between the source and target workbooks.
Solution: Ensure all required font files are loaded into the VFS environment of the target workbook before copying across workbooks:
await window.spire.FetchFileToVFS(
  'arial.ttf', '/Library/Fonts/', '/'
);
Range content is pasted at the wrong position
Cause: Incorrect destRow and destColumn parameters in the Copy method, causing data to be pasted at an unexpected location.
Solution: Confirm that the destination row and column indices start from 1 (not 0), and verify the row and column range of the target worksheet before copying.
Get a Free License
Spire.XLS for JavaScript offers a 30-day full-featured free trial license with no functional limitations. Apply here to evaluate before purchasing.
Add, Remove, and Move Excel Worksheets with JavaScript in React
2026-06-15 03:56:24 Written by Lisa LiManaging worksheets — adding, removing, and reordering them — is one of the most fundamental and frequently used operations in Excel document processing. Spire.XLS for JavaScript handles these operations entirely in the browser via WebAssembly, using a virtual file system (VFS) to manage input and output files — no backend server required.
This article covers three core features:
For installation and project setup, refer to Integrating Spire.XLS for JavaScript in a React Project. The examples below assume Spire.XLS is installed and the WebAssembly module is initialized.
Add Worksheet
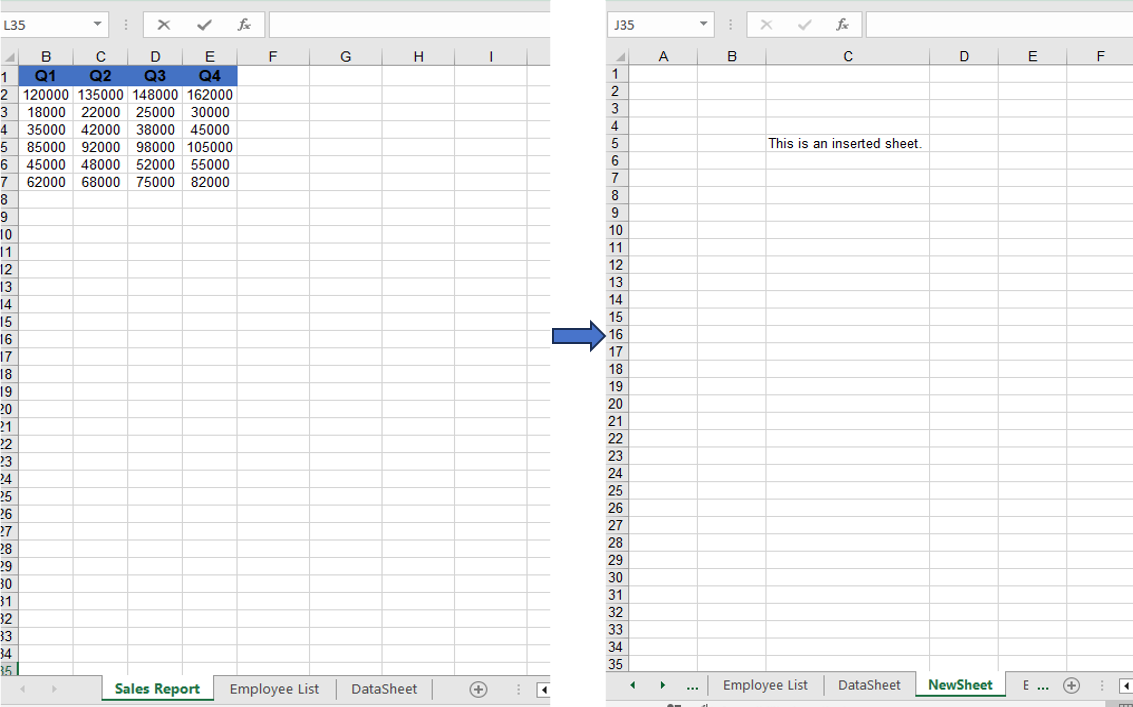
Adding new worksheets to a workbook is a common requirement in daily development. Spire.XLS for JavaScript provides the Add method to create a new worksheet and give it a name. After adding, you can write data to the new sheet's cells and save the workbook.
function App() {
  const startProcessing = async () => {
    // Get the Spire.XLS WASM module
    const xlsModule = window.wasmModule?.spirexls;
    if (!xlsModule) {
      alert('Spire.Xls is not ready yet');
      return;
    }

    // Load fonts and the Excel file into VFS
    await window.spire.FetchFileToVFS('ARIAL.TTF', '/Library/Fonts/', `${process.env.PUBLIC_URL}/font/`);
    const inputFileName = 'AddWorksheet.xlsx';
    await window.spire.FetchFileToVFS(inputFileName, '', `${process.env.PUBLIC_URL}/data/`);

    // Create a workbook instance and load the file
    const workbook = new xlsModule.Workbook();
    workbook.LoadFromFile({ fileName: inputFileName });

    // Add a new worksheet named "NewSheet"
    const sheet = workbook.Worksheets.Add("NewSheet");
    sheet.Range.get("C5").Text = "This is an inserted sheet.";

    // Auto-fit columns
    sheet.AllocatedRange.AutoFitColumns();

    // Save the workbook
    const outputFileName = "AddWorksheet_output.xlsx";
    workbook.SaveToFile({ fileName: outputFileName });

    // Release resources
    workbook.Dispose();

    // Read the output file from VFS, wrap it as a Blob, and trigger download
    const modifiedFileArray = window.dotnetRuntime.Module.FS.readFile(outputFileName);
    const blob = new Blob([modifiedFileArray], { type: "application/vnd.openxmlformats-officedocument.spreadsheetml.sheet" });
    const url = URL.createObjectURL(blob);
    const a = document.createElement('a');
    a.href = url;
    a.download = outputFileName;
    a.click();
    URL.revokeObjectURL(url);
  };

  return (
    <div style={{ textAlign: 'center', height: '300px' }}>
      <h1>Add Worksheet</h1>
      <button onClick={startProcessing}>
        Start
      </button>
    </div>
  );
}

export default App;
Adding a new worksheet after the existing ones via the Add method.
Remove Worksheet
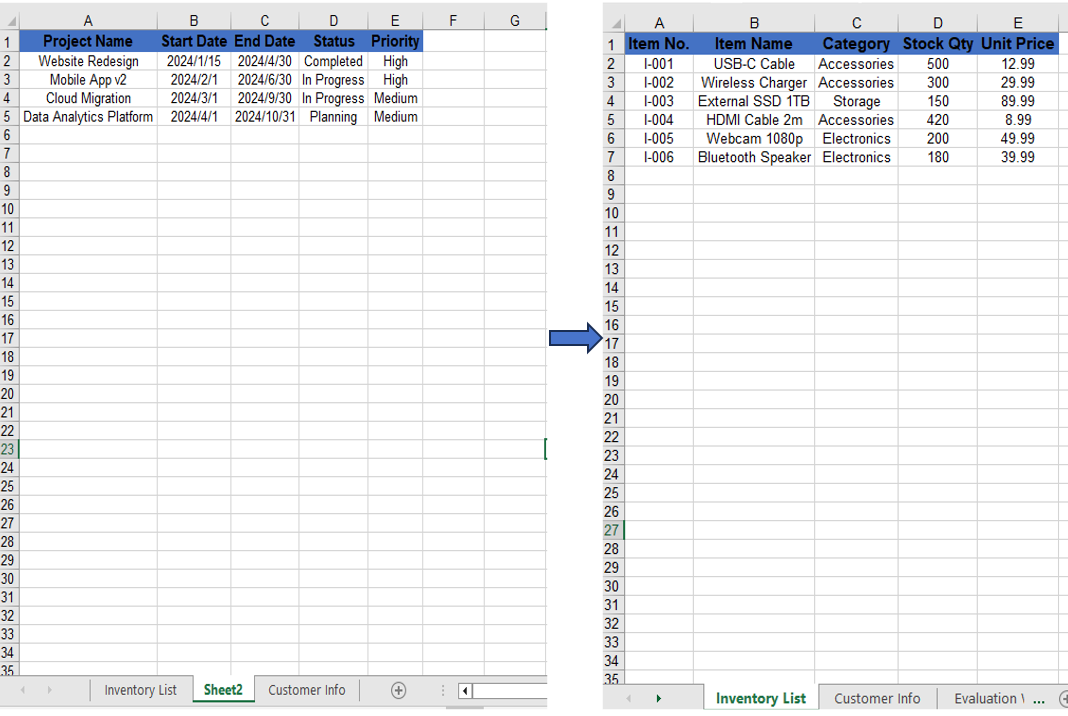
When you need to clean up unwanted worksheets from a workbook, you can remove them directly by name. Spire.XLS for JavaScript's Remove method precisely locates and removes the target worksheet.
function App() {
  const startProcessing = async () => {
    // Get the Spire.XLS WASM module
    const xlsModule = window.wasmModule?.spirexls;
    if (!xlsModule) {
      alert('Spire.Xls is not ready yet');
      return;
    }

    // Load fonts and the Excel file into VFS
    await window.spire.FetchFileToVFS('ARIAL.TTF', '/Library/Fonts/', `${process.env.PUBLIC_URL}/font/`);
    const inputFileName = 'RemoveWorksheet.xlsx';
    await window.spire.FetchFileToVFS(inputFileName, '', `${process.env.PUBLIC_URL}/data/`);

    // Create a workbook instance and load the file
    const workbook = new xlsModule.Workbook();
    workbook.LoadFromFile({ fileName: inputFileName });

    // Remove a worksheet by name
    const sheet = workbook.Worksheets.get("Sheet2");
    workbook.Worksheets.Remove(sheet);
    // Remove by index
    //workbook.Worksheets.RemoveAt(1);

    // Save the workbook
    const outputFileName = "RemoveWorksheet_output.xlsx";
    workbook.SaveToFile({ fileName: outputFileName });

    // Release resources
    workbook.Dispose();

    // Read the output file from VFS, wrap it as a Blob, and trigger download
    const modifiedFileArray = window.dotnetRuntime.Module.FS.readFile(outputFileName);
    const blob = new Blob([modifiedFileArray], { type: "application/vnd.openxmlformats-officedocument.spreadsheetml.sheet" });
    const url = URL.createObjectURL(blob);
    const a = document.createElement('a');
    a.href = url;
    a.download = outputFileName;
    a.click();
    URL.revokeObjectURL(url);
  };

  return (
    <div style={{ textAlign: 'center', height: '300px' }}>
      <h1>Remove Worksheet</h1>
      <button onClick={startProcessing}>
        Start
      </button>
    </div>
  );
}

export default App;
Using Remove to delete a worksheet by name.
Move and Reorder Worksheets
Reordering worksheets is a common task when organizing an Excel document. With Spire.XLS for JavaScript's MoveWorksheet method, you can move a worksheet to a target index position, effectively reordering the sheets within the workbook.
function App() {
  const startProcessing = async () => {
    // Get the Spire.XLS WASM module
    const xlsModule = window.wasmModule?.spirexls;
    if (!xlsModule) {
      alert('Spire.Xls is not ready yet');
      return;
    }

    // Load fonts and the Excel file into VFS
    await window.spire.FetchFileToVFS('ARIAL.TTF', '/Library/Fonts/', `${process.env.PUBLIC_URL}/font/`);
    const inputFileName = 'Sample.xlsx';
    await window.spire.FetchFileToVFS(inputFileName, '', `${process.env.PUBLIC_URL}/data/`);

    // Create a workbook instance and load the file
    const workbook = new xlsModule.Workbook();
    workbook.LoadFromFile({ fileName: inputFileName });

    // Get the first worksheet and move it to index 1
    const sheet = workbook.Worksheets.get(0);
    sheet.MoveWorksheet(1);

    // Save the workbook
    const outputFileName = "MoveWorksheet_output.xlsx";
    workbook.SaveToFile({ fileName: outputFileName });

    // Release resources
    workbook.Dispose();

    // Read the output file from VFS, wrap it as a Blob, and trigger download
    const modifiedFileArray = window.dotnetRuntime.Module.FS.readFile(outputFileName);
    const blob = new Blob([modifiedFileArray], { type: "application/vnd.openxmlformats-officedocument.spreadsheetml.sheet" });
    const url = URL.createObjectURL(blob);
    const a = document.createElement('a');
    a.href = url;
    a.download = outputFileName;
    a.click();
    URL.revokeObjectURL(url);
  };

  return (
    <div style={{ textAlign: 'center', height: '300px' }}>
      <h1>Move Worksheet</h1>
      <button onClick={startProcessing}>
        Start
      </button>
    </div>
  );
}

export default App;
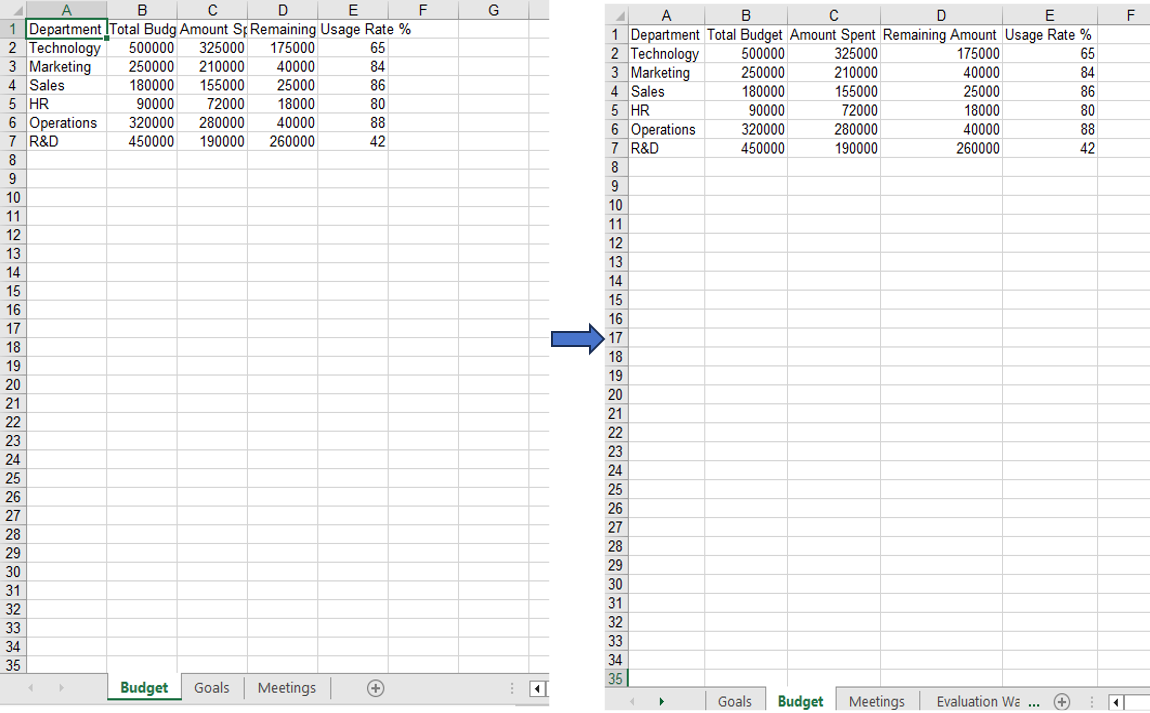
Moving the first worksheet to the second sheet position via the MoveWorksheet method.
FAQ
Index out of range when operating on worksheets
Cause: The index parameter is outside the range of the current worksheet collection in the workbook.
Solution: Verify the total number of worksheets before performing the operation, ensuring the index is within 0 to worksheets.Count-1. Use workbook.Worksheets.Count to get the current total:
const count = workbook.Worksheets.Count;
Worksheet not found when removing by name
Cause: The specified worksheet name does not exactly match the actual name in the workbook.
Solution: Iterate through the worksheet names to confirm before removal:
for (let i = 0; i < workbook.Worksheets.Count; i++) {
  let name = workbook.Worksheets.get(i).Name;
  console.log(name);
}
Get a Free License
Spire.XLS for JavaScript offers a 30-day full-featured free trial license with no functional limitations. Apply here to evaluate before purchasing.
Exporting Excel worksheets and charts to SVG vector graphics lets you display data clearly at any resolution on the web, while keeping text selectable and searchable. Spire.XLS for JavaScript runs entirely in the browser via WebAssembly, using a virtual file system (VFS) to manage input and output files — no backend server required.
This article covers two core features:
For installation and project setup, refer to Integrating Spire.XLS for JavaScript in a React Project. The examples below assume Spire.XLS is installed and the WebAssembly module is initialized.
Worksheet to SVG
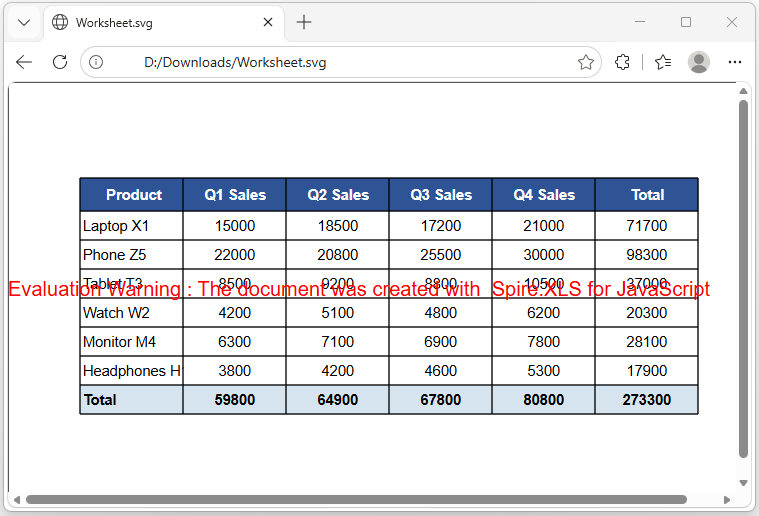
Converting a worksheet to SVG involves three steps: first, load the font files and the target Excel file into the WASM virtual file system via FetchFileToVFS; then instantiate a Workbook, load the file, retrieve the target worksheet, and call ToSVGStream to render it into a Stream object; finally, read the generated SVG file from VFS, wrap it as a Blob, and trigger a browser download.
function App() {
  const sheetToSVG = async () => {
    // Get the Spire.XLS WASM module
    const xlsModule = window.wasmModule?.spirexls;

    // Check if the module is ready
    if (!xlsModule) {
      alert('Spire.Xls is not ready yet');
      return;
    }

    // Load fonts and the Excel file into VFS
    await window.spire.FetchFileToVFS('arial.ttf', '/Library/Fonts/', `${process.env.PUBLIC_URL}/font/`);
    const inputFileName = 'ImageHeaderFooter.xlsx';
    await window.spire.FetchFileToVFS(inputFileName, '', `${process.env.PUBLIC_URL}data/`);

    // Load the workbook and get the first worksheet
    const workbook = new xlsModule.Workbook();
    workbook.LoadFromFile({ fileName: inputFileName });
    const sheet = workbook.Worksheets.get(0);

    // Convert the worksheet to an SVG stream
    const outputFileName = "Worksheet.svg";
    let fs = new xlsModule.Stream(outputFileName);
    sheet.ToSVGStream(fs, 0, 0, 0, 0);
    fs.Flush();
    fs.Dispose();

    // Read the converted file from VFS and trigger download
    const fileArray = window.dotnetRuntime.Module.FS.readFile(outputFileName);
    const blob = new Blob([fileArray], { type: "image/svg+xml;charset=utf-8"});
    const url = URL.createObjectURL(blob);
    const a = document.createElement('a');
    a.href = url;
    a.download = outputFileName;
    a.click();
    URL.revokeObjectURL(url);

    // Release resources
    workbook.Dispose();
  };

  return (
    <div style={{ textAlign: 'center', height: '300px' }}>
      <h1>Convert Excel To SVG</h1>
      <button onClick={sheetToSVG}>
        Generate
      </button>
    </div>
  );
}

export default App;
SVG output generated from a worksheet via ToSVGStream
ChartSheet to SVG
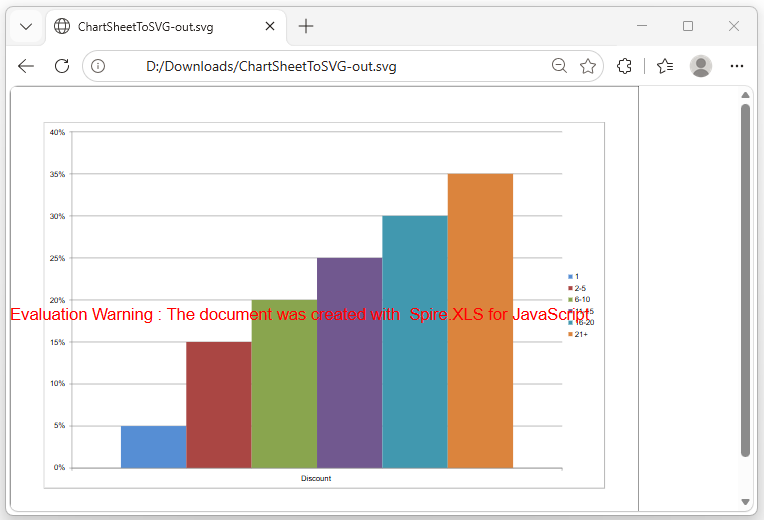
A ChartSheet is a special type of worksheet that contains an embedded chart instead of cell data. The conversion process is similar to worksheet-to-SVG, with two key differences: retrieve the chartsheet by name using GetChartSheetByName("Chart1") instead of by index; and call ToSVGStream(fs) without specifying cell range parameters, since the rendering area is determined by the chart itself.
function App() {
  const chartsheetToSVG = async () => {
    // Get the Spire.XLS WASM module
    const xlsModule = window.wasmModule?.spirexls;

    // Check if the module is ready
    if (!xlsModule) {
      alert('Spire.Xls is not ready yet');
      return;
    }

    // Load fonts and the Excel file into VFS
    await window.spire.FetchFileToVFS('arial.ttf', '/Library/Fonts/', `${process.env.PUBLIC_URL}/font/`);
    const inputFileName = 'ChartSheet.xlsx';
    await window.spire.FetchFileToVFS(inputFileName, '', `${process.env.PUBLIC_URL}data/`);

    // Load the workbook
    const workbook = new xlsModule.Workbook();
    workbook.LoadFromFile({ fileName: inputFileName });

    // Get the chartsheet by name
    let cs = workbook.GetChartSheetByName("Chart1");

    // Define the output file name
    const outputFileName = 'ChartSheetToSVG-out.svg';

    // Create a stream and convert the chartsheet to SVG
    const fs = new xlsModule.Stream(outputFileName);
    cs.ToSVGStream(fs);
    fs.Flush();

    // Read the converted file from VFS and trigger download
    const fileArray = window.dotnetRuntime.Module.FS.readFile(outputFileName);
    const blob = new Blob([fileArray], { type: "image/svg+xml;charset=utf-8" });
    const url = URL.createObjectURL(blob);
    const a = document.createElement('a');
    a.href = url;
    a.download = outputFileName;
    a.click();
    URL.revokeObjectURL(url);

    // Release resources
    workbook.Dispose();
  };

  return (
    <div style={{ textAlign: 'center', height: '300px' }}>
      <h1>Convert Chartsheet To SVG</h1>
      <button onClick={chartsheetToSVG}>
        Generate
      </button>
    </div>
  );
}

export default App;
SVG output generated from a chartsheet via ToSVGStream
SVG vs PNG Comparison
| Feature | SVG | PNG |
|---|---|---|
| Scaling Quality | Sharp at any zoom | Blurry when enlarged |
| Text | Selectable and searchable | Rasterized (flat image) |
| File Size | Small (a few KB) | Large at high resolutions |
| CSS Styling | Supports inline styles | Not supported |
| Post-processing | Editable in Illustrator, Inkscape | Requires pixel-level editing |
| Browser Embedding | <img> or <embed> |
<img> tag |
Recommendation: Use SVG for web reports or scenarios where selectable text matters; use PNG when compatibility with image editors or legacy systems is required.
FAQ
Missing or garbled SVG text
Cause: The required font files are not present in the WASM virtual file system. ToSVGStream reads fonts from VFS when rendering text — if fonts are not preloaded, text areas will appear blank or garbled.
Solution: Load the font files into VFS via FetchFileToVFS before conversion:
await window.spire.FetchFileToVFS(
  'ARIAL.TTF', '/Library/Fonts/', '/'
);
SVG file cannot be opened or appears corrupted
Cause: The MIME type is incorrect when creating the Blob, so the browser cannot properly identify the file format.
Solution: Use the correct SVG MIME type:
const blob = new Blob([data], {
  type: "image/svg+xml;charset=utf-8"
});
Get a Free License
Spire.XLS for JavaScript offers a 30-day full-featured free trial license with no functional limitations. Apply here to evaluate before purchasing.
How to Download / Export Excel Files in JavaScript & React
2026-05-28 02:21:57 Written by Allen Yang
Modern web applications often need to generate downloadable Excel reports directly in the browser without relying on backend services. Whether you're building dashboards, reporting tools, or data-heavy business applications, browser-based spreadsheet export has become a common frontend requirement.
The challenge lies in creating Excel files that work across different browsers while maintaining formatting, supporting multiple output formats, and ensuring fast downloads—all without sending sensitive data to a server. Traditional approaches often require complex server-side processing or rely on limited client-side libraries.
Spire.XLS for JavaScript enables developers to generate, export, and download Excel files using JS entirely in the browser using WebAssembly technology. This approach provides true client-side Excel generation with support for multiple formats including XLS, XLSX, XLSB, ODS, PDF, XML, and XPS.
This article demonstrates how to generate and download Excel files in modern JavaScript and React applications using browser-side processing with Spire.XLS for JavaScript. We'll cover basic file generation, stream-based exports, React integration, and HTML table conversion with practical code examples.
Quick Navigation
- Why Export Excel in Browser
- Install Spire.XLS for JavaScript
- Download Excel File in JavaScript
- Export HTML Table to Excel
- React JS Export Excel Example
- About Client-Side Excel Export
- Troubleshooting
- Conclusion
- FAQ
Why Export Excel in Browser
Browser-side Excel export provides significant advantages over traditional server-side approaches:
- Enhanced Privacy – Sensitive data never leaves the client device, reducing security risks and compliance concerns
- Faster Downloads – Eliminating server round-trips reduces latency and improves user experience
- No Server-Side Processing – Reduces backend infrastructure costs and eliminates server bottlenecks
- Works Offline – Client-side generation functions even without network connectivity
- Scalable Architecture – Each user's browser handles their own export, distributing computational load
- Framework Agnostic – Works seamlessly with React, Vue, Angular, and vanilla JavaScript applications
By implementing Excel export functionality in the browser, developers can create responsive, secure, and cost-effective solutions that scale naturally with user demand.
Install Spire.XLS for JavaScript
Before generating and downloading Excel files in JavaScript, you need to install Spire.XLS for JavaScript and configure it in your development environment.
Installation via npm
Spire.XLS for JavaScript can be installed via npm:
npm i spire.xls
After installation, include the library in your project:
import { Workbook } from '@e-iceblue/spire.xls';
Note: The current WebAssembly runtime is provided through the spire.office package structure internally, even when installing spire.xls from npm. This is why initialization imports reference /node_modules/spire.office/.
Manual Installation
Alternatively, you can download the package from the e-iceblue website and copy the dependencies to your project directory.
For detailed setup instructions, refer to the Getting Started with Spire.XLS for JavaScript.
Initialize the WASM Module
Before using Spire.XLS, you must initialize the WebAssembly module. The initialization process loads required resources and sets up the runtime:
// Import and initialize the common module first
import('/node_modules/spire.office/spire.common.js').then(async (commonModule) => {
    // Initialize the WASM runtime
    await commonModule.initializeWasm();

    // Load the XLS module
    await import('/node_modules/spire.office/spire.xls.js');

    console.log('Spire.XLS ready');
});
Important Notes:
- Initialization is required before accessing
window.spirexlsorwindow.xlswasm - The browser downloads required WebAssembly resources during first load
- Always verify the module exists before performing Excel operations
Version Note: This article uses spire.office v11.4.1+. The module is accessed via window.spirexls or window.xlswasm. Older examples using window.wasmModule.spirexls may require updates.
Spire.XLS for JavaScript integrates seamlessly with all major frontend frameworks and build tools:
- React – Use with hooks (
useState,useEffect) for state-driven Excel export components - Vue.js – Integrate with Vue's reactive data system and lifecycle methods
- Angular – Compatible with Angular services and dependency injection patterns
- Next.js – Works in client-side components for server-rendered React applications
The WebAssembly module loads once at application initialization and can be shared across components, making it efficient for multi-page applications regardless of the framework choice.
Download Excel File in JavaScript
The following example demonstrates how to generate an Excel file with Spire.XLS for JavaScript and download it directly in the browser.
Create and Download an XLSX File
// Ensure the WASM module has been initialized
if (!window.spirexls && !window.xlswasm) {
    console.error("Spire.XLS is not initialized.");
    return;
}

// Get the initialized WebAssembly module
const wasmModule = window.spirexls || window.xlswasm;

// Create a new workbook
const workbook = new wasmModule.Workbook();
const worksheet = workbook.Worksheets.get(0);

// Create sample data
const products = [
    ["Product", "Quantity", "Price"],
    ["Laptop", 10, 999.99]
    ["Mouse", 50, 24.99]
]

// Insert data into the worksheet
for (let i = 0; i < products.length; i++) {
    for (let j = 0; j < products[i].length; j++) {
        if (typeof products[i][j] === "string") {
            worksheet.Range.get({ row: i + 1, column: j + 1 }).Text = products[i][j];
        }
        else {
            worksheet.Range.get({ row: i + 1, column: j + 1 }).NumberValue = products[i][j];
        }
    }
}

// Add a total column
worksheet.Range.get({ row: 1, column: products[0].length + 1 }).Text = "Total";
worksheet.Range.get({ row: 2, column: products[0].length + 1 }).Formula = "=B2*C2";
worksheet.Range.get({ row: 3, column: products[0].length + 1 }).Formula = "=B3*C3";

// Save the workbook to the virtual file system (VFS)
const outputFileName = "Report.xlsx";

workbook.SaveToFile({
    fileName: outputFileName,
    version: wasmModule.ExcelVersion.Version2016
});

// Release workbook resources
workbook.Dispose();

// Read the generated file from VFS
const fileArray =
    window.dotnetRuntime.Module.FS.readFile(outputFileName);

// Create a Blob object
const excelBlob = new Blob(
    [fileArray],
    {
        type: "application/vnd.openxmlformats-officedocument.spreadsheetml.sheet"
    }
);

// Trigger browser download
const url = URL.createObjectURL(excelBlob);
const a = document.createElement("a");
a.href = url;
a.download = outputFileName;
document.body.appendChild(a);
a.click();
document.body.removeChild(a);
URL.revokeObjectURL(url);
Below is a preview of the generated XLSX file:
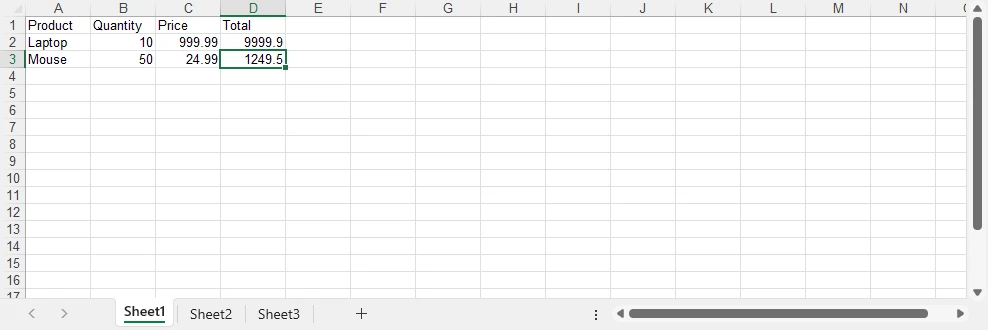
How the Export Process Works
- Create a workbook and populate worksheet data
- Save the workbook into the WebAssembly virtual file system (VFS)
- Read the generated XLSX file from VFS
- Convert the file data into a Blob object
- Trigger the browser download using a temporary URL
About the Virtual File System (VFS)
The file generated by SaveToFile() is stored in the WebAssembly virtual file system rather than the user's physical disk. This in-memory file system allows Spire.XLS to perform standard file operations securely inside the browser environment. The downloaded XLSX file is created after reading the generated file data from VFS and converting it into a browser Blob object.
Advantages of This Approach
- Works entirely in the browser
- No server-side processing required
- Uses standard browser Blob download APIs
- Supports direct XLSX file generation with Spire.XLS
If you also need to work with lightweight data exchange formats, you can further explore how to convert Excel files to CSV and import CSV data into Excel using JavaScript.
Export HTML Tables to Excel in JavaScript
In dashboard and reporting applications, business data is often displayed as HTML tables. Instead of rebuilding spreadsheet structures manually, you can directly convert existing frontend tables into Excel workbooks using Spire.XLS for JavaScript.
The following example demonstrates a complete browser-side workflow that:
- Reads an existing HTML table from the page
- Converts the HTML table into an Excel workbook
- Applies Excel-native formatting
- Downloads the generated XLSX file directly in the browser
HTML Table Export Example
async function exportTableToExcel() {

    if (!window.spirexls && !window.xlswasm) {
        alert("Spire.XLS module not loaded yet.");
        return;
    }

    const button = document.getElementById("exportBtn");

    button.disabled = true;
    button.innerText = "Exporting...";

    const wasmModule = window.spirexls || window.xlswasm;

    try {

        // Get HTML table
        const tableHtml =
            document.getElementById("salesTable").outerHTML;

        // Remove inline styles
        const safeTableHtml =
            tableHtml.replace(/style="[^"]*"/g, '');

        const htmlContent = `
            <!DOCTYPE html>
            <html>
            <head>
                <meta charset="UTF-8">
            </head>
            <body>
                ${safeTableHtml}
            </body>
            </html>
        `;

        const htmlFileName = "Table.html";

        window.dotnetRuntime.Module.FS.writeFile(
            htmlFileName,
            htmlContent
        );

        const workbook = new wasmModule.Workbook();

        workbook.LoadFromHtml(htmlFileName);

        const sheet = workbook.Worksheets.get(0);

        const lastRow = Number(sheet.LastRow);
        const lastCol = Number(sheet.LastColumn);

        const headerRow =
            sheet.Range.get_Item(1, 1, 1, lastCol);

        headerRow.BuiltInStyle =
            wasmModule.BuiltInStyles.Heading3;

        for (let i = 2; i <= lastRow; i++) {

            const row =
                sheet.Range.get_Item(i, 1, i, lastCol);

            row.BuiltInStyle =
                i % 2 === 0
                    ? wasmModule.BuiltInStyles.Accent3_20
                    : wasmModule.BuiltInStyles.Accent3_60;
        }

        for (let j = 1; j <= lastCol; j++) {
            sheet.AutoFitColumn(j);
        }

        const outputFileName = "SalesReport.xlsx";

        workbook.SaveToFile({
            fileName: outputFileName,
            version: wasmModule.ExcelVersion.Version2016
        });

        workbook.Dispose();

        const fileData =
            window.dotnetRuntime.Module.FS.readFile(outputFileName);

        const blob = new Blob([fileData], {
            type:
                "application/vnd.openxmlformats-officedocument.spreadsheetml.sheet"
        });

        const url = URL.createObjectURL(blob);

        const a = document.createElement("a");

        a.href = url;
        a.download = outputFileName;

        document.body.appendChild(a);
        a.click();

        document.body.removeChild(a);

        URL.revokeObjectURL(url);

    } catch (error) {

        alert("Export failed: " + error.message);

    } finally {

        button.disabled = false;
        button.innerText = "Export Excel";
    }
}
The following screenshot shows the HTML-based sales report table example displayed in the browser before export.

After exporting, the generated Excel workbook preserves the tabular structure and applies additional Excel-native formatting.
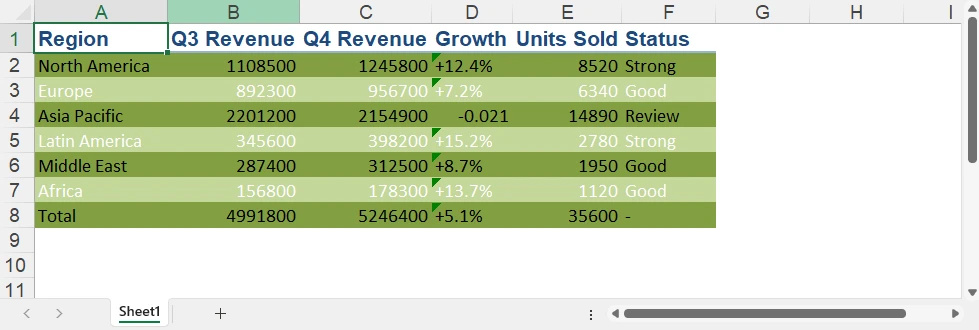
Why Use HTML-based Excel Export
Using HTML-based export provides several advantages for modern web applications:
- Reuse existing frontend tables without rebuilding spreadsheet layouts
- Reduce duplicate data formatting and export logic
- Apply Excel-native styles after importing HTML tables
- Export business reports directly from dashboard pages
With Spire.XLS for JavaScript, you can quickly convert browser-rendered HTML tables into downloadable Excel files while keeping the entire export workflow on the client side.
For scenarios that require rendering Excel spreadsheets as browser-based HTML tables, you can also refer to our article about converting Excel to HTML in JavaScript.
Export Excel in React with JavaScript
Integrating Excel export into React applications is straightforward. The key is initializing the WebAssembly runtime before rendering React components and properly releasing workbook resources after export operations.
Initialize Spire.XLS in React
Before creating export components, initialize the WebAssembly module in your app entry file (main.jsx or index.js):
import { StrictMode } from 'react';
import { createRoot } from 'react-dom/client';
import App from './App.jsx';

// Initialize Spire.XLS before mounting React
const initializeSpire = async () => {

    // Load the common runtime
    const commonModule = await import(
        '/node_modules/spire.office/spire.common.js'
    );

    // Initialize WebAssembly runtime
    await commonModule.initializeWasm();

    // Load Spire.XLS module
    await import(
        '/node_modules/spire.office/spire.xls.js'
    );

    // Optional: preload fonts if needed
    // await window.spire.FetchFileToVFS(
    //     'ARIAL.TTF',
    //     '/Library/Fonts/',
    //     '/'
    // );
};

// Start React app after initialization
initializeSpire().then(() => {

    createRoot(document.getElementById('root')).render(
        <StrictMode>
            <App />
        </StrictMode>
    );

});
Then use the React export component below in your application.
Simplified React Excel Export Component
Here's a minimal React component that demonstrates the core export pattern:
import { useState } from 'react'

const ExcelExportButton = () => {
    const [isProcessing, setIsProcessing] = useState(false);

    const handleExport = async () => {
        if ((!window.spirexls && !window.xlswasm) || isProcessing) return;

        setIsProcessing(true);
        const wasmModule = window.spirexls || window.xlswasm;

        try {
            // Create a new workbook and get the first default worksheet
            const workbook = new wasmModule.Workbook();
            const worksheet = workbook.Worksheets.get(0);

            // Insert data into the worksheet
            worksheet.Range.get("A1").Text = "Product";
            worksheet.Range.get("B1").Text = "Revenue";
            worksheet.Range.get("A2").Text = "Laptop";
            worksheet.Range.get("B2").NumberValue = 9999.90;
            worksheet.Range.get("A3").Text = "Smartphone";
            worksheet.Range.get("B3").NumberValue = 4999.99;

            const outputFileName = "Report.xlsx";

            // Save the workbook to a file in the VFS
            workbook.SaveToFile({
                fileName: outputFileName,
                version: wasmModule.ExcelVersion.Version2016
            });

            workbook.Dispose();

            const fileArray = window.dotnetRuntime.Module.FS.readFile(outputFileName);

            const excelBlob = new Blob([fileArray], {
                type: "application/vnd.openxmlformats-officedocument.spreadsheetml.sheet"
            });

            const url = URL.createObjectURL(excelBlob);

            const a = document.createElement('a');
            a.href = url;
            a.download = outputFileName;
            document.body.appendChild(a);
            a.click();
            document.body.removeChild(a);

            URL.revokeObjectURL(url);

        } catch (error) {
            console.error("Excel export failed:", error);
        } finally {
            setIsProcessing(false);
        }
    };

    return (
        <button onClick={handleExport} disabled={isProcessing}>
            {isProcessing ? "Generating..." : "Export to Excel"}
        </button>
    );
}

export default function App() {
    return (
        <div>
            <h1>Spire.XLS Demo</h1>
            <ExcelExportButton />
        </div>
    );
}
Key Implementation Details:
- Minimal state – Only track
isProcessingto disable the button during export - Direct download – Trigger download immediately without storing URLs in state
- Resource cleanup – Always call
Dispose()on workbook objects to prevent memory leaks - Error handling – Wrap export logic in try-catch blocks for robust error management
- Loading states – Disable buttons during processing to prevent duplicate exports
Usage in Your App:
import { ExcelExportButton } from './ExcelExportButton';

function App() {
    return (
        <div>
            <h1>Sales Dashboard</h1>
            <ExcelExportButton />
        </div>
    );
}
This simplified approach focuses on the essential export flow without unnecessary complexity. For more advanced scenarios like loading external files or fonts, refer to the complete documentation.
If you also need browser-side document distribution workflows, you can further explore how to convert Excel files to PDF in JavaScript and React applications.
Client-Side Excel Generation in JavaScript Without Backend
Modern web applications increasingly generate Excel files directly in the browser instead of relying on backend services. With Spire.XLS for JavaScript, spreadsheet creation, formatting, and export operations run entirely on the client side using WebAssembly.
Why No Backend Server Is Needed
Traditional Excel export workflows usually require a server to:
- Receive frontend data
- Generate spreadsheet files
- Return downloadable files to the browser
With WebAssembly-based processing, these steps happen entirely inside the browser runtime instead.
Benefits of Browser-side Excel Export
Compared with traditional server-side export workflows, client-side Excel generation provides several advantages:
| Feature | Browser-side Export | Server-side Export |
|---|---|---|
| Data Processing | Runs locally in browser | Requires backend server |
| Privacy | Data stays on client device | Data sent over network |
| Response Speed | Instant local processing | Depends on network latency |
| Infrastructure Cost | No export server required | Requires backend resources |
| Offline Support | Supported | Usually unavailable |
| Scalability | Handled by client devices | Limited by server capacity |
How Browser-side Export Works
When using Spire.XLS for JavaScript:
- The WebAssembly runtime loads in the browser
- Spreadsheet processing runs locally in memory
- Files are temporarily stored in the browser virtual file system (VFS)
- JavaScript converts the generated file into a downloadable Blob
- The browser triggers the download directly
This architecture makes browser-based Excel export especially suitable for dashboards, reporting systems, internal business tools, and privacy-sensitive applications.
Troubleshooting and Best Practices
When using Spire.XLS for JavaScript in browser environments, the following issues are commonly encountered.
WASM Module Not Initialized
If window.spirexls or window.xlswasm is undefined, ensure the WebAssembly runtime is fully initialized before using the API:
await commonModule.initializeWasm();
await import('/node_modules/spire.office/spire.xls.js');
Missing Resource or ZIP Loading Errors
If the browser console shows 404 errors or WebAssembly loading failures:
- Ensure ZIP and WASM resources are placed in the correct static directory
- Vite projects should place assets in the
public/folder - Verify the browser can successfully load
.zipand.wasmfiles
Font-related Warnings
Some environments may display warnings such as:
"Arial font is not installed"
You can preload fonts before creating workbooks:
await window.spire.FetchFileToVFS(
    'ARIAL.TTF',
    '/Library/Fonts/',
    '/'
);
Invalid or Corrupted XLSX Files
If Excel opens with repair warnings, explicitly specify the Excel version during export:
workbook.SaveToFile({
    fileName: outputFileName,
    version: wasmModule.ExcelVersion.Version2016
});
Memory Management
Always release workbook resources after export to avoid memory leaks in long-running applications:
const workbook = new wasmModule.Workbook();

try {
    // Excel operations
} finally {
    workbook.Dispose();
}
Browser-side Performance Considerations
For very large datasets, browser-side processing may become slow or memory-intensive. In such scenarios:
- Show loading indicators during export
- Avoid exporting extremely large datasets in a single operation
- Consider server-side processing for enterprise-scale reports
Conclusion
Spire.XLS for JavaScript provides a practical way to generate and export Excel files directly in modern web applications using JavaScript and WebAssembly. Its browser-based architecture makes it suitable for dashboards, reporting systems, and frontend applications that require downloadable spreadsheet generation without relying on backend services.
The examples in this article demonstrate how to build browser-based Excel export workflows using JavaScript, React, and WebAssembly while keeping spreadsheet processing entirely on the client side. You can apply for a 30-day free license to evaluate all features before purchasing.
FAQ
Q1: Can I download Excel files in JavaScript without a backend server?
A1: Yes. Spire.XLS for JavaScript uses WebAssembly technology to generate and download Excel files entirely in the browser. The workbook is created in browser memory and downloaded directly without requiring any backend API or server-side processing.
Q2: How do I export HTML tables to Excel in JavaScript?
A2: You can extract an existing HTML table from the DOM, write the HTML into the WebAssembly virtual file system, and load it into a workbook using LoadFromHtml(). This approach allows you to reuse browser-rendered tables without rebuilding spreadsheet layouts manually.
Q3: Can I use Spire.XLS for JavaScript in React applications?
A3: Yes. Spire.XLS for JavaScript works with React, Vite, and other modern frontend frameworks. You only need to initialize the WebAssembly module before rendering components and then perform Excel operations directly inside React components or utility functions.
Q4: Why does Excel show a repair warning when opening exported files?
A4: This usually happens when the Excel version is not explicitly specified during export. To avoid compatibility issues, specify the output version when calling SaveToFile():
workbook.SaveToFile({
    fileName: outputFileName,
    version: wasmModule.ExcelVersion.Version2016
});
Insert Rows and Columns in Excel with JavaScript in React
2025-04-07 00:56:21 Written by AdministratorWhen dealing with Excel worksheets, there are times when the existing layout needs to be adjusted. Inserting rows and columns serves as an effective solution for such scenarios. It allows users to seamlessly expand their data, add new information, or re-structure the spreadsheet in a way that optimizes both data entry and analysis. This action not only makes room for more content, but also enhances the overall organization and readability of the data. In this article, you will learn how to insert rows and columns in Excel in React using Spire.XLS for JavaScript.
- Insert a Row and a Column in Excel in JavaScript
- Insert Multiple Rows and Columns in Excel in JavaScript
Install Spire.XLS for JavaScript
To get started with inserting or deleting picture in Excel in a React application, you can either download Spire.XLS for JavaScript from our website or install it via npm with the following command:
npm i spire.office
The downloaded product package has been integrated Spire.Doc for JavaScript,Spire.XLS for JavaScript,Spire.PDF for JavaScript,Spire.Presentation for JavaScript. To use the functionality of Spire.XLS for JavaScript, you need to copy the corresponding files (spire.xls.js, Spire.Xls.Wasm.zip, spire.common.js, Spire.Common.Wasm.zip, and _framework) to the project's "public" folder. At the same time, in order to ensure text rendering, the related font files can be added with custom paths. In the following example, the font addition path is: public\static\font.
For more details, refer to the documentation: How to Integrate Spire.XLS for JavaScript in a React Project
Insert a Row and a Column in Excel in JavaScript
Using Spire.XLS for JavaScript, a blank row or a blank column can be inserted into an Excel worksheet via the Worksheet.InsertRow(rowIndex) or Worksheet.InsertColumn(columnIndex) method. The following are the main steps.
- Create a Workbook object using the new wasmModule.Workbook() method.
- Get a specific worksheet using the Workbook.Worksheets.get() method.
- Insert a row into the worksheet using the Worksheet.InsertRow(rowIndex) method.
- Insert a column into the worksheet using the Worksheet.InsertColumn(columnIndex) method.
- Save the result file using the Workbook.SaveToFile() method.
- JavaScript
import React, { useState, useEffect } from 'react';
function App() {
  const [wasmModule, setWasmModule] = useState(null);
  // Load Spire.XLS
  useEffect(() => {
    (async () => {
      try {
        const publicUrl = process.env.PUBLIC_URL || '';
        const spireModule = await import(/* webpackIgnore: true */ `${publicUrl}/spire.xls.js`);
        const rawModule = spireModule.default || spireModule;
        window.wasmModule = typeof rawModule === 'function'
          ? await rawModule({ locateFile: p => p.endsWith('.wasm') ? `${publicUrl}/${p}` : p })
          : rawModule;
        setWasmModule(window.wasmModule);
      } catch (error) {
        console.error('Failed to load spire.xls.js WASM module:', error);
      }
    })();
  }, []);

  //  Function to insert a row and a column
  const InsertRowColumn = async () => {
    const wasmModule = window.wasmModule.spirexls;

    if (wasmModule) {
      // Load font into Virtual File System (VFS)
      await window.spire.FetchFileToVFS('Arial.ttf', '/Library/Fonts/', `${process.env.PUBLIC_URL}/static/font/`);


      // Load the Excel files into the virtual file system (VFS)
      let inputFileName = 'merged.xlsx';
      await window.spire.FetchFileToVFS(inputFileName, '', `${process.env.PUBLIC_URL}/static/data/`);


      // Create a new workbook
      let workbook = new wasmModule.Workbook();


      // Load an Excel document
      workbook.LoadFromFile({ fileName: inputFileName });

      // Get the first worksheet
      let worksheet = workbook.Worksheets.get(0);

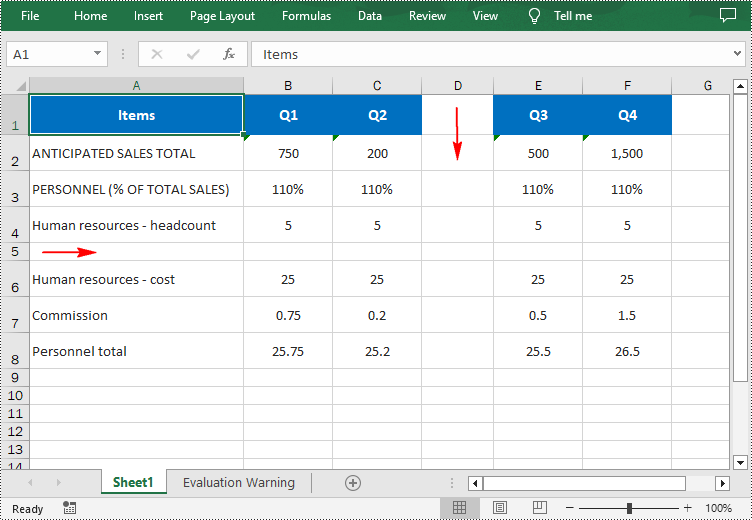
      // Insert a blank row as the 5th row in the worksheet
      worksheet.InsertRow(5);

      // Insert a blank column as the 4th column in the worksheet
      worksheet.InsertColumn(4);

      //Save result file
      const outputFileName = 'InsertRowAndColumn.xlsx';
      workbook.SaveToFile({ fileName: outputFileName, version: wasmModule.ExcelVersion.Version2016 });

      // Read the saved file and convert to Blob object
      const modifiedFileArray = window.dotnetRuntime.Module.FS.readFile(outputFileName);
      const modifiedFile = new Blob([modifiedFileArray], { type: 'application/vnd.openxmlformats-officedocument.spreadsheetml.sheet' });

      // Create a URL for the Blob and initiate download
      const url = URL.createObjectURL(modifiedFile);
      const a = document.createElement('a');
      a.href = url;
      a.download = outputFileName;
      document.body.appendChild(a);
      a.click();
      document.body.removeChild(a);
      URL.revokeObjectURL(url);

      // Clean up resources used by the workbook
      workbook.Dispose();
    }
  };

  return (
    <div style={{ textAlign: 'center', height: '300px' }}>
      <h1>Insert Row and Column in Excel Using JavaScript in React </h1>
      <button onClick={InsertRowColumn} disabled={!wasmModule}>
        Process
      </button>
    </div>
  );
}

export default App;
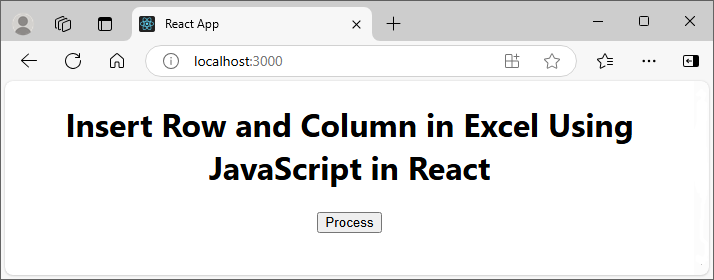
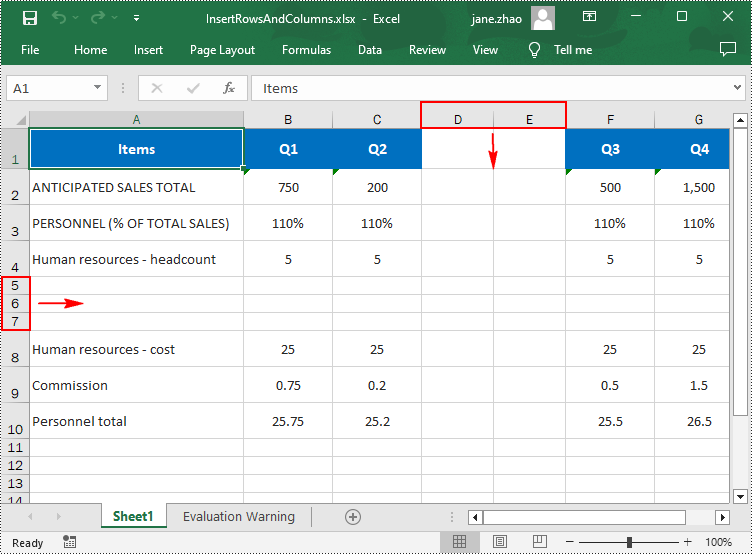
Run the code to launch the React app at localhost:3000. Once it's running, click the "Process" button to insert rows and columns in Excel:
Below is the result file:
Insert Multiple Rows and Columns in Excel in JavaScript
To insert multiple rows or columns, use the Worksheet.InsertRow(rowIndex: number, rowCount: number) or Worksheet.InsertColumn(columnIndex: number, columnCount: number) methods. The first parameter represents the index at which the new row/column will be inserted, and the second argument represents the number of rows/columns to be inserted. The following are the main steps.
- Create a Workbook object using the new wasmModule.Workbook() method.
- Load an Excel file using the Workbook.LoadFromFile() method.
- Get a specific worksheet using the Workbook.Worksheets.get() method.
- Insert multiple rows into the worksheet using the Worksheet.InsertRow(rowIndex: number, rowCount: number) method.
- Insert multiple columns into the worksheet using Worksheet.InsertColumn(columnIndex: number, columnCount: number) method.
- Save the result file using the Workbook.SaveToFile() method.
- JavaScript
import React, { useState, useEffect } from 'react';
function App() {
  const [wasmModule, setWasmModule] = useState(null);
  // Load Spire.XLS
  useEffect(() => {
    (async () => {
      try {
        const publicUrl = process.env.PUBLIC_URL || '';
        const spireModule = await import(/* webpackIgnore: true */ `${publicUrl}/spire.xls.js`);
        const rawModule = spireModule.default || spireModule;
        window.wasmModule = typeof rawModule === 'function'
          ? await rawModule({ locateFile: p => p.endsWith('.wasm') ? `${publicUrl}/${p}` : p })
          : rawModule;
        setWasmModule(window.wasmModule);
      } catch (error) {
        console.error('Failed to load spire.xls.js WASM module:', error);
      }
    })();
  }, []);

  // Function to insert multiple rows and columns
  const InsertRowsColumns = async () => {
    const wasmModule = window.wasmModule.spirexls;

    if (wasmModule) {
      // Load font into Virtual File System (VFS)
      await window.spire.FetchFileToVFS('Arial.ttf', '/Library/Fonts/', `${process.env.PUBLIC_URL}/static/font/`);


      // Load the Excel files into the virtual file system (VFS)
      let inputFileName = 'merged.xlsx';
      await window.spire.FetchFileToVFS(inputFileName, '', `${process.env.PUBLIC_URL}/static/data/`);


      // Create a new workbook
      let workbook = new wasmModule.Workbook();


      // Load an Excel document
      workbook.LoadFromFile({ fileName: inputFileName });

      // Get the first worksheet
      let worksheet = workbook.Worksheets.get(0);

      // Insert three blank rows into the worksheet
      worksheet.InsertRow({ rowIndex: 5, rowCount: 3 });

      // Insert two blank columns into the worksheet
      worksheet.InsertColumn({ columnIndex: 4, columnCount: 2 });

      //Save result file
      const outputFileName = 'InsertRowsAndColumns.xlsx';
      workbook.SaveToFile({ fileName: outputFileName, version: wasmModule.ExcelVersion.Version2016 });

      // Read the saved file and convert to Blob object
      const modifiedFileArray = window.dotnetRuntime.Module.FS.readFile(outputFileName);
      const modifiedFile = new Blob([modifiedFileArray], { type: 'application/vnd.openxmlformats-officedocument.spreadsheetml.sheet' });

      // Create a URL for the Blob and initiate download
      const url = URL.createObjectURL(modifiedFile);
      const a = document.createElement('a');
      a.href = url;
      a.download = outputFileName;
      document.body.appendChild(a);
      a.click();
      document.body.removeChild(a);
      URL.revokeObjectURL(url);

      // Clean up resources used by the workbook
      workbook.Dispose();
    }
  };

  return (
  <div style={{ textAlign: 'center', height: '300px' }}>
    <h1>Insert Rows and Columns in Excel Using JavaScript in React</h1>
    <button onClick={InsertRowsColumns} disabled={!wasmModule}>
      Process
    </button>
      </div>
  );
}

export default App;
Get a Free License
To fully experience the capabilities of Spire.XLS for JavaScript without any evaluation limitations, you can request a free 30-day trial license.
Lock Cells, Rows, and Columns in Excel with JavaScript in React
2025-03-11 01:57:59 Written by AdministratorWhen working with Excel, you may sometimes need to protect critical data while allowing users to edit other parts of the worksheet. This is especially important for scenarios where certain formulas, headers, or reference values must remain unchanged to ensure data integrity. By locking specific areas, you can prevent accidental modifications, maintain consistency, and control access to key information within the spreadsheet. In this article, you will learn how to lock cells, rows, and columns in Excel in React using JavaScript and the Spire.XLS for JavaScript library.
Install Spire.XLS for JavaScript
To get started with locking cells, rows, and columns in Excel files within a React application, you can either download Spire.XLS for JavaScript from our website or install it via npm with the following command:
npm i spire.office
The downloaded product package has been integrated Spire.Doc for JavaScript,Spire.XLS for JavaScript,Spire.PDF for JavaScript,Spire.Presentation for JavaScript. To use the functionality of Spire.XLS for JavaScript, you need to copy the corresponding files (spire.xls.js, Spire.Xls.Wasm.zip, spire.common.js, Spire.Common.Wasm.zip, and _framework) to the project's "public" folder. At the same time, in order to ensure text rendering, the related font files can be added with custom paths. In the following example, the font addition path is: public\static\font.
For more details, refer to the documentation: How to Integrate Spire.XLS for JavaScript in a React Project
Lock Cells in Excel
Spire.XLS for JavaScript offers the Worksheet.Range.get().Style.Locked property, allowing you to protect critical data cells while enabling edits to the rest of the worksheet. The detailed steps are as follows.
- Create a Workbook object using the new wasmModule.Workbook() method.
- Load a sample Excel file using the Workbook.LoadFromFile() method.
- Get the first worksheet using the Workbook.Worksheets.get() method.
- Unlock all cells in the used range of the worksheet by setting the Worksheet.Range.Style.Locked property to "false".
- Set text for specific cells using the Worksheet.Range.get().Text property and then lock them by setting the Worksheet.Range.get().Style.Locked property to "true".
- Protect the worksheet with a password using the Worksheet.Protect() method.
- Save the result file using the Workbook.SaveToFile() method.
- JavaScript
import React, { useState, useEffect } from 'react';
function App() {
  const [wasmModule, setWasmModule] = useState(null);
  // Load Spire.XLS
  useEffect(() => {
    (async () => {
      try {
        const publicUrl = process.env.PUBLIC_URL || '';
        const spireModule = await import(/* webpackIgnore: true */ `${publicUrl}/spire.xls.js`);
        const rawModule = spireModule.default || spireModule;
        window.wasmModule = typeof rawModule === 'function'
          ? await rawModule({ locateFile: p => p.endsWith('.wasm') ? `${publicUrl}/${p}` : p })
          : rawModule;
        setWasmModule(window.wasmModule);
      } catch (error) {
        console.error('Failed to load spire.xls.js WASM module:', error);
      }
    })();
  }, []);

  //  Function to lock specific cells in Excel
  const LockExcelCells = async () => {
    const wasmModule = window.wasmModule.spirexls;

    if (wasmModule) {
      // Load font into Virtual File System (VFS)
      await window.spire.FetchFileToVFS('Arial.ttf', '/Library/Fonts/', `${process.env.PUBLIC_URL}/static/font/`);


      // Load the Excel files into the virtual file system (VFS)
      let inputFileName = 'sample.xlsx';
      await window.spire.FetchFileToVFS(inputFileName, '', `${process.env.PUBLIC_URL}/static/data/`);


      // Create a new workbook
      let workbook = new wasmModule.Workbook();

      // Load the Excel file from the virtual file system
      workbook.LoadFromFile({ fileName: inputFileName });

      // Get the first worksheet
      let sheet = workbook.Worksheets.get(0);

      // Unlock all cells in the used range of the worksheet
      sheet.Range.Style.Locked = false;

      // Lock a specific cell in the worksheet
      sheet.Range.get("A1").Text = "Locked";
      sheet.Range.get("A1").Style.Locked = true;

      // Lock a specific cell range in the worksheet
      sheet.Range.get("C1:E3").Text = "Locked";
      sheet.Range.get("C1:E3").Style.Locked = true;

      // Protect the worksheet with a password
      sheet.Protect({ password: "123", options: wasmModule.SheetProtectionType.All });

      let outputFileName = "LockCells.xlsx";
      // Save the resulting file
      workbook.SaveToFile({ fileName: outputFileName, version: wasmModule.ExcelVersion.Version2013 });

      // Read the saved file and convert to Blob object
      const modifiedFileArray = window.dotnetRuntime.Module.FS.readFile(outputFileName);
      const modifiedFile = new Blob([modifiedFileArray], { type: 'application/vnd.openxmlformats-officedocument.spreadsheetml.sheet' });

      // Create a URL for the Blob and initiate download
      const url = URL.createObjectURL(modifiedFile);
      const a = document.createElement('a');
      a.href = url;
      a.download = outputFileName;
      document.body.appendChild(a);
      a.click();
      document.body.removeChild(a);
      URL.revokeObjectURL(url);

      // Clean up resources used by the workbook
      workbook.Dispose();
    }
  };

  return (
    <div style={{ textAlign: 'center', height: '300px' }}>
      <h1>Lock Specific Cells in Excel Using JavaScript in React</h1>
      <button onClick={LockExcelCells} disabled={!wasmModule}>
        Lock
      </button>
    </div>
  );
}

export default App;
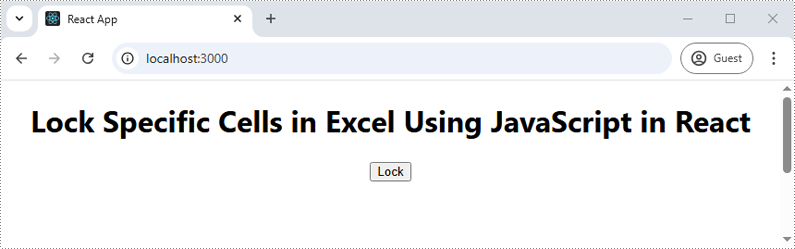
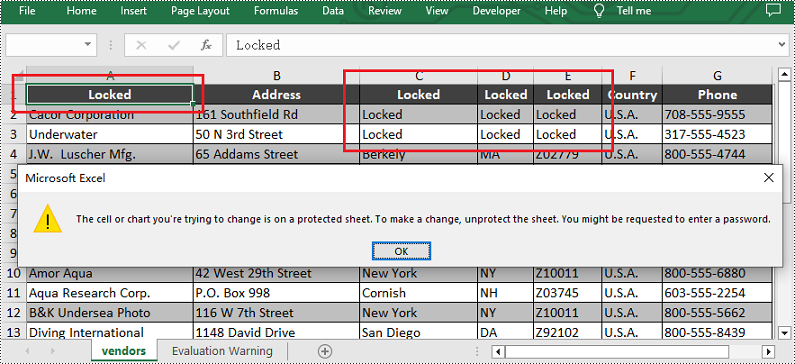
Run the code to launch the React app at localhost:3000. Once it's running, click on the "Lock" button to lock specific cells in the Excel file:
Upon opening the output Excel sheet and attempting to edit the protected cells, a dialog box will appear, notifying you that the cell you're trying to change is on a protected sheet:
Lock Rows in Excel
If you need to preserve row-based data, such as headers or summaries, you can lock entire rows using the Worksheet.Rows.get().Style.Locked property in Spire.XLS for JavaScript. The detailed steps are as follows.
- Create a Workbook object using the new wasmModule.Workbook() method.
- Load a sample Excel file using the Workbook.LoadFromFile() method.
- Get the first worksheet using the Workbook.Worksheets.get() method.
- Unlock all cells in the used range of the worksheet by setting the Worksheet.Range.Style.Locked property to "false".
- Set text for a specific row using the Worksheet.Rows.get().Text property and then lock it by setting the Worksheet.Rows.get().Style.Locked property to "true".
- Protect the worksheet with a password using the Worksheet.Protect() method.
- Save the result file using the Workbook.SaveToFile() method.
- JavaScript
import React, { useState, useEffect } from 'react';
function App() {
  const [wasmModule, setWasmModule] = useState(null);
  // Load Spire.XLS
  useEffect(() => {
    (async () => {
      try {
        const publicUrl = process.env.PUBLIC_URL || '';
        const spireModule = await import(/* webpackIgnore: true */ `${publicUrl}/spire.xls.js`);
        const rawModule = spireModule.default || spireModule;
        window.wasmModule = typeof rawModule === 'function'
          ? await rawModule({ locateFile: p => p.endsWith('.wasm') ? `${publicUrl}/${p}` : p })
          : rawModule;
        setWasmModule(window.wasmModule);
      } catch (error) {
        console.error('Failed to load spire.xls.js WASM module:', error);
      }
    })();
  }, []);

  // Function to lock specific rows in Excel
  const LockExcelRows = async () => {
    const wasmModule = window.wasmModule.spirexls;

    if (wasmModule) {
      // Load font into Virtual File System (VFS)
      await window.spire.FetchFileToVFS('Arial.ttf', '/Library/Fonts/', `${process.env.PUBLIC_URL}/static/font/`);


      // Load the Excel files into the virtual file system (VFS)
      let inputFileName = 'sample.xlsx';
      await window.spire.FetchFileToVFS(inputFileName, '', `${process.env.PUBLIC_URL}/static/data/`);


      // Create a new workbook
      let workbook = new wasmModule.Workbook();

      // Load the Excel file from the virtual file system
      workbook.LoadFromFile({ fileName: inputFileName });

      // Get the first worksheet
      let sheet = workbook.Worksheets.get(0);

      // Unlock all cells in the used range of the worksheet
      sheet.Range.Style.Locked = false;

      // Lock the third row in the worksheet
      sheet.Rows.get(2).Text = "Locked";
      sheet.Rows.get(2).Style.Locked = true;

      // Protect the worksheet with a password
      sheet.Protect({ password: "123", options: wasmModule.SheetProtectionType.All });

      let outputFileName = "LockRows.xlsx";
      // Save the resulting file
      workbook.SaveToFile({ fileName: outputFileName, version: wasmModule.ExcelVersion.Version2013 });

      // Read the saved file and convert to Blob object
      const modifiedFileArray = window.dotnetRuntime.Module.FS.readFile(outputFileName);
      const modifiedFile = new Blob([modifiedFileArray], { type: 'application/vnd.openxmlformats-officedocument.spreadsheetml.sheet' });

      // Create a URL for the Blob and initiate download
      const url = URL.createObjectURL(modifiedFile);
      const a = document.createElement('a');
      a.href = url;
      a.download = outputFileName;
      document.body.appendChild(a);
      a.click();
      document.body.removeChild(a);
      URL.revokeObjectURL(url);

      // Clean up resources used by the workbook
      workbook.Dispose();
    }
  };

  return (
    <div style={{ textAlign: 'center', height: '300px' }}>
      <h1>Lock Specific Rows in Excel Using JavaScript in React</h1>
      <button onClick={LockExcelRows} disabled={!wasmModule}>
        Lock
      </button>
    </div>
  );
}

export default App;
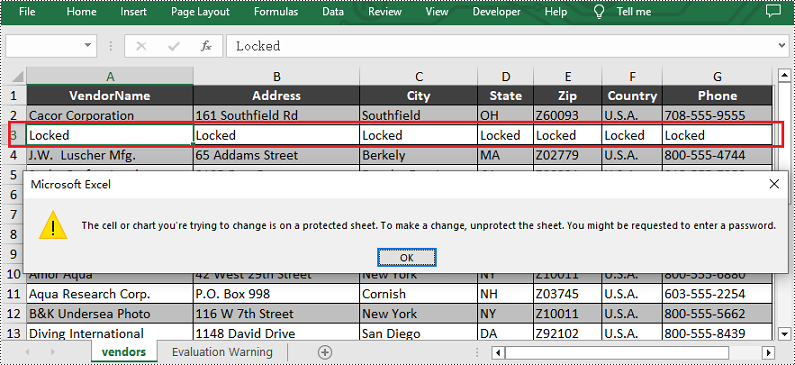
Lock Columns in Excel
To maintain the integrity of key vertical data, such as fixed identifiers or category labels, you can lock entire columns using the Worksheet.Columns.get().Style.Locked property in Spire.XLS for JavaScript. The detailed steps are as follows.
- Create a Workbook object using the new wasmModule.Workbook() method.
- Load a sample Excel file using the Workbook.LoadFromFile() method.
- Get the first worksheet using the Workbook.Worksheets.get() method.
- Unlock all cells in the used range of the worksheet by setting the Worksheet.Range.Style.Locked property to "false".
- Set text for a specific column using the Worksheet.Columns.get().Text property and then lock it by setting the Worksheet.Columns.get().Style.Locked property to "true".
- Protect the worksheet with a password using the Worksheet.Protect() method.
- Save the result file using the Workbook.SaveToFile() method.
- JavaScript
import React, { useState, useEffect } from 'react';
function App() {
  const [wasmModule, setWasmModule] = useState(null);
  // Load Spire.XLS
  useEffect(() => {
    (async () => {
      try {
        const publicUrl = process.env.PUBLIC_URL || '';
        const spireModule = await import(/* webpackIgnore: true */ `${publicUrl}/spire.xls.js`);
        const rawModule = spireModule.default || spireModule;
        window.wasmModule = typeof rawModule === 'function'
          ? await rawModule({ locateFile: p => p.endsWith('.wasm') ? `${publicUrl}/${p}` : p })
          : rawModule;
        setWasmModule(window.wasmModule);
      } catch (error) {
        console.error('Failed to load spire.xls.js WASM module:', error);
      }
    })();
  }, []);

  // Function to lock specific columns in Excel
  const LockExcelColumns = async () => {
    const wasmModule = window.wasmModule.spirexls;

    if (wasmModule) {
      // Load font into Virtual File System (VFS)
      await window.spire.FetchFileToVFS('Arial.ttf', '/Library/Fonts/', `${process.env.PUBLIC_URL}/static/font/`);


      // Load the Excel files into the virtual file system (VFS)
      let inputFileName = 'sample.xlsx';
      await window.spire.FetchFileToVFS(inputFileName, '', `${process.env.PUBLIC_URL}/static/data/`);


      // Create a new workbook
      let workbook = new wasmModule.Workbook();

      // Load the Excel file from the virtual file system
      workbook.LoadFromFile({ fileName: inputFileName });

      // Get the first worksheet
      let sheet = workbook.Worksheets.get(0);

      // Unlock all cells in the used range of the worksheet
      sheet.Range.Style.Locked = false;

      // Lock the fourth column in the worksheet
      sheet.Columns.get(3).Text = "Locked";
      sheet.Columns.get(3).Style.Locked = true;

      // Protect the worksheet with a password
      sheet.Protect({ password: "123", options: wasmModule.SheetProtectionType.All });

      let outputFileName = "LockColumns.xlsx";
      // Save the resulting file
      workbook.SaveToFile({ fileName: outputFileName, version: wasmModule.ExcelVersion.Version2013 });

      // Read the saved file and convert to Blob object
      const modifiedFileArray = window.dotnetRuntime.Module.FS.readFile(outputFileName);
      const modifiedFile = new Blob([modifiedFileArray], { type: 'application/vnd.openxmlformats-officedocument.spreadsheetml.sheet' });

      // Create a URL for the Blob and initiate download
      const url = URL.createObjectURL(modifiedFile);
      const a = document.createElement('a');
      a.href = url;
      a.download = outputFileName;
      document.body.appendChild(a);
      a.click();
      document.body.removeChild(a);
      URL.revokeObjectURL(url);

      // Clean up resources used by the workbook
      workbook.Dispose();
    }
  };

  return (
    <div style={{ textAlign: 'center', height: '300px' }}>
      <h1>Lock Specific Columns in Excel Using JavaScript in React</h1>
      <button onClick={LockExcelColumns} disabled={!wasmModule}>
        Lock
      </button>
    </div>
  );
}

export default App;
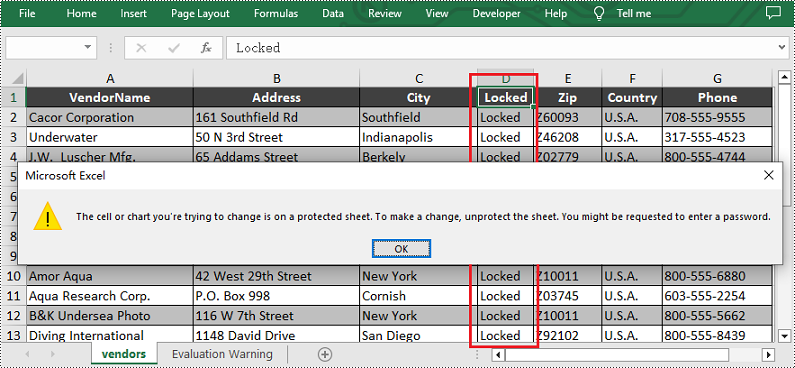
Get a Free License
To fully experience the capabilities of Spire.XLS for JavaScript without any evaluation limitations, you can request a free 30-day trial license.
Merging Excel files is a common task that many people encounter when working with data. As projects expand or teams collaborate, you may find yourself with multiple spreadsheets that need to be combined into one cohesive document. This process not only helps in organizing information but also makes it easier to analyze and draw insights from your data. Whether you're dealing with financial records, project updates, or any other type of data, knowing how to merge Excel files effectively can save you time and effort. In this guide, we'll explain how to programmatically merge Excel files into one in React using Spire.XLS for JavaScript.
Install Spire.XLS for JavaScript
To get started with merging Excel files into one in a React application, you can either download Spire.XLS for JavaScript from our website or install it via npm with the following command:
npm i spire.office
The downloaded product package has been integrated Spire.Doc for JavaScript,Spire.XLS for JavaScript,Spire.PDF for JavaScript,Spire.Presentation for JavaScript. To use the functionality of Spire.XLS for JavaScript, you need to copy the corresponding files (spire.xls.js, Spire.Xls.Wasm.zip, spire.common.js, Spire.Common.Wasm.zip, and _framework) to the project's "public" folder. At the same time, in order to ensure text rendering, the related font files can be added with custom paths. In the following example, the font addition path is: public\static\font.
For more details, refer to the documentation: How to Integrate Spire.XLS for JavaScript in a React Project
Merge Multiple Excel Workbooks into One
Combining multiple Excel workbooks allows you to merge distinct files into a single workbook, which simplifies the management and analysis of diverse datasets for comprehensive reporting.
With Spire.XLS for JavaScript, developers can efficiently merge multiple workbooks by copying worksheets from the source workbooks into a newly created workbook using the XlsWorksheetsCollection.AddCopy() method. The key steps are as follows.
- Put the file paths of the workbooks to be merged into a list.
- Initialize a Workbook object to create a new workbook and clear its default worksheets.
- Initialize a temporary Workbook object.
- Loop through the list of file paths.
- Load each workbook specified by the file path in the list into the temporary Workbook object using Workbook.LoadFromFile() method.
- Loop through the worksheets in the temporary workbook, then copy each worksheet from the temporary workbook to the newly created workbook using XlsWorksheetsCollection.AddCopy() method.
- Save the resulting workbook using Workbook.SaveToFile() method.
- JavaScript
import React, { useState, useEffect } from 'react';
function App() {
  const [wasmModule, setWasmModule] = useState(null);
  // Load Spire.XLS
  useEffect(() => {
    (async () => {
      try {
        const publicUrl = process.env.PUBLIC_URL || '';
        const spireModule = await import(/* webpackIgnore: true */ `${publicUrl}/spire.xls.js`);
        const rawModule = spireModule.default || spireModule;
        window.wasmModule = typeof rawModule === 'function'
          ? await rawModule({ locateFile: p => p.endsWith('.wasm') ? `${publicUrl}/${p}` : p })
          : rawModule;
        setWasmModule(window.wasmModule);
      } catch (error) {
        console.error('Failed to load spire.xls.js WASM module:', error);
      }
    })();
  }, []);

  // Function to merge Excel workbooks into one
  const MergeExcelWorkbooks = async () => {
    const wasmModule = window.wasmModule.spirexls;

    if (wasmModule) {
      // Load font into Virtual File System (VFS)
      await window.spire.FetchFileToVFS('Arial.ttf', '/Library/Fonts/', `${process.env.PUBLIC_URL}/static/font/`);


      // Load the Excel files into the virtual file system (VFS)
      const files = [
        "File1.xlsx",
        "File2.xlsx",
        "File3.xlsx",
      ];
      for (const file of files) {
        await window.spire.FetchFileToVFS(file, '', `${process.env.PUBLIC_URL}/static/data/`);
      }

      // Create a new workbook
      let newbook = new wasmModule.Workbook();
      newbook.Version = wasmModule.ExcelVersion.Version2013;

      // Clear the default worksheets
      newbook.Worksheets.Clear();

      // Create a temp workbook
      let tempbook = new wasmModule.Workbook();

      for (const file of files) {

        // Load the current file
        tempbook.LoadFromFile(file.split("/").pop());

        for (let i = 0; i < tempbook.Worksheets.Count; i++) {
          let sheet = tempbook.Worksheets.get(i);

          // Copy every sheet in the current file to the new workbook
          wasmModule.XlsWorksheetsCollection.Convert(
            newbook.Worksheets
          ).AddCopy({
            sheet: sheet,
            flags: wasmModule.WorksheetCopyType.CopyAll,
          });
        }
      }

      let outputFileName = "MergeExcelWorkbooks.xlsx";
      // Save the resulting file
      newbook.SaveToFile({ fileName: outputFileName, version: wasmModule.ExcelVersion.Version2013 });

      // Read the saved file and convert to Blob object
      const modifiedFileArray = window.dotnetRuntime.Module.FS.readFile(outputFileName);
      const modifiedFile = new Blob([modifiedFileArray], { type: 'application/vnd.openxmlformats-officedocument.spreadsheetml.sheet' });

      // Create a URL for the Blob and initiate download
      const url = URL.createObjectURL(modifiedFile);
      const a = document.createElement('a');
      a.href = url;
      a.download = outputFileName;
      document.body.appendChild(a);
      a.click();
      document.body.removeChild(a);
      URL.revokeObjectURL(url);

      // Clean up resources used by the workbook
      newbook.Dispose();
    }
  };

  return (
    <div style={{ textAlign: 'center', height: '300px' }}>
      <h1>Merge Multiple Excel Workbooks into One Using JavaScript in React</h1>
      <button onClick={MergeExcelWorkbooks} disabled={!wasmModule}>
        Merge
      </button>
    </div>
  );
}

export default App;
Run the code to launch the React app at localhost:3000. Once it's running, click on the "Merge" button to merge multiple Excel workbooks into one:
The screenshot below showcases the input workbooks and the output workbook:
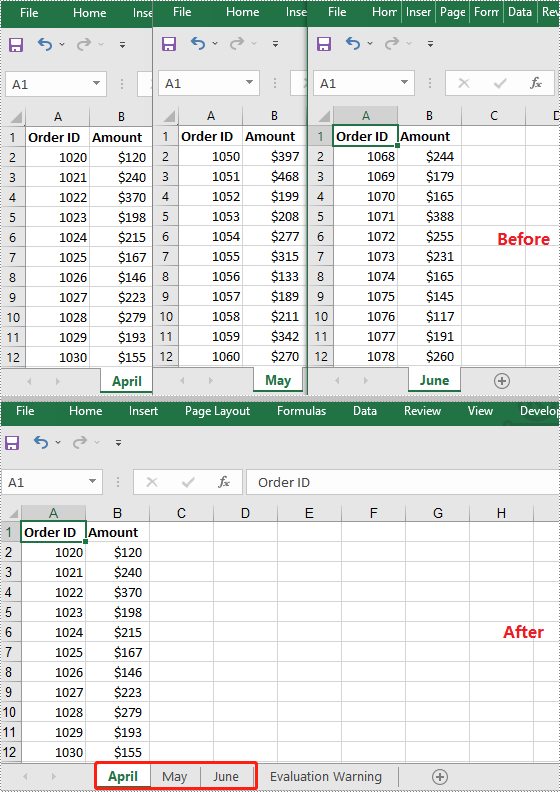
Merge Multiple Excel Worksheets into One
Consolidating multiple worksheets into a single sheet enhances clarity and provides a comprehensive overview of related information.
Using Spire.XLS for JavaScript, developers can merge multiple worksheets by copying the used data ranges in these worksheets into a single worksheet using the CellRange.Copy() method. The key steps are as follows.
- Initialize a Workbook object and load an Excel workbook using Workbook.LoadFromFile() method.
- Get the two worksheets to be merged using Workbook.Worksheets.get() method.
- Get the used data range of the second worksheet using Worksheet.AllocatedRange property.
- Specify the destination range in the first worksheet using Worksheet.Range.get() method.
- Copy the used data range from the second worksheet to the specified destination range in the first worksheet using CellRange.Copy() method.
- Remove the second worksheet from the workbook.
- Save the resulting workbook using Workbook.SaveToFile() method.
- JavaScript
import React, { useState, useEffect } from 'react';
function App() {
  const [wasmModule, setWasmModule] = useState(null);
  // Load Spire.XLS
  useEffect(() => {
    (async () => {
      try {
        const publicUrl = process.env.PUBLIC_URL || '';
        const spireModule = await import(/* webpackIgnore: true */ `${publicUrl}/spire.xls.js`);
        const rawModule = spireModule.default || spireModule;
        window.wasmModule = typeof rawModule === 'function'
          ? await rawModule({ locateFile: p => p.endsWith('.wasm') ? `${publicUrl}/${p}` : p })
          : rawModule;
        setWasmModule(window.wasmModule);
      } catch (error) {
        console.error('Failed to load spire.xls.js WASM module:', error);
      }
    })();
  }, []);

  // Function to merge worksheets in an Excel workbook into one
  const MergeWorksheets = async () => {
    const wasmModule = window.wasmModule.spirexls;

    if (wasmModule) {
      // Load font into Virtual File System (VFS)
      await window.spire.FetchFileToVFS('Arial.ttf', '/Library/Fonts/', `${process.env.PUBLIC_URL}/static/font/`);


      // Load the Excel files into the virtual file system (VFS)
      let inputFileName = 'sample.xlsx';
      await window.spire.FetchFileToVFS(inputFileName, '', `${process.env.PUBLIC_URL}/static/data/`);


      // Create a new workbook
      let workbook = new wasmModule.Workbook();

      // Load the Excel file from the virtual file system
      workbook.LoadFromFile(inputFileName);

      // Get the first worksheet
      let sheet1 = workbook.Worksheets.get(0);
      // Get the second worksheet
      let sheet2 = workbook.Worksheets.get(1);

      // Get the used range in the second worksheet
      let fromRange = sheet2.AllocatedRange;
      // Specify the destination range in the first worksheet
      let toRange = sheet1.Range.get({ row: sheet1.LastRow + 1, column: 1 });

      // Copy the used range from the second worksheet to the destination range in the first worksheet
      fromRange.Copy({ destRange: toRange });

      // Remove the second worksheet
      sheet2.Remove();

      // Define the output file name
      const outputFileName = "MergeWorksheets.xlsx";

      // Save the workbook to the specified path
      workbook.SaveToFile({ fileName: outputFileName, version: wasmModule.ExcelVersion.Version2010 });

      // Read the saved file and convert to Blob object
      const modifiedFileArray = window.dotnetRuntime.Module.FS.readFile(outputFileName);
      const modifiedFile = new Blob([modifiedFileArray], { type: 'application/vnd.openxmlformats-officedocument.spreadsheetml.sheet' });

      // Create a URL for the Blob and initiate download
      const url = URL.createObjectURL(modifiedFile);
      const a = document.createElement('a');
      a.href = url;
      a.download = outputFileName;
      document.body.appendChild(a);
      a.click();
      document.body.removeChild(a);
      URL.revokeObjectURL(url);

      // Clean up resources used by the workbook
      workbook.Dispose();
    }
  };

  return (
    <div style={{ textAlign: 'center', height: '300px' }}>
      <h1>Merge Multiple Excel Worksheets into One Using JavaScript in React</h1>
      <button onClick={MergeWorksheets} disabled={!wasmModule}>
        Merge
      </button>
    </div>
  );
}

export default App;
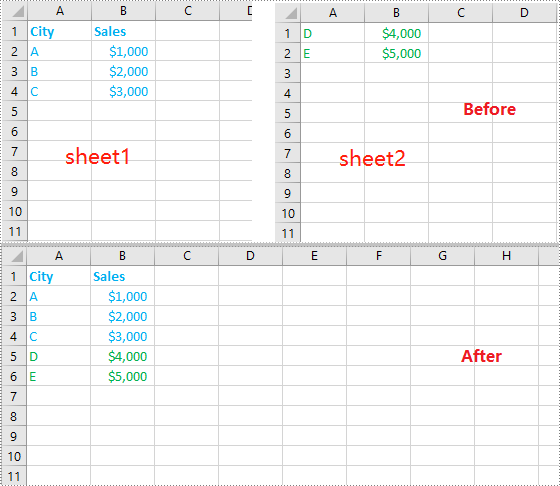
Get a Free License
To fully experience the capabilities of Spire.XLS for JavaScript without any evaluation limitations, you can request a free 30-day trial license.
Insert or Delete Images in Excel with JavaScript in React
2025-03-03 01:05:21 Written by AdministratorImages in Excel can add a visual element to your data, making it more engaging and easier to understand. From adding company logos to embedding charts or diagrams, images can convey complex information more effectively than text alone. There are also times that you need to remove the images that are no longer relevant or cluttering your worksheet. This article will demonstrate how to insert or delete images in an Excel worksheet in React using Spire.XLS for JavaScript.
Install Spire.XLS for JavaScript
To get started with inserting or deleting picture in Excel in a React application, you can either download Spire.XLS for JavaScript from our website or install it via npm with the following command:
npm i spire.office
The downloaded product package has been integrated Spire.Doc for JavaScript,Spire.XLS for JavaScript,Spire.PDF for JavaScript,Spire.Presentation for JavaScript. To use the functionality of Spire.XLS for JavaScript, you need to copy the corresponding files (spire.xls.js, Spire.Xls.Wasm.zip, spire.common.js, Spire.Common.Wasm.zip, and _framework) to the project's "public" folder. At the same time, in order to ensure text rendering, the related font files can be added with custom paths. In the following example, the font addition path is: public\static\font.
For more details, refer to the documentation: How to Integrate Spire.XLS for JavaScript in a React Project
Insert Images in Excel in JavaScript
Spire.XLS for JavaScript provides the Worksheet.Pictures.Add() method to add a picture to a specified cell in an Excel worksheet. The following are the main steps.
- Create a Workbook object using the new wasmModule.Workbook() method.
- Get a specific worksheet using the Workbook.Worksheets.get() method.
- Insert a picture into a specific cell using the Worksheet.Pictures.Add() method and return an object of ExcelPicture.
- Set the width and height of the picture, as well as the distance between the picture and the cell border through the properties under the ExcelPicture object.
- Save the result file using the Workbook.SaveToFile() method.
- JavaScript
import React, { useState, useEffect } from 'react';
function App() {
  const [wasmModule, setWasmModule] = useState(null);
  // Load Spire.XLS
  useEffect(() => {
    (async () => {
      try {
        const publicUrl = process.env.PUBLIC_URL || '';
        const spireModule = await import(/* webpackIgnore: true */ `${publicUrl}/spire.xls.js`);
        const rawModule = spireModule.default || spireModule;
        window.wasmModule = typeof rawModule === 'function'
          ? await rawModule({ locateFile: p => p.endsWith('.wasm') ? `${publicUrl}/${p}` : p })
          : rawModule;
        setWasmModule(window.wasmModule);
      } catch (error) {
        console.error('Failed to load spire.xls.js WASM module:', error);
      }
    })();
  }, []);

  // Function to insert an image in Excel
  const InsertExcelImage = async () => {
    const wasmModule = window.wasmModule.spirexls;

    if (wasmModule) {
      // Load font into Virtual File System (VFS)
      await window.spire.FetchFileToVFS('Arial.ttf', '/Library/Fonts/', `${process.env.PUBLIC_URL}/static/font/`);


      // Load the image files into the virtual file system (VFS)
      let inputFileName = 'logo.png';
      await window.spire.FetchFileToVFS(inputFileName, '', `${process.env.PUBLIC_URL}/static/data/`);


      // Create a new workbook
      let workbook = new wasmModule.Workbook();

      // Get the first worksheet.
      let sheet = workbook.Worksheets.get(0);

      // Add a picture to the specific cell
      let picture = sheet.Pictures.Add({ topRow: 2, leftColumn: 3, fileName: inputFileName });

      // Set the picture width and height
      picture.Width = 150
      picture.Height = 150

      // Adjust the column width and row height to accommodate the picture
      sheet.SetRowHeight(2, 135);
      sheet.SetColumnWidth(3, 25);

      // Set the distance between cell border and picture
      picture.LeftColumnOffset = 90
      picture.TopRowOffset = 20

      // Save the modified workbook to the specified file
      const outputFileName = 'InsertExcelImage.xlsx';
      workbook.SaveToFile({ fileName: outputFileName, version: wasmModule.ExcelVersion.Version2016 });

      // Read the saved file and convert to Blob object
      const modifiedFileArray = window.dotnetRuntime.Module.FS.readFile(outputFileName);
      const modifiedFile = new Blob([modifiedFileArray], { type: 'application/vnd.openxmlformats-officedocument.spreadsheetml.sheet' });

      // Create a URL for the Blob and initiate download
      const url = URL.createObjectURL(modifiedFile);
      const a = document.createElement('a');
      a.href = url;
      a.download = outputFileName;
      document.body.appendChild(a);
      a.click();
      document.body.removeChild(a);
      URL.revokeObjectURL(url);

      // Clean up resources used by the workbook
      workbook.Dispose();
    }
  };

  return (
    <div style={{ textAlign: 'center', height: '300px' }}>
      <h1>Insert an Image to a Specified Cell in Excel Using JavaScript in React</h1>
      <button onClick={InsertExcelImage} disabled={!wasmModule}>
        Process
      </button>
    </div>
  );
}

export default App;
Run the code to launch the React app at localhost:3000. Once it's running, click the "Process" button to insert image in Excel:
Below is the result file:

Delete Images in Excel in JavaScript
To delete all pictures in an Excel worksheet, you need to iterate through each picture and then remove them through the Worksheet.Pictures.get().Remove() method. The following are the main steps.
- Create a Workbook object using the new wasmModule.Workbook() method.
- Load an Excel file using the Workbook.LoadFromFile() method.
- Get a specific worksheet using the Workbook.Worksheets.get() method.
- Iterate through all pictures in the worksheet and then remove them using the Worksheet.Pictures.get().Remove() method.
- Save the result file using the Workbook.SaveToFile() method.
- JavaScript
import React, { useState, useEffect } from 'react';
function App() {
  const [wasmModule, setWasmModule] = useState(null);
  // Load Spire.XLS
  useEffect(() => {
    (async () => {
      try {
        const publicUrl = process.env.PUBLIC_URL || '';
        const spireModule = await import(/* webpackIgnore: true */ `${publicUrl}/spire.xls.js`);
        const rawModule = spireModule.default || spireModule;
        window.wasmModule = typeof rawModule === 'function'
          ? await rawModule({ locateFile: p => p.endsWith('.wasm') ? `${publicUrl}/${p}` : p })
          : rawModule;
        setWasmModule(window.wasmModule);
      } catch (error) {
        console.error('Failed to load spire.xls.js WASM module:', error);
      }
    })();
  }, []);

  // Function to delete images from Excel
  const DeleteExcelImage = async () => {
    const wasmModule = window.wasmModule.spirexls;

    if (wasmModule) {
      // Load font into Virtual File System (VFS)
      await window.spire.FetchFileToVFS('Arial.ttf', '/Library/Fonts/', `${process.env.PUBLIC_URL}/static/font/`);


      // Load the excel files into the virtual file system (VFS)
      let inputFileName = 'InsertExcelImage.xlsx';
      await window.spire.FetchFileToVFS(inputFileName, '', `${process.env.PUBLIC_URL}/static/data/`);


      // Create a new workbook
      let workbook = new wasmModule.Workbook();

      // Load the Excel document
      workbook.LoadFromFile({ fileName: inputFileName });

      // Get the first worksheet
      let sheet = workbook.Worksheets.get(0);

      // Delete all images from the worksheet
      for (let i = sheet.Pictures.Count - 1; i >= 0; i--) {
        sheet.Pictures.get(i).Remove();
      }

      // Save the result file
      const outputFileName = 'DeleteImages.xlsx';
      workbook.SaveToFile({ fileName: outputFileName, version: wasmModule.ExcelVersion.Version2016 });

      // Read the saved file and convert to Blob object
      const modifiedFileArray = window.dotnetRuntime.Module.FS.readFile(outputFileName);
      const modifiedFile = new Blob([modifiedFileArray], { type: 'application/vnd.openxmlformats-officedocument.spreadsheetml.sheet' });

      // Create a URL for the Blob and initiate download
      const url = URL.createObjectURL(modifiedFile);
      const a = document.createElement('a');
      a.href = url;
      a.download = outputFileName;
      document.body.appendChild(a);
      a.click();
      document.body.removeChild(a);
      URL.revokeObjectURL(url);

      // Clean up resources used by the workbook
      workbook.Dispose();
    }
  };

  return (
    <div style={{ textAlign: 'center', height: '300px' }}>
      <h1>Delete Images from Excel Using JavaScript in React</h1>
      <button onClick={DeleteExcelImage} disabled={!wasmModule}>
        Process
      </button>
    </div>
  );
}

export default App;
Get a Free License
To fully experience the capabilities of Spire.XLS for JavaScript without any evaluation limitations, you can request a free 30-day trial license.
Save Excel Charts and Shapes as Images with JavaScript in React
2025-02-28 00:57:01 Written by AdministratorExport Excel charts and shapes as standalone images is a critical feature for enhancing data visualization workflows. Converting charts and shapes into image formats enables seamless integration of dynamic data into reports, dashboards, or presentations, ensuring compatibility across platforms where Excel files might not be natively supported. By programmatically generating images from Excel charts and shapes within web applications using Spire.XLS for JavaScript API, developers can automate export workflows, ensure consistent visualization, and deliver dynamically updated visuals to end-users without extra manual processing steps.
In this article, we will explore how to use Spire.XLS for Java Script to save charts and shapes in Excel workbooks as images using JavaScript in React applications.
Install Spire.XLS for JavaScript
To get started with saving Excel charts and shapes as images in a React application, you can either download Spire.XLS for JavaScript from our website or install it via npm with the following command:
npm i spire.office
The downloaded product package has been integrated Spire.Doc for JavaScript,Spire.XLS for JavaScript,Spire.PDF for JavaScript,Spire.Presentation for JavaScript. To use the functionality of Spire.XLS for JavaScript, you need to copy the corresponding files (spire.xls.js, Spire.Xls.Wasm.zip, spire.common.js, Spire.Common.Wasm.zip, and _framework) to the project's "public" folder. At the same time, in order to ensure text rendering, the related font files can be added with custom paths. In the following example, the font addition path is: public\static\font.
For more details, refer to the documentation: How to Integrate Spire.XLS for JavaScript in a React Project
Save Excel Charts to Images with JavaScript
By processing Excel files using the Spire.XLS WebAssembly module, we can utilize the Workbook.SaveChartAsImage() method to save a specific chart from an Excel worksheet as an image and store it in the virtual file system (VFS). The saved image can then be downloaded or used for further processing.
The detailed steps are as follows:
- Load the Spire.Xls.js file to initialize the WebAssembly module.
- Fetch the Excel file and font files into the VFS using the window.spire.FetchFileToVFS() method.
- Create a Workbook instance using the new wasmModule.Workbook() method.
- Load the Excel file into the Workbook instance using the Workbook.LoadFromFile() method.
- Retrieve a specific worksheet or iterate through all worksheets using the Workbook.Worksheets.get() method.
- Iterate though the charts and save them as images using the Workbook.SaveChartAsImage() method, specifying the worksheet and chart index as parameters.
- Save the images to the VFS using the image.Save() method.
- Download the images or use them as needed.
- JavaScript
import React, { useState, useEffect } from 'react';
import JSZip from 'jszip';

function App() {
  const [wasmModule, setWasmModule] = useState(null);
  // Load Spire.XLS
  useEffect(() => {
    (async () => {
      try {
        const publicUrl = process.env.PUBLIC_URL || '';
        const spireModule = await import(/* webpackIgnore: true */ `${publicUrl}/spire.xls.js`);
        const rawModule = spireModule.default || spireModule;
        window.wasmModule = typeof rawModule === 'function'
          ? await rawModule({ locateFile: p => p.endsWith('.wasm') ? `${publicUrl}/${p}` : p })
          : rawModule;
        setWasmModule(window.wasmModule);
      } catch (error) {
        console.error('Failed to load spire.xls.js WASM module:', error);
      }
    })();
  }, []);

  // Function to convert charts to images
  const SaveExcelChartAsImage = async () => {
    const wasmModule = window.wasmModule.spirexls;

    if (wasmModule) {
      // Load font into virtual file system (VFS)
      await window.spire.FetchFileToVFS('Arial.ttf', '/Library/Fonts/', `${process.env.PUBLIC_URL}/static/font/`);

      // Load Excel file into virtual file system (VFS)
      const inputFileName = 'in.xlsx';
      await window.spire.FetchFileToVFS(inputFileName, '', `${process.env.PUBLIC_URL}/static/data/`);

      // Create an images folder in the VFS
      const imageFolderName = `Images`;
      window.dotnetRuntime.Module.FS.mkdirTree(imageFolderName);

      // Create a new workbook
      const workbook = new wasmModule.Workbook();

      // Load the Excel file from VFS
      workbook.LoadFromFile(inputFileName);

      // Iterate through each worksheet in the workbook
      for (let i = 0; i < workbook.Worksheets.Count; i++) {
        // Get the current worksheet
        const sheet = workbook.Worksheets.get(i);
        // Iterate through each chart in the worksheet
        for (let j = 0; j < sheet.Charts.Count; j++) {
          // Save the current chart to an image
          let image = workbook.SaveChartAsImage({ worksheet: sheet, chartIndex: j })
          // Save the image to the VFS
          let filePath = `${imageFolderName}/${sheet.Name}_chart-${j}.png`;
          image.Save(filePath);
        }
      }

      // Recursive function to add a directory and its contents to a ZIP
      const addFilesToZip = (folderPath, zipFolder) => {
        const items = window.dotnetRuntime.Module.FS.readdir(folderPath);
        items.filter(item => item !== "." && item !== "..").forEach((item) => {
          const itemPath = `${folderPath}/${item}`;

          try {
            // Try to read file data
            const fileData = window.dotnetRuntime.Module.FS.readFile(itemPath);
            zipFolder.file(item, fileData);
          } catch (error) {
            if (error.code === 'EISDIR') {
              // If it is a directory, create a new folder in the ZIP and recurse into it
              const zipSubFolder = zipFolder.folder(item);
              addFilesToZip(itemPath, zipSubFolder);
            } else {
              // Handle other errors
              console.error(`Error processing ${itemPath}:`, error);
            }
          }
        });
      };

      // Package the image folder into a ZIP file
      const zip = new JSZip();
      addFilesToZip(imageFolderName, zip);

      // Generate a Blob from the resulting ZIP file and trigger download
      zip.generateAsync({ type: "blob" })
        .then(function (content) {
          const link = document.createElement('a');
          link.href = URL.createObjectURL(content);
          link.download = 'chartToimg.zip';
          document.body.appendChild(link);
          link.click();
          document.body.removeChild(link);
          URL.revokeObjectURL(link.href);
        }).catch(function (err) {
          console.error("Error generating ZIP file:", err);
        });
    }
  };

  return (
    <div style={{ textAlign: 'center', height: '300px' }}>
      <h1>Save Excel Charts as Images Using JavaScript in React</h1>
      <button onClick={SaveExcelChartAsImage} disabled={!wasmModule}>
        Export Charts
      </button>
    </div>
  );
}

export default App;

Save Excel Shapes to Images with JavaScript
We can retrieve shapes from an Excel worksheet using the Worksheet.PrstGeomShapes.get() method and save them as images using the shape.SaveToImage() method. The images can then be stored in the virtual file system (VFS) and downloaded or used for further processing.
Below are the detailed steps:
- Load the Spire.Xls.js file to initialize the WebAssembly module.
- Fetch the Excel file and font files into the VFS using the window.spire.FetchFileToVFS() method.
- Create a Workbook instance using the new wasmModule.Workbook() method.
- Load the Excel file into the Workbook instance using the Workbook.LoadFromFile() method.
- Retrieve a specific worksheet or iterate through all worksheets using the Workbook.Worksheets.get() method.
- Get a shape from the worksheet or iterate through all shapes using the Worksheet.PrstGeomShapes.get() method.
- Save the shapes as images using the shape.SaveToImage() method.
- Save the images to the VFS using the image.Save() method.
- Download the images or use them as needed.
- JavaScript
import React, { useState, useEffect } from 'react';
import JSZip from 'jszip';

function App() {
  const [wasmModule, setWasmModule] = useState(null);
  // Load Spire.XLS
  useEffect(() => {
    (async () => {
      try {
        const publicUrl = process.env.PUBLIC_URL || '';
        const spireModule = await import(/* webpackIgnore: true */ `${publicUrl}/spire.xls.js`);
        const rawModule = spireModule.default || spireModule;
        window.wasmModule = typeof rawModule === 'function'
          ? await rawModule({ locateFile: p => p.endsWith('.wasm') ? `${publicUrl}/${p}` : p })
          : rawModule;
        setWasmModule(window.wasmModule);
      } catch (error) {
        console.error('Failed to load spire.xls.js WASM module:', error);
      }
    })();
  }, []);

  // Function to convert shapes to images
  const SaveExcelShapeAsImage = async () => {
    const wasmModule = window.wasmModule.spirexls;

    if (wasmModule) {
      // Load font into virtual file system (VFS)
      await window.spire.FetchFileToVFS('Arial.ttf', '/Library/Fonts/', `${process.env.PUBLIC_URL}/static/font/`);

      // Load Excel file into virtual file system (VFS)
      const inputFileName = 'Shape.xlsx';
      await window.spire.FetchFileToVFS(inputFileName, '', `${process.env.PUBLIC_URL}/static/data/`);

      // Create an images folder in the VFS
      const imageFolderName = `Images`;
      window.dotnetRuntime.Module.FS.mkdirTree(imageFolderName);

      // Create a new workbook
      const workbook = new wasmModule.Workbook();

      // Load the Excel file from VFS
      workbook.LoadFromFile(inputFileName);

      // Iterate through each worksheet in the workbook
      for (let i = 0; i < workbook.Worksheets.Count; i++) {
        // Get the current worksheet
        const sheet = workbook.Worksheets.get(i);
        // Iterate through each shape in the worksheet
        for (let j = 0; j < sheet.PrstGeomShapes.Count; j++) {
          // Get the current shape
          const shape = sheet.PrstGeomShapes.get(j);
          // Save the shape to an image
          const image = shape.SaveToImage();
          // Save the image to the VFS
          let filePath = `${imageFolderName}/${sheet.Name}_shape-${j}.png`;
          image.Save(filePath);
        }
      }

      // Recursive function to add a directory and its contents to a ZIP
      const addFilesToZip = (folderPath, zipFolder) => {
        const items = window.dotnetRuntime.Module.FS.readdir(folderPath);
        items.filter(item => item !== "." && item !== "..").forEach((item) => {
          const itemPath = `${folderPath}/${item}`;

          try {
            // Try to read file data
            const fileData = window.dotnetRuntime.Module.FS.readFile(itemPath);
            zipFolder.file(item, fileData);
          } catch (error) {
            if (error.code === 'EISDIR') {
              // If it is a directory, create a new folder in the ZIP and recurse into it
              const zipSubFolder = zipFolder.folder(item);
              addFilesToZip(itemPath, zipSubFolder);
            } else {
              // Handle other errors
              console.error(`Error processing ${itemPath}:`, error);
            }
          }
        });
      };

      // Package the image folder into a ZIP file
      const zip = new JSZip();
      addFilesToZip(imageFolderName, zip);

      // Generate a Blob from the resulting ZIP file and trigger download
      zip.generateAsync({ type: "blob" })
        .then(function (content) {
          const link = document.createElement('a');
          link.href = URL.createObjectURL(content);
          link.download = 'shapeToimg.zip';
          document.body.appendChild(link);
          link.click();
          document.body.removeChild(link);
          URL.revokeObjectURL(link.href);
        }).catch(function (err) {
          console.error("Error generating ZIP file:", err);
        });
    }
  };

  return (
    <div style={{ textAlign: 'center', height: '300px' }}>
      <h1>Save Excel Shapes as Images Using JavaScript in React</h1>
      <button onClick={SaveExcelShapeAsImage} disabled={!wasmModule}>
        Export Shapes
      </button>
    </div>
  );
}

export default App;
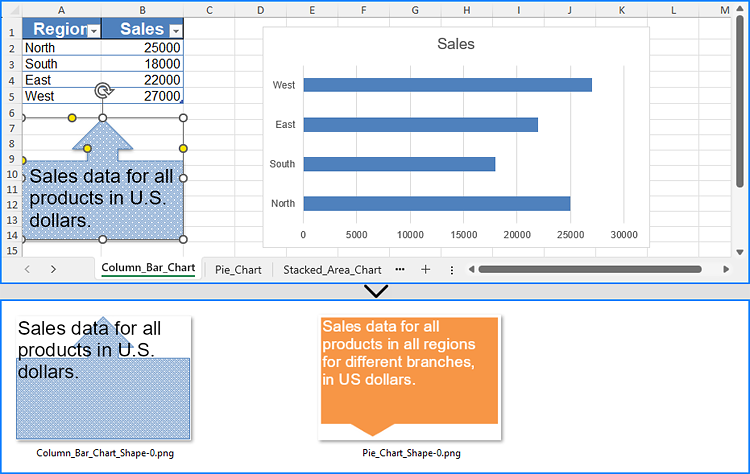
Get a Free License
To fully experience the capabilities of Spire.XLS for JavaScript without any evaluation limitations, you can request a free 30-day trial license.
