
React (107)
Children categories
A table has only a few seconds to be understood, and the work is done not only by the numbers but by the fonts: a title big enough to stand out, a figure that matters found at a glance, a cancelled line spotted immediately. In Excel every one of those differences is carried by a font object belonging to a single cell -- font name, size, colour, bold, italic, underline, strikethrough; changing a cell touches only that cell. One cell can also hold several fonts at once, and switching a single word to another colour or size lifts it out of the sentence around it. Spire.XLS for JavaScript performs these operations in the browser through WebAssembly; the output file is managed by a virtual file system (VFS), with no backend service required.
This article covers two feature points:
For installation and project setup, see Integrating Spire.XLS for JavaScript in a React Project. The examples below assume Spire.XLS is installed and the WebAssembly module has been initialized.
Set the font formatting of a cell
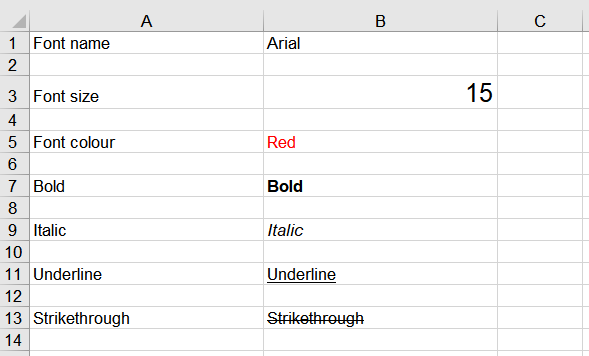
Every cell carries a font object of its own, and all seven properties -- font name, size, colour, bold, italic, underline and strikethrough -- hang off that object. To see what each one does, start a worksheet of its own, write the property's name and a sample of text row by row, and set the matching property on the cell that holds the sample: a change lands on that cell alone, and the description in column A keeps its own look. The steps are:
- Load the font file into the VFS with
window.spire.FetchFileToVFS. - Create a workbook with
new Workbook()and take the first worksheet withworkbook.Worksheets.get(0). - Write the properties out one per row with
sheet.Range.get: the name into column A and the sample text into column B, rows starting at 1 and going up by 2. - Set the matching format on each row's sample through
FontName,Size,Color,IsBold,IsItalic,UnderlineandIsStrikethroughonRange.Style.Font, taking the font colour fromxlsModule.Color.get_Red()and the underline fromxlsModule.FontUnderlineType.Single. - Set both columns to a width of 25 with
sheet.Columns.get(0).ColumnWidthandsheet.Columns.get(1).ColumnWidth. - Save the workbook with
workbook.SaveToFileand dispose of it withworkbook.Disposeto free resources.
The full code example below shows how to set font formatting for cells in React:
function App() {
  const setCellFont = async () => {
    // get the Spire.XLS WASM module
    const xlsModule = window.wasmModule?.spirexls;

    // check that the module is ready
    if (!xlsModule) {
      alert('Spire.Xls is not ready yet');
      return;
    }

    // load the font file into the VFS
    await window.spire.FetchFileToVFS('ARIAL.TTF', '/Library/Fonts/', `${process.env.PUBLIC_URL}/font/`);

    // create a new workbook and take the first worksheet
    const workbook = new xlsModule.Workbook();
    const sheet = workbook.Worksheets.get(0);

    // set the font name
    let row = 1;
    sheet.Range.get(`A${row}`).Value = 'Font name';
    sheet.Range.get(`B${row}`).Value = 'Arial';
    sheet.Range.get(`B${row}`).Style.Font.FontName = 'Arial';

    // set the font size
    row += 2;
    sheet.Range.get(`A${row}`).Value = 'Font size';
    sheet.Range.get(`B${row}`).Value = '15';
    sheet.Range.get(`B${row}`).Style.Font.Size = 15;

    // set the font colour
    row += 2;
    sheet.Range.get(`A${row}`).Value = 'Font colour';
    sheet.Range.get(`B${row}`).Value = 'Red';
    sheet.Range.get(`B${row}`).Style.Font.Color = xlsModule.Color.get_Red();

    // bold the text
    row += 2;
    sheet.Range.get(`A${row}`).Value = 'Bold';
    sheet.Range.get(`B${row}`).Value = 'Bold';
    sheet.Range.get(`B${row}`).Style.Font.IsBold = true;

    // italicise the text
    row += 2;
    sheet.Range.get(`A${row}`).Value = 'Italic';
    sheet.Range.get(`B${row}`).Value = 'Italic';
    sheet.Range.get(`B${row}`).Style.Font.IsItalic = true;

    // underline the text
    row += 2;
    sheet.Range.get(`A${row}`).Value = 'Underline';
    sheet.Range.get(`B${row}`).Value = 'Underline';
    sheet.Range.get(`B${row}`).Style.Font.Underline = xlsModule.FontUnderlineType.Single;

    // strike through the text
    row += 2;
    sheet.Range.get(`A${row}`).Value = 'Strikethrough';
    sheet.Range.get(`B${row}`).Value = 'Strikethrough';
    sheet.Range.get(`B${row}`).Style.Font.IsStrikethrough = true;

    // set the column widths
    sheet.Columns.get(0).ColumnWidth = 25;
    sheet.Columns.get(1).ColumnWidth = 25;

    // save the workbook as an Excel file
    const outputFileName = 'CellFont.xlsx';
    workbook.SaveToFile({ fileName: outputFileName, version: xlsModule.ExcelVersion.Version2016 });

    // dispose of the workbook to free resources
    workbook.Dispose();

    // read the result file from the VFS and start the download
    const fileArray = window.dotnetRuntime.Module.FS.readFile(outputFileName);
    const blob = new Blob([fileArray], { type: 'application/vnd.openxmlformats-officedocument.spreadsheetml.sheet' });
    const url = URL.createObjectURL(blob);
    const a = document.createElement('a');
    a.href = url;
    a.download = outputFileName;
    a.click();
    URL.revokeObjectURL(url);
  };

  return (
    <div style={{ textAlign: 'center', height: '300px' }}>
      <h1>Set Cell Font Formatting</h1>
      <button id="cell-font" onClick={setCellFont}>Set the font formatting of a cell</button>
    </div>
  );
}

export default App;
After running, the effect of setting font formatting for individual cells:
Mix several fonts inside one cell
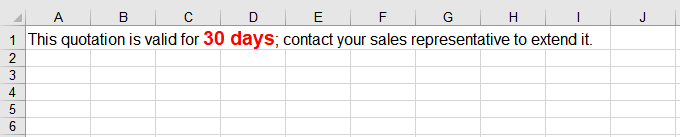
A cell's rich text object lets one run of text be cut at character positions and each piece given a different font, while the sentence still reads as a whole. The way to do it is to create the font objects first and then assign them range by range with SetFont -- each call overwrites one range, so every part of the sentence has to be covered. Ranges count from 0 and include both ends. The steps are:
- Load the font file into the VFS with
window.spire.FetchFileToVFS. - Create a workbook with
new Workbook()and take the first worksheet withworkbook.Worksheets.get(0). - Create two fonts with
workbook.CreateFont(): one for the whole sentence, and one that emphasises the key phrase throughIsBoldandKnownColor. - Take the cell that holds the sentence with
sheet.Range.get('A1'), and write the whole sentence into its rich text object throughRichText.Text. - Work out the start and end of the text that needs the new font within the sentence with
note.indexOf(key)andkey.length, then assign the fonts to the three parts -- before the key phrase, the key phrase itself and after it -- withRichText.SetFont. - Save the workbook with
workbook.SaveToFileand dispose of it withworkbook.Disposeto free resources.
The full code example below shows how to give part of the text in one cell a different font in React:
function App() {
  const setRichTextFonts = async () => {
    // get the Spire.XLS WASM module
    const xlsModule = window.wasmModule?.spirexls;

    // check that the module is ready
    if (!xlsModule) {
      alert('Spire.Xls is not ready yet');
      return;
    }

    // load the font file into the VFS
    await window.spire.FetchFileToVFS('ARIAL.TTF', '/Library/Fonts/', `${process.env.PUBLIC_URL}/font/`);

    // create a new workbook and take the first worksheet
    const workbook = new xlsModule.Workbook();
    const sheet = workbook.Worksheets.get(0);

    // create the first font, for the whole sentence
    const font1 = workbook.CreateFont();
    font1.FontName = 'Arial';
    font1.Size = 12;

    // create the second font, for the key phrase
    const font2 = workbook.CreateFont();
    font2.FontName = 'Arial';
    font2.Size = 14;
    font2.IsBold = true;
    font2.KnownColor = xlsModule.ExcelColors.Red;

    // take the cell's rich text object and write the whole sentence
    const note = 'This quotation is valid for 30 days; contact your sales representative to extend it.';
    const key = '30 days';
    const richText = sheet.Range.get('A1').RichText;
    richText.Text = note;

    // locate the character range the key phrase occupies
    const start = note.indexOf(key);
    const end = start + key.length - 1;

    // set the part before the key phrase to the first font
    richText.SetFont(0, start - 1, font1);

    // set the key phrase itself to the second font
    richText.SetFont(start, end, font2);

    // keep the part after the key phrase in the first font
    richText.SetFont(end + 1, note.length - 1, font1);

    // save the workbook as an Excel file
    const outputFileName = 'RichTextFont.xlsx';
    workbook.SaveToFile({ fileName: outputFileName, version: xlsModule.ExcelVersion.Version2016 });

    // dispose of the workbook to free resources
    workbook.Dispose();

    // read the result file from the VFS and start the download
    const fileArray = window.dotnetRuntime.Module.FS.readFile(outputFileName);
    const blob = new Blob([fileArray], { type: 'application/vnd.openxmlformats-officedocument.spreadsheetml.sheet' });
    const url = URL.createObjectURL(blob);
    const a = document.createElement('a');
    a.href = url;
    a.download = outputFileName;
    a.click();
    URL.revokeObjectURL(url);
  };

  return (
    <div style={{ textAlign: 'center', height: '300px' }}>
      <h1>Mix Several Fonts Inside One Cell</h1>
      <button id="rich-text-fonts" onClick={setRichTextFonts}>Give part of the text a different font</button>
    </div>
  );
}

export default App;
After running, the effect of mixing several fonts inside one cell:
FAQ
What value should SetFont's end position take
Reason: Both position arguments of SetFont count from 0 and include the end position itself, so passing a string's length directly lands one character past the end.
Solution: Pass "length minus one" as the end position. To cover a whole run of text, use the sentence's length minus one:
richText.SetFont(0, note.length - 1, font1);
Get a Free License
Spire.XLS for JavaScript offers a 30-day full-featured free trial license with no functional limitations. Apply here to evaluate before purchasing.
An Excel comment usually carries a paragraph of text, explaining a number or adding a note. When the thing to be explained is itself a picture -- a supplier mark, a product photo, a sketch of a part -- text alone will not do. Spire.XLS for JavaScript can fill a comment's background with a picture, so the image appears beside the cell without a separate floating picture object being placed on the sheet. A comment's background is controlled by its fill object, and switching to a solid colour likewise changes only that one object. Spire.XLS for JavaScript performs these operations in the browser through WebAssembly; input and output files are managed by a virtual file system (VFS), with no backend service required.
This article covers two feature points:
For installation and project setup, see Integrating Spire.XLS for JavaScript in a React Project. The examples below assume Spire.XLS is installed and the WebAssembly module has been initialized.
Insert a picture comment into a cell
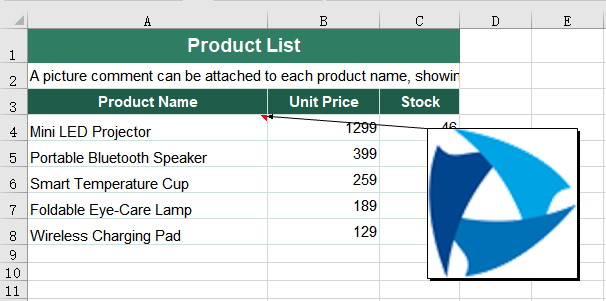
A comment is attached to a cell; giving one a picture means first obtaining the comment object on the target cell and then filling it. The picture becomes the comment box's background, replacing the default pale-yellow shading, and it is this picture that appears when the mouse moves over the cell or the file is opened. The picture is scaled to the size of the comment box, and the default box is a flat rectangle, so a square picture is stretched out of shape; after filling, the width and height must therefore be set so that the box matches the picture's proportions. Where the box sits on the sheet is decided by a separate pair of position properties, so it does not have to follow the cell border. The steps are:
- Load the font, the picture and the test data file into the VFS.
- Load the workbook with
workbook.LoadFromFile. - Take the cell the comment will be attached to with
sheet.Range.get('A4'). - Create a comment object on the cell with
range.AddComment(). - Fill the comment background with the picture using
comment.Fill.CustomPicture, passing the picture as a stream built bynew xlsModule.Stream('logo.png')and'None'for thenameargument. - Set
comment.Widthandcomment.Heightso the comment box is square, matching the square picture, which keeps the picture from being stretched. - Place the comment box relative to the top-left corner of the worksheet with
comment.Topandcomment.Left, so that it covers the content below without obscuring its own row. - Set
comment.Visibleto show the comment as soon as the file is opened. - Save the workbook with
workbook.SaveToFile. - Dispose of the workbook with
workbook.Disposeto free resources.
The complete code example below shows how to insert a picture comment into an Excel cell in React:
function App() {
  const addPictureComment = async () => {
    // get the Spire.XLS WASM module
    const xlsModule = window.wasmModule?.spirexls;

    // check that the module is ready
    if (!xlsModule) {
      alert('Spire.Xls is not ready yet');
      return;
    }

    // load the font, the picture and the test data file into the VFS
    await window.spire.FetchFileToVFS('ARIAL.TTF', '/Library/Fonts/', `${process.env.PUBLIC_URL}/font/`);
    await window.spire.FetchFileToVFS('logo.png', '', `${process.env.PUBLIC_URL}data/`);
    const inputFileName = 'ProductList.xlsx';
    await window.spire.FetchFileToVFS(inputFileName, '', `${process.env.PUBLIC_URL}data/`);

    // load the workbook
    const workbook = new xlsModule.Workbook();
    workbook.LoadFromFile({ fileName: inputFileName });

    // take the first worksheet and add a comment to cell A4, filled with the picture
    const sheet = workbook.Worksheets.get(0);
    const range = sheet.Range.get('A4');
    const comment = range.AddComment();
    comment.Fill.CustomPicture({ im: new xlsModule.Stream('logo.png'), name: 'None' });

    // set the width and height of the comment box
    comment.Width = 150;
    comment.Height = 150;

    // place the comment box relative to the top-left corner of the worksheet
    comment.Top = 100;
    comment.Left = 400;

    // make the comment show as soon as the file is opened
    comment.Visible = true;

    // save the workbook
    const outputFileName = 'PictureComment.xlsx';
    workbook.SaveToFile({ fileName: outputFileName, version: xlsModule.ExcelVersion.Version2010 });

    // dispose of the workbook to free resources
    workbook.Dispose();

    // read the result file from the VFS and start the download
    const fileArray = window.dotnetRuntime.Module.FS.readFile(outputFileName);
    const blob = new Blob([fileArray], { type: 'application/vnd.openxmlformats-officedocument.spreadsheetml.sheet' });
    const url = URL.createObjectURL(blob);
    const a = document.createElement('a');
    a.href = url;
    a.download = outputFileName;
    a.click();
    URL.revokeObjectURL(url);
  };

  return (
    <div style={{ textAlign: 'center', height: '300px' }}>
      <h1>Insert Comments with Pictures</h1>
      <button id="picture-comment" onClick={addPictureComment}>Insert a picture comment into a cell</button>
    </div>
  );
}

export default App;
After running, the effect of inserting a picture comment into a cell:
Fill a comment with a solid colour
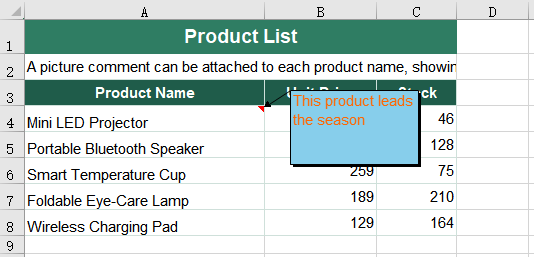
A comment background need not be a picture. When all that is needed is for one comment to stand out from the pale-yellow shading around it, specifying a solid colour is more straightforward than preparing an image. Filling with a picture and filling with a solid colour use the same comment.Fill object; only the fill type changes from picture to solid. The steps are:
- Load the font and the test data file into the VFS.
- Load the workbook with
workbook.LoadFromFile. - Take the cell the comment will be attached to with
sheet.Range.get('A4')and create the comment withrange.AddComment(). - Write the comment text with
comment.Text. - Create a font with
workbook.CreateFont()and set the whole text to it withcomment.RichText.SetFont. - Set
comment.Fill.FillTypeto the solid fill type,xlsModule.ShapeFillType.SolidColor. - Pick the colour with
comment.Fill.ForeColor. - Set
comment.Visibleto show the comment as soon as the file is opened. - Save the workbook with
workbook.SaveToFile. - Dispose of the workbook with
workbook.Disposeto free resources.
The complete code example below shows how to fill an Excel comment with a solid colour in React:
function App() {
  const fillCommentColor = async () => {
    // get the Spire.XLS WASM module
    const xlsModule = window.wasmModule?.spirexls;

    // check that the module is ready
    if (!xlsModule) {
      alert('Spire.Xls is not ready yet');
      return;
    }

    // load the font and the test data file into the VFS
    await window.spire.FetchFileToVFS('ARIAL.TTF', '/Library/Fonts/', `${process.env.PUBLIC_URL}/font/`);
    const inputFileName = 'ProductList.xlsx';
    await window.spire.FetchFileToVFS(inputFileName, '', `${process.env.PUBLIC_URL}data/`);

    // load the workbook
    const workbook = new xlsModule.Workbook();
    workbook.LoadFromFile({ fileName: inputFileName });

    // take the first worksheet and add a comment to cell A4
    const sheet = workbook.Worksheets.get(0);
    const range = sheet.Range.get('A4');

    // create the font the comment text will use
    const font = workbook.CreateFont();
    font.FontName = 'Arial';
    font.Size = 11;
    font.KnownColor = xlsModule.ExcelColors.Orange;

    // write the comment text and set the whole text to that font
    const commentText = 'This product leads the season';
    range.Comment.Text = commentText;
    range.Comment.RichText.SetFont(0, commentText.length - 1, font);

    // set the comment fill to a solid colour and pick the colour
    range.Comment.Fill.FillType = xlsModule.ShapeFillType.SolidColor;
    range.Comment.Fill.ForeColor = xlsModule.Color.get_SkyBlue();
    range.Comment.Visible = true;

    // save the workbook
    const outputFileName = 'CommentFillColor.xlsx';
    workbook.SaveToFile({ fileName: outputFileName, version: xlsModule.ExcelVersion.Version2010 });

    // dispose of the workbook to free resources
    workbook.Dispose();

    // read the result file from the VFS and start the download
    const fileArray = window.dotnetRuntime.Module.FS.readFile(outputFileName);
    const blob = new Blob([fileArray], { type: 'application/vnd.openxmlformats-officedocument.spreadsheetml.sheet' });
    const url = URL.createObjectURL(blob);
    const a = document.createElement('a');
    a.href = url;
    a.download = outputFileName;
    a.click();
    URL.revokeObjectURL(url);
  };

  return (
    <div style={{ textAlign: 'center', height: '300px' }}>
      <h1>Insert Comments with Pictures</h1>
      <button id="comment-fill-color" onClick={fillCommentColor}>Fill a comment with a solid colour</button>
    </div>
  );
}

export default App;
After running, the effect of filling a comment with a solid colour:
FAQ
Why does the picture comment not appear when the result file is opened
Reason: Comments are hidden by default and appear only when the mouse moves over the cell. If the comment was not set to visible before saving, reopening the file shows an ordinary worksheet, and the picture comment does not appear on its own.
Solution: Set comment.Visible to true, and the comment appears as soon as the file is opened:
comment.Visible = true;
Get a Free License
Spire.XLS for JavaScript offers a 30-day full-featured free trial license with no functional limitations. Apply here to evaluate before purchasing.
A shape in Excel is usually there to point at something: the arrow on a diagram, the triangle that flags a number, the cloud that circles an area. Give it a hyperlink and the drawing becomes an entry point a reader can click. A shape, like a picture, is not a cell, and its hyperlink lives on the shape object itself, so both setting and reading one go through the worksheet's shape collection rather than its cell hyperlink collection. Spire.XLS for JavaScript does this in the browser on WebAssembly, handling input and output files through a virtual file system (VFS) with no backend service.
This article covers two core feature points:
For installation and project setup, see Integrating Spire.XLS for JavaScript in a React Project. The examples below assume Spire.XLS is installed and the WebAssembly module has been initialised.
Set a hyperlink on a shape
Setting a hyperlink on a shape is what turns a drawing into a clickable entry point: a reader who clicks the shape on the worksheet opens the address it points at. The link belongs to the shape itself rather than to a cell, so the shape has to be taken from the worksheet's shape collection first, and the address handed to its own link object. The steps are:
- Load the font and the test data file into the VFS.
- Load the workbook with
workbook.LoadFromFile. - Add the shapes into the space left for them with
sheet.PrstGeomShapes.AddPrstGeomShape. - Take the shape count from
sheet.PrstGeomShapes.Countand walk every shape on the worksheet with it. - Take each shape's link object from its
HyLinkproperty and write the address into itsAddress. - Save the workbook with
workbook.SaveToFile. - Dispose of the workbook with
workbook.Disposeto free resources.
The complete code example below shows how to set a hyperlink on a shape in Excel in React:
function App() {
  const shapeHyperlink = async () => {
    // get the Spire.XLS WASM module
    const xlsModule = window.wasmModule?.spirexls;

    // check that the module is ready
    if (!xlsModule) {
      alert('Spire.Xls is not ready yet');
      return;
    }

    // load the font and the test data file into the VFS
    await window.spire.FetchFileToVFS('ARIAL.TTF', '/Library/Fonts/', `${process.env.PUBLIC_URL}/font/`);
    const inputFileName = 'ShapeLink.xlsx';
    await window.spire.FetchFileToVFS(inputFileName, '', `${process.env.PUBLIC_URL}data/`);

    // load the workbook
    const workbook = new xlsModule.Workbook();
    workbook.LoadFromFile({ fileName: inputFileName });

    // take the first worksheet and add the three shapes into the space left for them
    const sheet = workbook.Worksheets.get(0);
    const shapes = sheet.PrstGeomShapes;
    shapes.AddPrstGeomShape(10, 1, 90, 60, xlsModule.PrstGeomShapeType.Triangle);
    shapes.AddPrstGeomShape(10, 3, 90, 60, xlsModule.PrstGeomShapeType.CurvedRightArrow);
    shapes.AddPrstGeomShape(10, 5, 90, 60, xlsModule.PrstGeomShapeType.Cloud);

    // set a hyperlink on each shape in turn
    const addresses = [
      'https://www.e-iceblue.com/Introduce/xls-for-javascript.html',
      'https://www.e-iceblue.com/Buy/Spire.XLS-JavaScript.html',
      'https://www.e-iceblue.com/Download/Spire-Office-JavaScript.html',
    ];
    for (let i = 0; i < shapes.Count; i++) {
      shapes.get(i).HyLink.Address = addresses[i];
    }

    // save the workbook
    const outputFileName = 'ShapeHyperlink.xlsx';
    workbook.SaveToFile({ fileName: outputFileName, fileFormat: xlsModule.FileFormat.Version2010 });

    // dispose of the workbook to free resources
    workbook.Dispose();

    // read the result file from the VFS and start the download
    const fileArray = window.dotnetRuntime.Module.FS.readFile(outputFileName);
    const blob = new Blob([fileArray], { type: 'application/vnd.openxmlformats-officedocument.spreadsheetml.sheet' });
    const url = URL.createObjectURL(blob);
    const a = document.createElement('a');
    a.href = url;
    a.download = outputFileName;
    a.click();
    URL.revokeObjectURL(url);
  };

  return (
    <div style={{ textAlign: 'center', height: '300px' }}>
      <h1>Add Hyperlinks to Shapes in Excel</h1>
      <button id="shape-hyperlink" onClick={shapeHyperlink}>Set a hyperlink on the shape</button>
    </div>
  );
}

export default App;
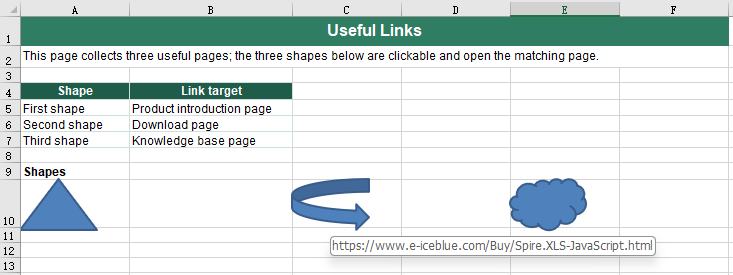
After running, the effect of setting a hyperlink on a shape:
Read the hyperlink from a shape
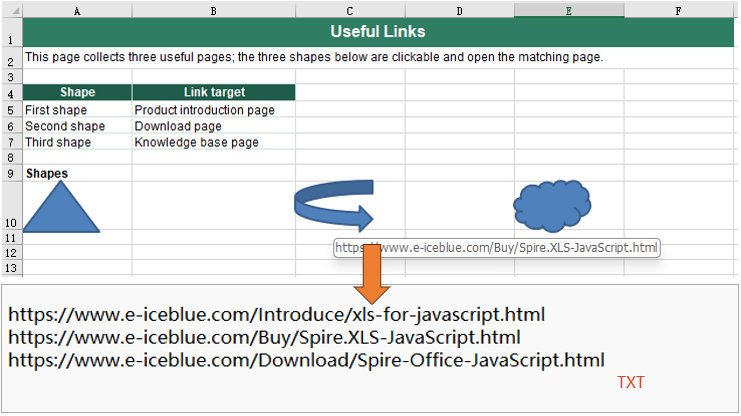
Reading the hyperlink off a shape is how a finished sheet is checked over: whether every shape carries a link, and whether they point at the right addresses. The addresses that come back are written out as a text file, which makes them easy to line up against a list of links. Shape hyperlinks are not kept in the cell hyperlink collection, so the shapes have to be taken from the worksheet one by one, and each one asked for its own link object. The steps are:
- Load the font and the test data file into the VFS.
- Load the workbook with
workbook.LoadFromFile. - Take the shape count from
sheet.PrstGeomShapes.Countand walk every shape on the worksheet with it. - Take this shape's link object from its
HyLinkproperty. - Read the target address from the link object's
Address, collecting the addresses as you go. - Write the collected addresses into a text file with
FS.writeFile, one address per line. - Dispose of the workbook with
workbook.Disposeto free resources.
The complete code example below shows how to read the hyperlink from a shape in Excel in React:
function App() {
  const readShapeHyperlink = async () => {
    // get the Spire.XLS WASM module
    const xlsModule = window.wasmModule?.spirexls;

    // check that the module is ready
    if (!xlsModule) {
      alert('Spire.Xls is not ready yet');
      return;
    }

    // load the font and the test data file into the VFS
    await window.spire.FetchFileToVFS('ARIAL.TTF', '/Library/Fonts/', `${process.env.PUBLIC_URL}/font/`);
    const inputFileName = 'ShapeHyperlinks.xlsx';
    await window.spire.FetchFileToVFS(inputFileName, '', `${process.env.PUBLIC_URL}data/`);

    // load the workbook
    const workbook = new xlsModule.Workbook();
    workbook.LoadFromFile({ fileName: inputFileName });

    // walk the shapes of the worksheet and read the hyperlink off each one
    const sheet = workbook.Worksheets.get(0);
    const shapes = sheet.PrstGeomShapes;
    const addresses = [];
    for (let i = 0; i < shapes.Count; i++) {
      addresses.push(shapes.get(i).HyLink.Address);
    }

    // write the addresses that were read into a text file
    const outputFileName = 'ReadShapeHyperlink.txt';
    window.dotnetRuntime.Module.FS.writeFile(outputFileName, addresses.join('\n'));

    // dispose of the workbook to free resources
    workbook.Dispose();

    // read the result file from the VFS and start the download
    const fileArray = window.dotnetRuntime.Module.FS.readFile(outputFileName);
    const blob = new Blob([fileArray], { type: 'text/plain' });
    const url = URL.createObjectURL(blob);
    const a = document.createElement('a');
    a.href = url;
    a.download = outputFileName;
    a.click();
    URL.revokeObjectURL(url);
  };

  return (
    <div style={{ textAlign: 'center', height: '300px' }}>
      <h1>Add Hyperlinks to Shapes in Excel</h1>
      <button id="read-shape-hyperlink" onClick={readShapeHyperlink}>Read the hyperlink from the shape</button>
    </div>
  );
}

export default App;
After running, the effect of reading the hyperlink from a shape:
FAQ
Why does a shape's hyperlink not show up in sheet.HyperLinks?
Cause: sheet.HyperLinks collects cell hyperlinks only. A shape is not a cell; it belongs to the worksheet's shape collection, and the link hangs on the shape object's HyLink.
Solution: Go through the shape collection. In this example, after a hyperlink was set on the shapes, sheet.HyperLinks.Count was still 0, and it was still 0 after the file was saved and opened again. Read a shape's link with sheet.PrstGeomShapes.get(i).HyLink.Address.
Get a Free License
Spire.XLS for JavaScript offers a 30-day full-featured free trial license with no functional limitations. Apply here to evaluate before purchasing.
Add Cross-Sheet and External File Links with JavaScript in React
2026-10-13 01:09:11 Written by liu taliaExcel workbooks often need to tie scattered content together: one click on a summary page jumps to a detail worksheet, one click on a quote opens the source file kept beside it. That "jump elsewhere" ability belongs to cell hyperlinks, and the link type decides where the jump goes -- another worksheet inside the same workbook, or a file outside it. Spire.XLS for JavaScript does this in the browser through WebAssembly; input and output files are managed by a virtual file system (VFS), with no backend service required.
This article covers two feature points:
For installation and project setup, see Integrating Spire.XLS for JavaScript in a React Project. The examples below assume Spire.XLS is installed and the WebAssembly module has been initialized.
Add a link to another worksheet
A cross-sheet link solves the "jump from here to there" problem inside one workbook: it strings the content scattered across worksheets into a clickable path, so that the reader does not have to hunt for the right sheet. A link sits on a cell, so the first move is to create a hyperlink object on the target cell and then say, in turn, where it jumps and what text it shows. The steps are:
- Load the font and the test data file into the VFS.
- Load the workbook with
workbook.LoadFromFile. - Create a hyperlink object on the target cell with
sheet.HyperLinks.Add. - Mark the type as a workbook-internal link with the hyperlink's
Typeproperty, set toxlsModule.HyperLinkType.Workbook. - Set the text shown on the cell with the
TextToDisplayproperty. - Write the jump target into the
Addressproperty, in the form "sheet name!cell", for exampleData!B7. - Style the link text blue and underlined so that it reads differently from ordinary text.
- Save the workbook with
workbook.SaveToFile. - Dispose of the workbook with
workbook.Disposeto free resources.
The complete code example below shows how to add a cross-sheet hyperlink to an Excel cell in React:
function App() {
  const linkToOtherSheet = async () => {
    // get the Spire.XLS WASM module
    const xlsModule = window.wasmModule?.spirexls;

    // check that the module is ready
    if (!xlsModule) {
      alert('Spire.Xls is not ready yet');
      return;
    }

    // load the font and the test data file into the VFS
    await window.spire.FetchFileToVFS('ARIAL.TTF', '/Library/Fonts/', `${process.env.PUBLIC_URL}/font/`);
    const inputFileName = 'SheetLink.xlsx';
    await window.spire.FetchFileToVFS(inputFileName, '', `${process.env.PUBLIC_URL}data/`);

    // load the workbook
    const workbook = new xlsModule.Workbook();
    workbook.LoadFromFile({ fileName: inputFileName });

    // take the first worksheet and add a hyperlink object to cell B5
    const sheet = workbook.Worksheets.get(0);
    const cell = sheet.Range.get('B5');
    const hyperlink = sheet.HyperLinks.Add({ range: cell });

    // mark it as a workbook-internal link that points at cell B7 of the second worksheet
    hyperlink.Type = xlsModule.HyperLinkType.Workbook;
    hyperlink.TextToDisplay = 'View the full-year total in the data sheet';
    hyperlink.Address = 'Data!B7';

    // colour the link text blue and underline it so that it reads as a link
    cell.Style.Font.Color = xlsModule.Color.get_Blue();
    cell.Style.Font.Underline = xlsModule.FontUnderlineType.Single;

    // save the workbook
    const outputFileName = 'LinkToOtherSheetCell.xlsx';
    workbook.SaveToFile({ fileName: outputFileName, fileFormat: xlsModule.FileFormat.Version2010 });

    // dispose of the workbook to free resources
    workbook.Dispose();

    // read the result file from the VFS and start the download
    const fileArray = window.dotnetRuntime.Module.FS.readFile(outputFileName);
    const blob = new Blob([fileArray], { type: 'application/vnd.openxmlformats-officedocument.spreadsheetml.sheet' });
    const url = URL.createObjectURL(blob);
    const a = document.createElement('a');
    a.href = url;
    a.download = outputFileName;
    a.click();
    URL.revokeObjectURL(url);
  };

  return (
    <div style={{ textAlign: 'center', height: '300px' }}>
      <h1>Add Cross-Sheet and External File Links in Excel</h1>
      <button id="link-to-other-sheet" onClick={linkToOtherSheet}>Add a link to another worksheet</button>
      <button id="link-to-external-file" onClick={linkToExternalFile}>Add a link to an external file</button>
    </div>
  );
}

export default App;
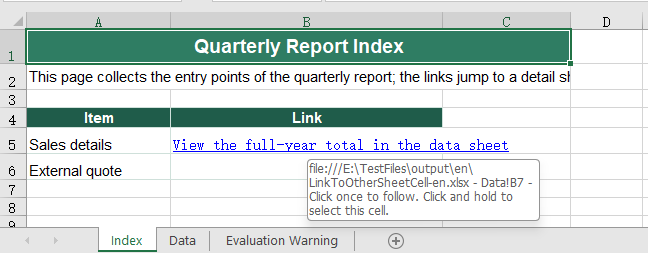
After running, the effect of adding a cross-sheet link:
Add a link to an external file
A cross-sheet link can only jump within the same workbook, so once the target falls outside it, the link has to become a file link. It differs from a cross-sheet link in just two places: the type is marked as a file link, and the jump target becomes a file path -- either a full path or a path relative to the current workbook. The steps are:
- Load the font and the test data file into the VFS.
- Load the workbook with
workbook.LoadFromFile. - Create a hyperlink object on the target cell with
sheet.HyperLinks.Add. - Mark the type as a file link with the
Typeproperty, set toxlsModule.HyperLinkType.File. - Set the text shown on the cell with the
TextToDisplayproperty. - Write the path of the external file into the
Addressproperty, for example../files/Quote.xlsx. - Style the link text blue and underlined so that it reads differently from ordinary text.
- Save the workbook with
workbook.SaveToFile. - Dispose of the workbook with
workbook.Disposeto free resources.
The complete code example below shows how to add an external-file hyperlink to an Excel cell in React:
function App() {
  const linkToExternalFile = async () => {
    // get the Spire.XLS WASM module
    const xlsModule = window.wasmModule?.spirexls;

    // check that the module is ready
    if (!xlsModule) {
      alert('Spire.Xls is not ready yet');
      return;
    }

    // load the font and the test data file into the VFS
    await window.spire.FetchFileToVFS('ARIAL.TTF', '/Library/Fonts/', `${process.env.PUBLIC_URL}/font/`);
    const inputFileName = 'SheetLink.xlsx';
    await window.spire.FetchFileToVFS(inputFileName, '', `${process.env.PUBLIC_URL}data/`);

    // load the workbook
    const workbook = new xlsModule.Workbook();
    workbook.LoadFromFile({ fileName: inputFileName });

    // take the first worksheet and add a hyperlink object to cell B6
    const sheet = workbook.Worksheets.get(0);
    const cell = sheet.Range.get('B6');
    const hyperlink = sheet.HyperLinks.Add({ range: cell });

    // mark it as a file link that points at a file outside the workbook
    hyperlink.Type = xlsModule.HyperLinkType.File;
    hyperlink.TextToDisplay = 'Open the external quote';
    hyperlink.Address = '../files/Quote.xlsx';

    // colour the link text blue and underline it so that it reads as a link
    cell.Style.Font.Color = xlsModule.Color.get_Blue();
    cell.Style.Font.Underline = xlsModule.FontUnderlineType.Single;

    // save the workbook
    const outputFileName = 'LinkToExternalFile.xlsx';
    workbook.SaveToFile({ fileName: outputFileName, fileFormat: xlsModule.FileFormat.Version2010 });

    // dispose of the workbook to free resources
    workbook.Dispose();

    // read the result file from the VFS and start the download
    const fileArray = window.dotnetRuntime.Module.FS.readFile(outputFileName);
    const blob = new Blob([fileArray], { type: 'application/vnd.openxmlformats-officedocument.spreadsheetml.sheet' });
    const url = URL.createObjectURL(blob);
    const a = document.createElement('a');
    a.href = url;
    a.download = outputFileName;
    a.click();
    URL.revokeObjectURL(url);
  };

  return (
    <div style={{ textAlign: 'center', height: '300px' }}>
      <h1>Add Cross-Sheet and External File Links in Excel</h1>
      <button id="link-to-other-sheet" onClick={linkToOtherSheet}>Add a link to another worksheet</button>
      <button id="link-to-external-file" onClick={linkToExternalFile}>Add a link to an external file</button>
    </div>
  );
}

export default App;
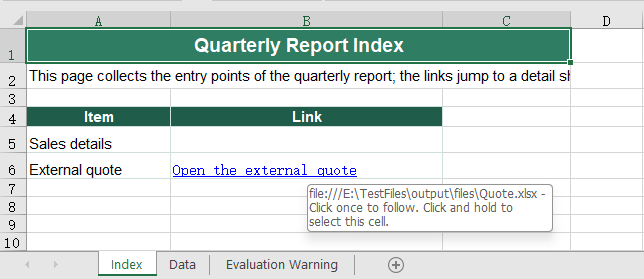
After running, the effect of adding an external-file link:
FAQ
Why does adding a link to a cell that already has text replace that text with the address
Reason: The text a cell shows is decided by TextToDisplay. Create a link without setting it and the address moves up to serve as the display text; the replacement happens the moment the link is added, so reading Range.Text afterwards returns the address rather than the original text.
Solution: Read the text before adding the link, then hand it back to TextToDisplay once the link is in place:
const cell = sheet.Range.get('B6');
const text = cell.Text;                  // keep the original text before adding the link
const hyperlink = sheet.HyperLinks.Add({ range: cell });
hyperlink.Type = xlsModule.HyperLinkType.File;
hyperlink.Address = '../files/Quote.xlsx';
hyperlink.TextToDisplay = text;          // hand the text back, so the cell still shows it
How do I remove a link but keep the text in the cell
Reason: The link and the text are two different things -- the link hangs on the cell, while the text is the cell's content. Range.ClearAll() clears the content, so using it to get rid of a link takes the text with it.
Solution: Remove the link by index with sheet.HyperLinks.RemoveAt, and the cell text stays as it was. For example, sheet.HyperLinks.RemoveAt(0) removes the first link; the text is still in the cell afterwards, it simply is no longer clickable.
Get a Free License
Spire.XLS for JavaScript offers a 30-day full-featured free trial license with no functional limitations. Apply here to evaluate before purchasing.
Add Hyperlinks to Pictures in Excel with JavaScript in React
2026-10-10 09:24:23 Written by liu taliaA picture in Excel is more than decoration. Put a logo or a product shot on a worksheet and give it a hyperlink, and the file stops being a plain description and becomes something a reader can click through. A picture is not a cell, though, and its hyperlink lives on the picture object, so both setting and reading one go through the worksheet's picture collection rather than its cell hyperlink collection. Spire.XLS for JavaScript does this in the browser on WebAssembly, handling input and output files through a virtual file system (VFS) with no backend service.
This article covers two core feature points:
For installation and project setup, see Integrating Spire.XLS for JavaScript in a React Project. The examples below assume Spire.XLS is installed and the WebAssembly module has been initialised.
Set a hyperlink on a picture
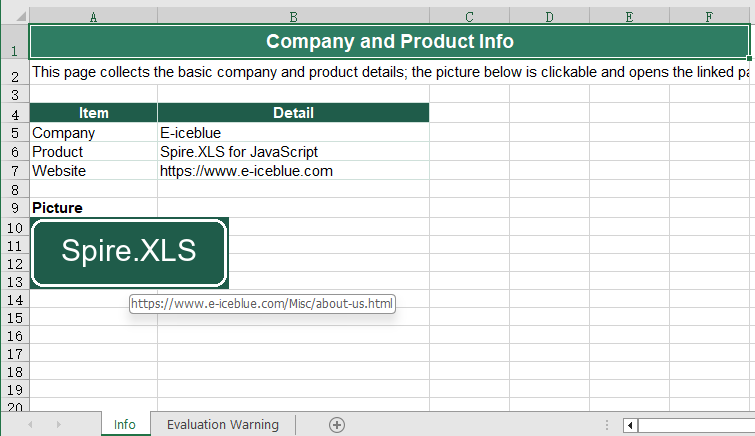
Setting a hyperlink on a picture is what turns it into a clickable entry point: a reader who clicks the picture on the worksheet opens the address it points at. The link belongs to the picture itself rather than to a cell, so the picture object has to be taken from the worksheet's picture collection first, and the address handed to that object. The steps are:
- Load the font, the picture and the test data file into the VFS.
- Load the workbook with
workbook.LoadFromFile. - Insert the picture into the space left for it with
sheet.Pictures.Add. - Set the hyperlink on the picture with
picture.SetHyperLink, passingtrueas the second argument. - Save the workbook with
workbook.SaveToFile. - Dispose of the workbook with
workbook.Disposeto free resources.
The complete code example below shows how to set a hyperlink on a picture in Excel in React:
function App() {
  const pictureHyperlink = async () => {
    // get the Spire.XLS WASM module
    const xlsModule = window.wasmModule?.spirexls;

    // check that the module is ready
    if (!xlsModule) {
      alert('Spire.Xls is not ready yet');
      return;
    }

    // load the font, the picture and the test data file into the VFS
    await window.spire.FetchFileToVFS('ARIAL.TTF', '/Library/Fonts/', `${process.env.PUBLIC_URL}/font/`);
    await window.spire.FetchFileToVFS('logo.png', '', `${process.env.PUBLIC_URL}data/`);
    const inputFileName = 'PictureLink.xlsx';
    await window.spire.FetchFileToVFS(inputFileName, '', `${process.env.PUBLIC_URL}data/`);

    // load the workbook
    const workbook = new xlsModule.Workbook();
    workbook.LoadFromFile({ fileName: inputFileName });

    // take the first worksheet and drop the picture into the space left for it
    const sheet = workbook.Worksheets.get(0);
    const picture = sheet.Pictures.Add({ topRow: 10, leftColumn: 1, fileName: 'logo.png' });

    // set the hyperlink on the picture; the second argument being true means it points outside the workbook
    picture.SetHyperLink('https://www.e-iceblue.com/Misc/about-us.html', true);

    // save the workbook
    const outputFileName = 'PictureHyperlink.xlsx';
    workbook.SaveToFile({ fileName: outputFileName, fileFormat: xlsModule.FileFormat.Version2010 });

    // dispose of the workbook to free resources
    workbook.Dispose();

    // read the result file from the VFS and start the download
    const fileArray = window.dotnetRuntime.Module.FS.readFile(outputFileName);
    const blob = new Blob([fileArray], { type: 'application/vnd.openxmlformats-officedocument.spreadsheetml.sheet' });
    const url = URL.createObjectURL(blob);
    const a = document.createElement('a');
    a.href = url;
    a.download = outputFileName;
    a.click();
    URL.revokeObjectURL(url);
  };

  return (
    <div style={{ textAlign: 'center', height: '300px' }}>
      <h1>Add Hyperlinks to Pictures in Excel</h1>
      <button id="picture-hyperlink" onClick={pictureHyperlink}>Set a hyperlink on the picture</button>
    </div>
  );
}

export default App;
After running, the effect of setting a hyperlink on a picture:
Read the hyperlink from a picture
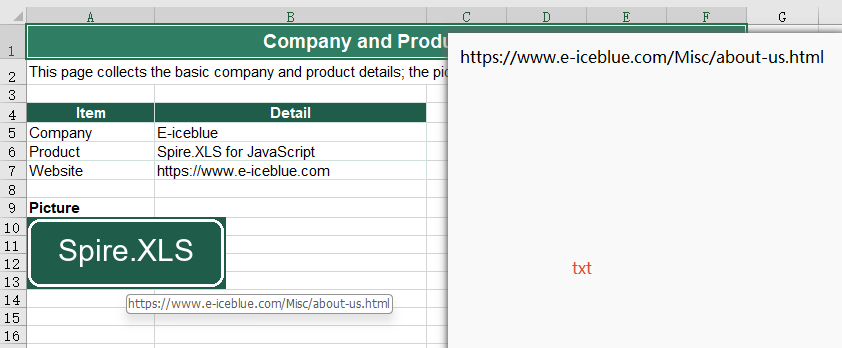
Reading the hyperlink off a picture is how a finished workbook is checked over: whether the links are all there, and whether they point at the right addresses. The addresses that come back are written out as a text file, which makes them easy to line up against a list of links. Picture hyperlinks are not kept in the cell hyperlink collection, so the pictures have to be taken from the worksheet one by one, and each one asked for its own link object. The steps are:
- Load the font and the test data file into the VFS.
- Load the workbook with
workbook.LoadFromFile. - Take the picture count from
sheet.Pictures.Countand walk every picture on the worksheet with it. - Take this picture's hyperlink object with
picture.GetHyperLink. - Read the target address from the link object's
Address, collecting the addresses as you go. - Write the collected addresses into a text file with
FS.writeFile, one address per line. - Dispose of the workbook with
workbook.Disposeto free resources.
The complete code example below shows how to read the hyperlink from a picture in Excel in React:
function App() {
  const readPictureHyperlink = async () => {
    // get the Spire.XLS WASM module
    const xlsModule = window.wasmModule?.spirexls;

    // check that the module is ready
    if (!xlsModule) {
      alert('Spire.Xls is not ready yet');
      return;
    }

    // load the font and the test data file into the VFS
    await window.spire.FetchFileToVFS('ARIAL.TTF', '/Library/Fonts/', `${process.env.PUBLIC_URL}/font/`);
    const inputFileName = 'PictureHyperlinks.xlsx';
    await window.spire.FetchFileToVFS(inputFileName, '', `${process.env.PUBLIC_URL}data/`);

    // load the workbook
    const workbook = new xlsModule.Workbook();
    workbook.LoadFromFile({ fileName: inputFileName });

    // walk the pictures of the worksheet and read the hyperlink off each one
    const sheet = workbook.Worksheets.get(0);
    const pictures = sheet.Pictures;
    const addresses = [];
    for (let i = 0; i < pictures.Count; i++) {
      const link = pictures.get(i).GetHyperLink();
      addresses.push(link.Address);
    }

    // write the addresses that were read into a text file
    const outputFileName = 'ReadPictureHyperlink.txt';
    window.dotnetRuntime.Module.FS.writeFile(outputFileName, addresses.join('\n'));

    // dispose of the workbook to free resources
    workbook.Dispose();

    // read the result file from the VFS and start the download
    const fileArray = window.dotnetRuntime.Module.FS.readFile(outputFileName);
    const blob = new Blob([fileArray], { type: 'text/plain' });
    const url = URL.createObjectURL(blob);
    const a = document.createElement('a');
    a.href = url;
    a.download = outputFileName;
    a.click();
    URL.revokeObjectURL(url);
  };

  return (
    <div style={{ textAlign: 'center', height: '300px' }}>
      <h1>Add Hyperlinks to Pictures in Excel</h1>
      <button id="read-picture-hyperlink" onClick={readPictureHyperlink}>Read the hyperlink from the picture</button>
    </div>
  );
}

export default App;
After running, the effect of reading the hyperlink from a picture:
FAQ
Why does a picture's hyperlink not show up in sheet.HyperLinks?
Cause: sheet.HyperLinks collects cell hyperlinks only. A picture is not a cell; it belongs to the worksheet's picture collection, and the link hangs on the picture object itself.
Solution: Go through the picture collection. In this example, after a hyperlink was set on the picture, sheet.HyperLinks.Count was still 0, and it was still 0 after the file was saved and opened again. Read a picture's link with sheet.Pictures.get(i).GetHyperLink(), then read the Address off the link object.
When should the second argument of SetHyperLink be false?
Cause: The second argument of picture.SetHyperLink(address, isExternal) says whether the target lies outside the workbook.
Solution: Pass true for a web page or an external file, and the link type comes out as HyperLinkType.Url; pass false for a position inside the same workbook, write the address as a cell reference such as Sheet1!A1, and the type comes out as HyperLinkType.Workbook. In this example both forms were saved, and after the file was opened again the Address and Type read back matched what had been set.
Get a Free License
Spire.XLS for JavaScript offers a 30-day full-featured free trial license with no functional limitations. Apply here to evaluate before purchasing.
Delete Excel Formulas but Keep Values in React with JavaScript
2026-10-10 01:21:45 Written by liu taliaOnce a report is final, the formulas inside it turn from helper into liability: a reference to another sheet, to another file, or to a row that has since been deleted, and any one of those changes can turn a whole column of numbers into #REF!. When the file is archived or sent outside the team, the safe move is to replace each formula with the result it has just calculated — the same numbers, no longer depending on anything else. The detail sheet, on the other hand, may still need its formulas in order to be maintained, so it cannot be stripped along with the rest. What really has to be decided is the scope: the whole workbook, or one range inside it. ClearContent in Spire.XLS for JavaScript clears the cell's contents and leaves its formatting alone, so writing the result back keeps the thousands separator in an amount and the display style of a date exactly as they were. Spire.XLS for JavaScript does all of this in the browser on WebAssembly, handling input and output files through a virtual file system (VFS) with no backend service.
This article covers two core feature points:
For installation and project setup, see Integrating Spire.XLS for JavaScript in a React Project. The examples below assume Spire.XLS is installed and the WebAssembly module has been initialised.
Delete the formulas of the whole workbook
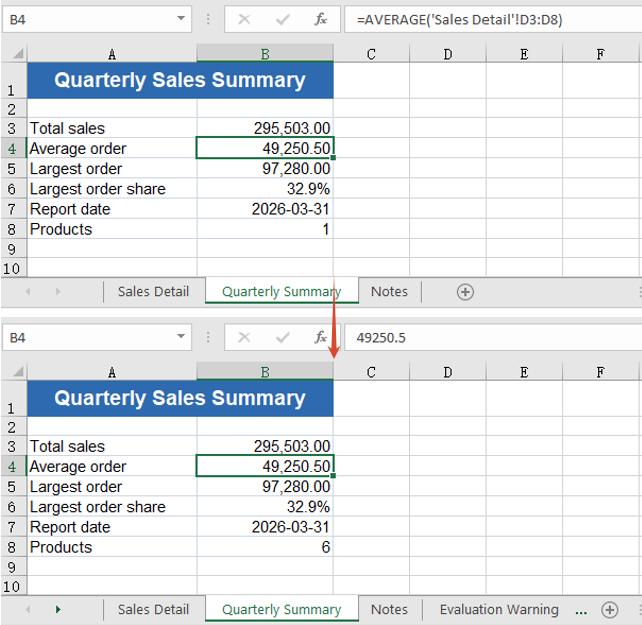
When a report is archived, sent out, or handed to someone who has no business seeing the logic behind it, the formulas are the liability: cross-sheet references, external links, rows deleted afterwards — any one of those changes can make the numbers go dead. Replacing each formula with the result it has just calculated turns the file into a snapshot that depends on nothing else and no longer changes: numbers, formatting and totals all still there, only each cell has been fixed in place. A whole-book delivery is the most common case, so the first approach walks every worksheet in the workbook. The steps are:
- Load the font and the test data file into the VFS.
- Load the workbook with
workbook.LoadFromFile. - Walk every worksheet using
workbook.Worksheets.Count. - Walk the cells of that worksheet with
sheet.Range.Cells, which covers the used range of the sheet. - Test whether the cell holds a formula with
cell.HasFormula. - If it does, take the result it has calculated with
cell.FormulaValue. - Clear the formula with
cell.Clear(xlsModule.ExcelClearOptions.ClearContent)— contents only, the formatting stays where it is. - Write the result taken in the previous step back into the cell with
cell.Value2. - Save the workbook with
workbook.SaveToFile.
The complete code example below shows how to delete the formulas of a whole workbook in React:
function App() {
  const removeAllFormulas = async () => {
    // get the Spire.XLS WASM module
    const xlsModule = window.wasmModule?.spirexls;

    // check that the module is ready
    if (!xlsModule) {
      alert('Spire.Xls is not ready yet');
      return;
    }

    // load the font and the test data file into the VFS
    await window.spire.FetchFileToVFS('ARIAL.TTF', '/Library/Fonts/', `${process.env.PUBLIC_URL}/font/`);
    const inputFileName = 'RemoveFormulas.xlsx';
    await window.spire.FetchFileToVFS(inputFileName, '', `${process.env.PUBLIC_URL}data/`);

    // load the workbook
    const workbook = new xlsModule.Workbook();
    workbook.LoadFromFile({ fileName: inputFileName });

    // walk every worksheet and every cell looking for formulas
    for (let i = 0; i < workbook.Worksheets.Count; i++) {
      const sheet = workbook.Worksheets.get(i);

      for (const cell of sheet.Range.Cells) {
        // only a formula cell needs work: take the result it has calculated, clear the cell, then write the result back
        if (cell.HasFormula) {
          const value = cell.FormulaValue;
          cell.Clear(xlsModule.ExcelClearOptions.ClearContent);
          cell.Value2 = value;
        }
      }
    }

    // save the workbook
    const outputFileName = 'RemoveAllFormulas.xlsx';
    workbook.SaveToFile({ fileName: outputFileName });

    // dispose of the workbook to free resources
    workbook.Dispose();

    // read the result file from the VFS and start the download
    const fileArray = window.dotnetRuntime.Module.FS.readFile(outputFileName);
    const blob = new Blob([fileArray], { type: 'application/vnd.openxmlformats-officedocument.spreadsheetml.sheet' });
    const url = URL.createObjectURL(blob);
    const a = document.createElement('a');
    a.href = url;
    a.download = outputFileName;
    a.click();
    URL.revokeObjectURL(url);
  };

  return (
    <div style={{ textAlign: 'center', height: '300px' }}>
      <h1>Delete Formulas but Keep the Values in Excel</h1>
      <button id="remove-all-formulas" onClick={removeAllFormulas}>Remove the formulas of the whole workbook</button>
    </div>
  );
}

export default App;
After running, deleting the formulas of a whole workbook and keeping the values:
Delete the formulas of one range
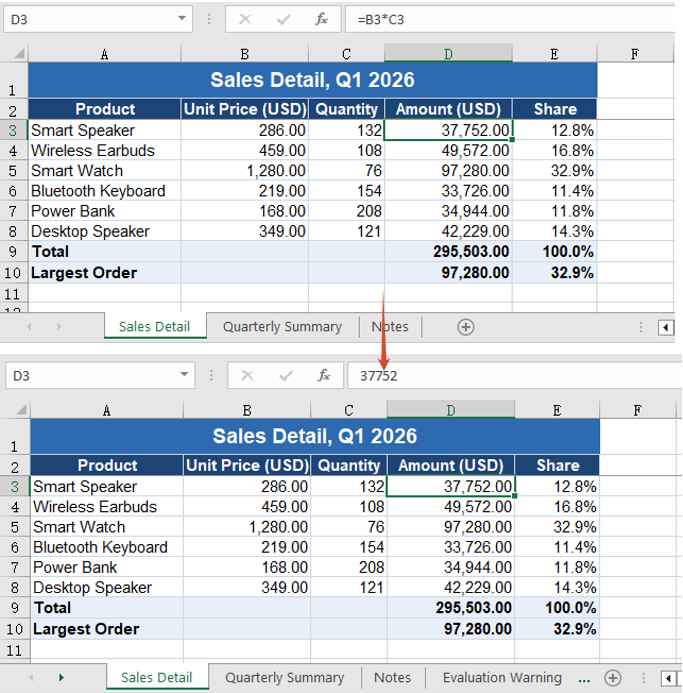
Within a single worksheet, some cells will never change again and are best frozen into values, while others have to follow whatever else moves and must keep their formulas. Narrowing the scope down to a range lets both needs live in the same sheet, and the formulas outside the range are untouched. The steps are:
- Load the font and the test data file into the VFS.
- Load the workbook with
workbook.LoadFromFile. - Take the first worksheet with
workbook.Worksheets.get(0). - Mark out the stretch to process with
sheet.Range.get('D3:D10'). - Walk the cells inside the range with
range.Cells; cells outside it never enter the loop. - Test whether the cell holds a formula with
cell.HasFormula. - If it does, take the result it has calculated with
cell.FormulaValue. - Clear the formula with
cell.Clear(xlsModule.ExcelClearOptions.ClearContent). - Write the result back into the cell with
cell.Value2. - Save the workbook with
workbook.SaveToFile.
The complete code example below shows how to delete the formulas of one range in React:
function App() {
  const removeFormulasInRange = async () => {
    // get the Spire.XLS WASM module
    const xlsModule = window.wasmModule?.spirexls;

    // check that the module is ready
    if (!xlsModule) {
      alert('Spire.Xls is not ready yet');
      return;
    }

    // load the font and the test data file into the VFS
    await window.spire.FetchFileToVFS('ARIAL.TTF', '/Library/Fonts/', `${process.env.PUBLIC_URL}/font/`);
    const inputFileName = 'RemoveFormulas.xlsx';
    await window.spire.FetchFileToVFS(inputFileName, '', `${process.env.PUBLIC_URL}data/`);

    // load the workbook
    const workbook = new xlsModule.Workbook();
    workbook.LoadFromFile({ fileName: inputFileName });

    // take the first worksheet and narrow the range down to the amount column
    const sheet = workbook.Worksheets.get(0);
    const range = sheet.Range.get('D3:D10');

    for (const cell of range.Cells) {
      if (cell.HasFormula) {
        const value = cell.FormulaValue;
        cell.Clear(xlsModule.ExcelClearOptions.ClearContent);
        cell.Value2 = value;
      }
    }

    // save the workbook
    const outputFileName = 'RemoveFormulasInRange.xlsx';
    workbook.SaveToFile({ fileName: outputFileName });

    // dispose of the workbook to free resources
    workbook.Dispose();

    // read the result file from the VFS and start the download
    const fileArray = window.dotnetRuntime.Module.FS.readFile(outputFileName);
    const blob = new Blob([fileArray], { type: 'application/vnd.openxmlformats-officedocument.spreadsheetml.sheet' });
    const url = URL.createObjectURL(blob);
    const a = document.createElement('a');
    a.href = url;
    a.download = outputFileName;
    a.click();
    URL.revokeObjectURL(url);
  };

  return (
    <div style={{ textAlign: 'center', height: '300px' }}>
      <h1>Delete Formulas but Keep the Values in Excel</h1>
      <button id="remove-formulas-in-range" onClick={removeFormulasInRange}>Remove the formulas of one range</button>
    </div>
  );
}

export default App;
After running, deleting the formulas of one range:
FAQ
Does clearing a formula also wipe the cell's number format and fill?
Cause: Clearing a cell goes through Clear, and what it clears is decided by the ExcelClearOptions passed in. ClearAll or ClearFormat wipes the formatting along with everything else; ClearContent clears the contents only.
Solution: Pass ClearContent. The number format, the font and the fill all stay where they were, and the value written back is still shown the way it was — an amount keeps its thousands separator and two decimals, and a date still reads 2026-03-31 rather than the serial number 46112.
Why does cell.Value not give me the result a formula calculated?
Cause: While a cell still carries a formula, cell.Value returns the formula itself rather than its result.
Solution: Read the result with FormulaValue, or with FormulaNumberValue when only the number is wanted. Once the formula has been cleared and replaced by a value, Value returns that number.
// a cell that still has its formula: Value is the formula text, the result is in
// FormulaValue / FormulaNumberValue
const formula = cell.Value;                 // "=B5*C5"
const result = cell.FormulaNumberValue;     // 97280
Get a Free License
Spire.XLS for JavaScript offers a 30-day full-featured free trial license with no functional limitations. Apply here to evaluate before purchasing.
Create a Custom (Combination) Chart in React with JavaScript
2026-10-10 01:21:27 Written by liu taliaDrawing a single chart type per figure is Excel's default behaviour, not a rule anyone has to keep. A report usually has more than one thing to say, and each reading has a shape that suits it: height suits columns, movement suits a line, a running total suits an area. A custom (combination) chart exists for exactly this: within one chart, each series can be given a chart type of its own, and which types are put together is decided by the questions the figure has to answer side by side -- there is no fixed pairing. Columns with a line is the pairing most widely used in practice, because it accommodates both readings at once. The example below takes that pair, drawing sales as columns and the target as a line, so that what the reader compares is the line's position against the column tops. Two separate charts would need their category axes aligned first, before any comparison could be made; one chart, with a category axis the series share, keeps the months strictly aligned. A report also often holds a series that cannot be brought into the main data range, and such a series has to be added by hand. Spire.XLS for JavaScript performs all of this in the browser on top of WebAssembly, managing input and output files through a virtual file system (VFS), with no backend service required.
This article covers two key features:
For installation and project setup, see Integrating Spire.XLS for JavaScript in a React Project. The examples below assume Spire.XLS is installed and the WebAssembly module has been initialised.
Combine a column chart with a line chart
A pairing is not fixed: which types share one figure depends on which questions have to be answered side by side, and columns with a line is only the most widely used of them. In this example sales are best expressed as columns, where heights are compared at a glance, and the target is best expressed as a line, where what the reader compares is its position against the column tops. Once the two series have a type each, one figure carries both readings, and the category axis they share keeps the months strictly aligned, so no comparison across two figures is needed. Substituting clustered bars with a line, or columns with an area, works the same way. The steps are:
- Load the font and the test data file into the VFS.
- Load the workbook with
workbook.LoadFromFileand take the first worksheet. - Add a chart with
sheet.Charts.Add()and pointchart.DataRangeatA1:C7: the first row supplies the series names, the first column the category labels, and the next two columns become one series each. - Set
chart.SeriesDataFromRangetofalseso that each series keeps the values bound to it. - Place the chart on the sheet with
chart.LeftColumn,chart.TopRow,chart.RightColumnandchart.BottomRow. - Give
chart.Series.get(0).SerieTypeandchart.Series.get(1).SerieTypethe valuesExcelChartType.ColumnClusteredandExcelChartType.Line. Every series names its own type this way, so which types go together is yours to choose. - Set the title with
chart.ChartTitle, then save the workbook withworkbook.SaveToFile.
The complete code example below shows how to combine a column chart with a line chart in React:
function App() {
  const combineColumnAndLine = async () => {
    // get the Spire.XLS WASM module
    const xlsModule = window.wasmModule?.spirexls;

    // check that the module is ready
    if (!xlsModule) {
      alert('Spire.Xls is not ready yet');
      return;
    }

    // load the font and the test data file into the VFS
    await window.spire.FetchFileToVFS('ARIAL.TTF', '/Library/Fonts/', `${process.env.PUBLIC_URL}/font/`);
    const inputFileName = 'SalesReport.xlsx';
    await window.spire.FetchFileToVFS(inputFileName, '', `${process.env.PUBLIC_URL}data/`);

    // load the workbook
    const workbook = new xlsModule.Workbook();
    workbook.LoadFromFile({ fileName: inputFileName });

    // take the first worksheet
    const sheet = workbook.Worksheets.get(0);

    // add a chart and bind its data range to A1:C7: the first column becomes the category labels, the next two become one series each
    const chart = sheet.Charts.Add();
    chart.DataRange = sheet.Range.get('A1:C7');
    chart.SeriesDataFromRange = false;

    // place the chart
    chart.LeftColumn = 1;
    chart.TopRow = 10;
    chart.RightColumn = 9;
    chart.BottomRow = 26;

    // give the two series a chart type each: sales drawn as columns, target sales drawn as a line
    chart.Series.get(0).SerieType = xlsModule.ExcelChartType.ColumnClustered;
    chart.Series.get(1).SerieType = xlsModule.ExcelChartType.Line;

    chart.ChartTitle = 'Sales and Target Sales';

    // save the workbook
    const outputFileName = 'CombineColumnAndLine.xlsx';
    workbook.SaveToFile({ fileName: outputFileName });

    // dispose of the workbook to free resources
    workbook.Dispose();

    // read the result file from the VFS and start the download
    const fileArray = window.dotnetRuntime.Module.FS.readFile(outputFileName);
    const blob = new Blob([fileArray], { type: 'application/vnd.openxmlformats-officedocument.spreadsheetml.sheet' });
    const url = URL.createObjectURL(blob);
    const a = document.createElement('a');
    a.href = url;
    a.download = outputFileName;
    a.click();
    URL.revokeObjectURL(url);
  };

  return (
    <div style={{ textAlign: 'center', height: '300px' }}>
      <h1>Create a Custom (Combination) Chart</h1>
      <button id="combine-column-and-line" onClick={combineColumnAndLine}>Combine a column chart with a line chart</button>
    </div>
  );
}

export default App;
After running, the effect of combining a column chart with a line chart: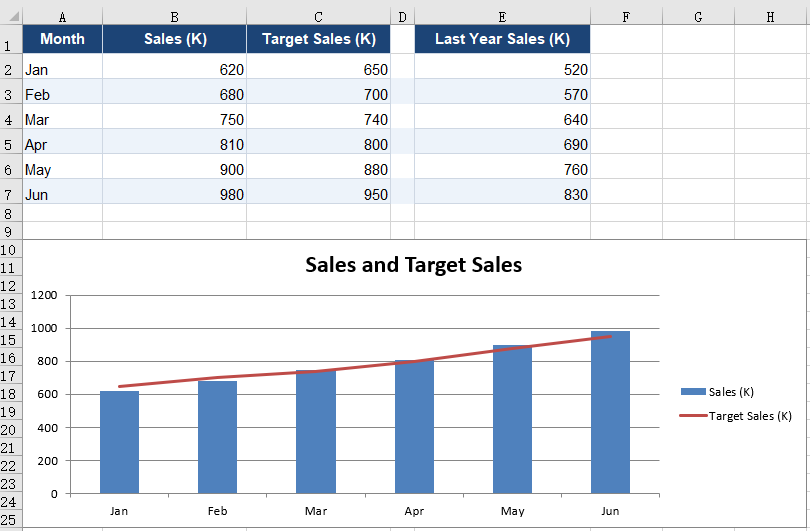
Add a series by hand
DataRange can only ever be one continuous rectangle, and that is a hard limit on how data gets bound. Reports commonly present two such cases: the main data occupies columns A to C while the reference values start a column further along, with an empty column in between; or the values to be plotted are derived by calculation and occupy no cell at all. Neither case can be bound in a single call, so the chart has to be built series by series instead. A hand-added series does not depend on DataRange: its range can point anywhere, and it still takes a chart type of its own, so the rules of a combination chart apply to it in full. Here last year's sales are added as a second column series, paired alongside the current year, with the target line running across both. The steps are:
- Load the font and the test data file into the VFS, load the workbook and take the first worksheet.
- Add a chart with
sheet.Charts.Add()and pointchart.DataRangeat the main block alone,A1:C7. - Give the two series of that block
ExcelChartType.ColumnClusteredandExcelChartType.Line. - Add a series with
chart.Series.Add({ name, serieType }), which takes the series name and its chart type in one call. - Bind the category labels and the values with
series.CategoryLabelsandseries.Values, each pointing at the range the data actually occupies. - Set the title with
chart.ChartTitle, then save the workbook withworkbook.SaveToFile.
The complete code example below shows how to add a series by hand in React:
function App() {
  const addSeriesManually = async () => {
    // get the Spire.XLS WASM module
    const xlsModule = window.wasmModule?.spirexls;

    // check that the module is ready
    if (!xlsModule) {
      alert('Spire.Xls is not ready yet');
      return;
    }

    // load the font and the test data file into the VFS
    await window.spire.FetchFileToVFS('ARIAL.TTF', '/Library/Fonts/', `${process.env.PUBLIC_URL}/font/`);
    const inputFileName = 'SalesReport.xlsx';
    await window.spire.FetchFileToVFS(inputFileName, '', `${process.env.PUBLIC_URL}data/`);

    // load the workbook
    const workbook = new xlsModule.Workbook();
    workbook.LoadFromFile({ fileName: inputFileName });

    // take the first worksheet
    const sheet = workbook.Worksheets.get(0);

    // add a chart and bind its data range to the main block, A1:C7
    const chart = sheet.Charts.Add();
    chart.DataRange = sheet.Range.get('A1:C7');
    chart.SeriesDataFromRange = false;

    // place the chart
    chart.LeftColumn = 1;
    chart.TopRow = 10;
    chart.RightColumn = 9;
    chart.BottomRow = 26;

    // the two series of the main block: sales as columns, target sales as a line
    chart.Series.get(0).SerieType = xlsModule.ExcelChartType.ColumnClustered;
    chart.Series.get(1).SerieType = xlsModule.ExcelChartType.Line;

    // last year's figures sit in column E, one empty column away from the main block, so they cannot come along with the data range; add a series by hand instead.
    // a hand-added series takes a chart type of its own too; here it is drawn as columns alongside sales
    const lastYear = chart.Series.Add({ name: 'Last Year Sales (K)', serieType: xlsModule.ExcelChartType.ColumnClustered });
    lastYear.CategoryLabels = sheet.Range.get('A2:A7');
    lastYear.Values = sheet.Range.get('E2:E7');

    chart.ChartTitle = 'Sales, Target Sales and Last Year Sales';

    // save the workbook
    const outputFileName = 'AddSeriesManually.xlsx';
    workbook.SaveToFile({ fileName: outputFileName });

    // dispose of the workbook to free resources
    workbook.Dispose();

    // read the result file from the VFS and start the download
    const fileArray = window.dotnetRuntime.Module.FS.readFile(outputFileName);
    const blob = new Blob([fileArray], { type: 'application/vnd.openxmlformats-officedocument.spreadsheetml.sheet' });
    const url = URL.createObjectURL(blob);
    const a = document.createElement('a');
    a.href = url;
    a.download = outputFileName;
    a.click();
    URL.revokeObjectURL(url);
  };

  return (
    <div style={{ textAlign: 'center', height: '300px' }}>
      <h1>Create a Custom (Combination) Chart</h1>
      <button id="add-series-manually" onClick={addSeriesManually}>Add a series by hand</button>
    </div>
  );
}

export default App;
After running, the effect of adding a series by hand: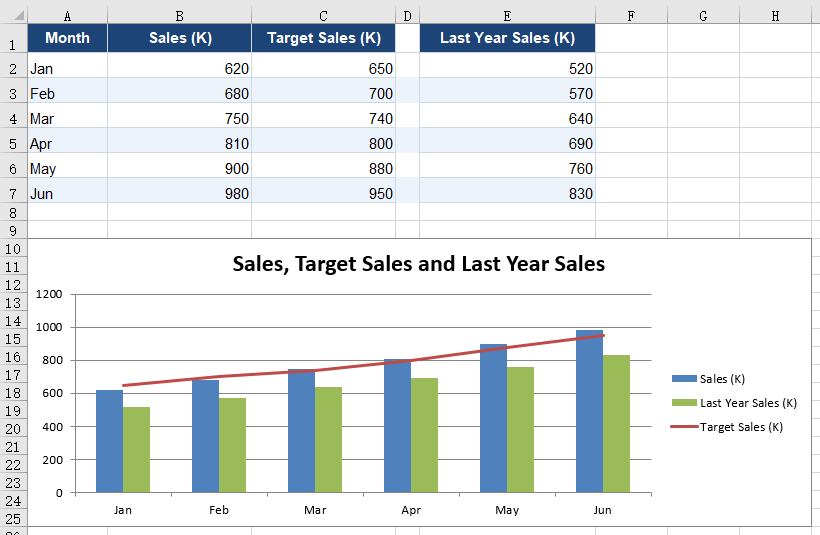
FAQ
Can a hand-added series be used alongside DataRange?
Cause: Yes, and the two do not interfere. DataRange produces only the series that correspond to the columns of the main block; a hand-added series carries its own Values and CategoryLabels, which are unrelated to the range DataRange covers and need not lie within the same rectangle. In the second example above the chart holds both series of the main block and the hand-added last-year series at once.
Solution: Point DataRange at the main block, then add each extra series with chart.Series.Add({ name, serieType }). Note that a hand-added series does not inherit the category labels of the main block: CategoryLabels has to be assigned explicitly, and if it is pointed at the same column the series share one category axis.
// the two series of the main block come from DataRange; the hand-added one is bound separately
chart.DataRange = sheet.Range.get('A1:C7');

const lastYear = chart.Series.Add({ name: 'Last Year Sales (K)', serieType: xlsModule.ExcelChartType.ColumnClustered });
lastYear.CategoryLabels = sheet.Range.get('A2:A7');
lastYear.Values = sheet.Range.get('E2:E7');
What type does a series added without serieType get?
Cause: It takes the chart's own type. sheet.Charts.Add() is called with no arguments in the example, and the chart it builds defaults to ExcelChartType.ColumnClustered, which is the type a new series keeps as well.
Solution: For a new series to join a combination chart, name its type at the call, or change SerieType after adding it:
// named at the call
const serie = chart.Series.Add({ name: 'Last Year Sales (K)', serieType: xlsModule.ExcelChartType.ColumnClustered });

// or changed after adding
serie.SerieType = xlsModule.ExcelChartType.Line;
Get a Free License
Spire.XLS for JavaScript offers a 30-day full-featured free trial license with no functional limitations. Apply here to evaluate before purchasing.
ET is WPS Office's workbook format, and its files carry the .et extension. When workbooks are exchanged between office suites, format compatibility decides whether a file can be opened directly. Spire.XLS for JavaScript converts between Excel and ET both ways in the browser on WebAssembly, keeping the formulas, the merged areas and the number formats of the workbook, and handling input and output files through a virtual file system (VFS) with no backend service.
This article covers two core feature points:
For installation and project setup, see Integrating Spire.XLS for JavaScript in a React Project. The examples below assume Spire.XLS is installed and the WebAssembly module has been initialised.
Convert Excel to ET
Saving an Excel workbook as ET makes the workbook open directly in WPS. The conversion changes only the format the file is saved in: the content of the workbook is unchanged, the target format is named by a fileFormat argument on the way out, and the formulas, the merged areas and the number formats of the cells are all kept. The steps are:
- Load the font and the test data file into the VFS.
- Load the Excel workbook with
workbook.LoadFromFile. - Save the workbook with
workbook.SaveToFile, namingxlsModule.FileFormat.ETas thefileFormat. - Dispose of the workbook with
workbook.Disposeto free resources.
The complete code example below shows how to convert an Excel workbook to ET in React:
function App() {
  const excelToEt = async () => {
    // get the Spire.XLS WASM module
    const xlsModule = window.wasmModule?.spirexls;

    // check that the module is ready
    if (!xlsModule) {
      alert('Spire.Xls is not ready yet');
      return;
    }

    // load the font and the test data file into the VFS
    await window.spire.FetchFileToVFS('ARIAL.TTF', '/Library/Fonts/', `${process.env.PUBLIC_URL}/font/`);
    const inputFileName = 'ProductList.xlsx';
    await window.spire.FetchFileToVFS(inputFileName, '', `${process.env.PUBLIC_URL}data/`);

    // load the workbook
    const workbook = new xlsModule.Workbook();
    workbook.LoadFromFile({ fileName: inputFileName });

    // save as ET; the format is named by fileFormat
    const outputFileName = 'ExcelToEt.et';
    workbook.SaveToFile({ fileName: outputFileName, fileFormat: xlsModule.FileFormat.ET });

    // dispose of the workbook to free resources
    workbook.Dispose();

    // read the result file from the VFS and start the download
    const fileArray = window.dotnetRuntime.Module.FS.readFile(outputFileName);
    const blob = new Blob([fileArray], { type: 'application/vnd.wps-office.et' });
    const url = URL.createObjectURL(blob);
    const a = document.createElement('a');
    a.href = url;
    a.download = outputFileName;
    a.click();
    URL.revokeObjectURL(url);
  };

  return (
    <div style={{ textAlign: 'center', height: '300px' }}>
      <h1>Convert Between Excel and ET in React</h1>
      <button id="excel-to-et" onClick={excelToEt}>Convert Excel to ET</button>
    </div>
  );
}

export default App;
After running, the effect of converting an Excel workbook to an ET file:
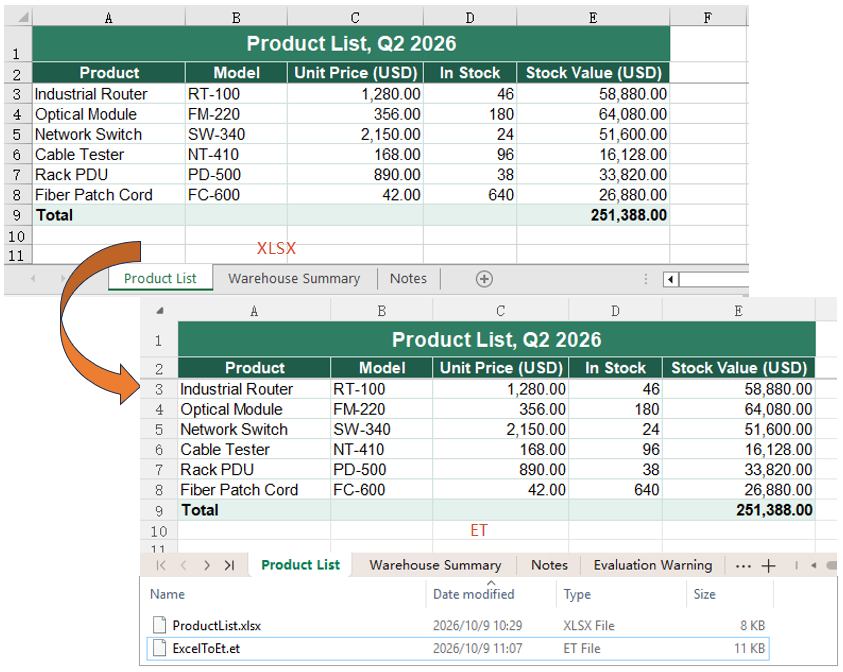
Convert ET to Excel
Converting an ET file to Excel is the same operation in the other direction. ET and Excel hold the same workbook content and differ only in the file format, so loading the ET and writing it out as an Excel version is all it takes. The steps are:
- Load the font and the test data file into the VFS.
- Load the ET file with
workbook.LoadFromFile. - Save it as an Excel workbook with
workbook.SaveToFile, namingxlsModule.FileFormat.Version2010as thefileFormat. - Dispose of the workbook with
workbook.Disposeto free resources.
The complete code example below shows how to convert an ET file back to Excel in React:
function App() {
  const etToExcel = async () => {
    // get the Spire.XLS WASM module
    const xlsModule = window.wasmModule?.spirexls;

    // check that the module is ready
    if (!xlsModule) {
      alert('Spire.Xls is not ready yet');
      return;
    }

    // load the font and the test data file into the VFS
    await window.spire.FetchFileToVFS('ARIAL.TTF', '/Library/Fonts/', `${process.env.PUBLIC_URL}/font/`);
    const inputFileName = 'ProductList.et';
    await window.spire.FetchFileToVFS(inputFileName, '', `${process.env.PUBLIC_URL}data/`);

    // load the workbook
    const workbook = new xlsModule.Workbook();
    workbook.LoadFromFile({ fileName: inputFileName });

    // save as Excel, again naming the version through fileFormat
    const outputFileName = 'EtToExcel.xlsx';
    workbook.SaveToFile({ fileName: outputFileName, fileFormat: xlsModule.FileFormat.Version2010 });

    // dispose of the workbook to free resources
    workbook.Dispose();

    // read the result file from the VFS and start the download
    const fileArray = window.dotnetRuntime.Module.FS.readFile(outputFileName);
    const blob = new Blob([fileArray], { type: 'application/vnd.openxmlformats-officedocument.spreadsheetml.sheet' });
    const url = URL.createObjectURL(blob);
    const a = document.createElement('a');
    a.href = url;
    a.download = outputFileName;
    a.click();
    URL.revokeObjectURL(url);
  };

  return (
    <div style={{ textAlign: 'center', height: '300px' }}>
      <h1>Convert Between Excel and ET in React</h1>
      <button id="et-to-excel" onClick={etToExcel}>Convert ET to Excel</button>
    </div>
  );
}

export default App;
After running, the effect of converting an ET file back to an Excel workbook:
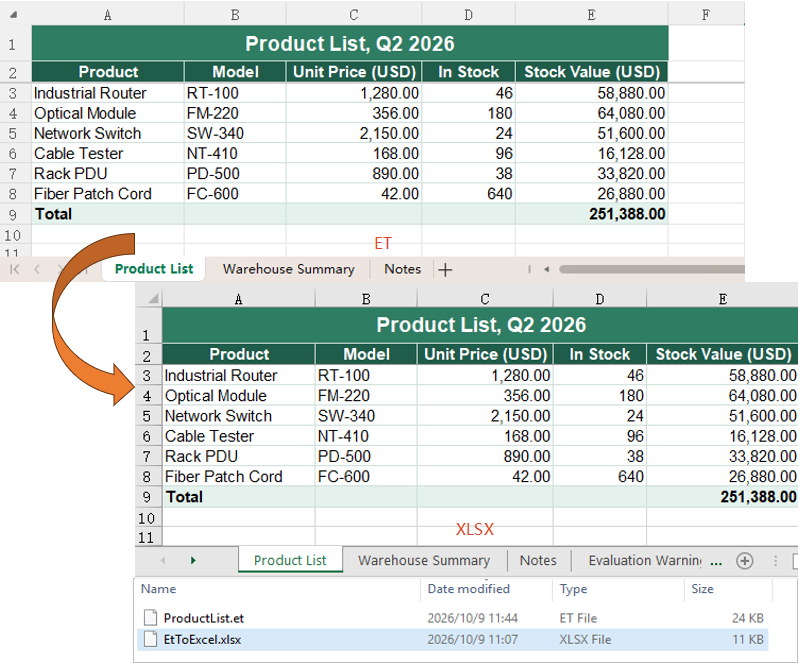
FAQ
Can a file be saved as ET by naming it .et and leaving fileFormat out?
Cause: fileFormat is an optional argument of SaveToFile. When it is not passed, the format is taken from the extension of the output file name, so a name the library recognises determines the format.
Solution: Leaving it out works. Saving a .xlsx with workbook.SaveToFile({ fileName: 'ProductList.et' }) writes an ET file all the same. Writing fileFormat out is still the clearer of the two, and it keeps the output from landing in some other format when the name carries no extension or the wrong one.
Do the formulas in the workbook turn into fixed values after converting to ET?
Cause: ET and Excel carry the same workbook object, and the conversion only changes the format; nothing goes near the contents of the cells.
Solution: The formulas are kept as they are. In this example, reading the ET file that was written back in, the amount cell still has HasFormula set to true, its Formula is still =C3*D3, and FormulaNumberValue gives 58880 as the result; the merged area is still five columns wide, and the #,##0.00 number format is still in place. Formulas, formatting and layout survive the conversion in both directions.
Get a Free License
Spire.XLS for JavaScript offers a 30-day full-featured free trial license with no functional limitations. Apply here to evaluate before purchasing.

JSON is widely used to exchange data between web applications and APIs, but it is not always the most convenient format for reviewing or sharing records. Exporting JSON to Excel turns that data into a worksheet that users can sort, edit, and use in reports.
This tutorial explains how to convert JSON to Excel in a React application using JavaScript and Spire.XLS for JavaScript. It covers both a simple array of employee records and nested JSON that must be flattened before export. You will also learn how to preserve basic data types, format the worksheet, and download the resulting XLSX file in the browser.
Table of Contents:
- Set Up Spire.XLS for JavaScript in React
- Convert a Simple JSON Array to Excel in React
- Convert Nested JSON to Excel in React
- Common Issues and Solutions
- FAQs
- Conclusion
1. Set Up Spire.XLS for JavaScript in React
Spire.XLS for JavaScript provides APIs for creating workbooks, writing cell values, applying styles, and saving Excel files. In this workflow, JavaScript parses and prepares the JSON data, while Spire.XLS builds the Excel workbook.
In your React project, install the package:
npm i spire.office
Copy the corresponding runtime files from the package into your project's public folder: spire.xls.js, Spire.Xls.Wasm.zip, spire.common.js, Spire.Common.Wasm.zip, and the _framework folder. Keep these files from the same package version. For detailed setup instructions, see How to Integrate Spire.XLS for JavaScript in a React Project.
Place the JSON input files in public as well. The examples below use employees.json and employees_nested.json.
The React component loads spire.xls.js inside useEffect() and keeps the initialized module in state. The conversion button remains disabled until initialization completes.
Project configuration: These examples follow the process.env.PUBLIC_URL and webpack-based loading convention in the supplied React component. If your project uses Vite or another build tool, adapt the public asset URL and dynamic import configuration to that environment.
2. Convert a Simple JSON Array to Excel in React
A flat array of objects maps naturally to a worksheet: property names become column headers, and each object becomes one data row.
Prepare the JSON File
Save the following content as public/employees.json:
[
  {
    "employee_id": "E001",
    "name": "Jane Doe",
    "department": "HR",
    "salary": 85000.5,
    "active": true,
    "hire_date": "2022-03-15"
  },
  {
    "employee_id": "E002",
    "name": "Michael Smith",
    "department": "IT",
    "salary": 96000,
    "active": true,
    "hire_date": "2021-07-01"
  },
  {
    "employee_id": "E003",
    "name": "Sara Lin",
    "department": "Finance",
    "salary": 92000.75,
    "active": false,
    "hire_date": "2023-01-12"
  },
  {
    "employee_id": "E004",
    "name": "李伟",
    "department": "Operations",
    "salary": 81500,
    "active": true,
    "hire_date": "2020-11-30"
  },
  {
    "employee_id": "E005",
    "name": "Anna Petrova",
    "department": "Marketing",
    "salary": 78000,
    "active": true,
    "hire_date": "2019-08-19"
  },
  {
    "employee_id": "E006",
    "name": "David Chen",
    "department": null,
    "salary": 0,
    "active": false
  }
]
This example includes strings, numbers, Boolean values, Chinese characters, a null value, and a missing property. These cases illustrate how the export handles different values without losing zero or false.
Convert JSON to Excel
The conversion follows these steps:
- Load the JSON file into the virtual file system (VFS), decode its UTF-8 content, and parse it with
JSON.parse(). - Create a workbook, remove its default worksheets, and add an
Employeesworksheet. - Write the first object's keys into the header row.
- Write each record to a new row, using
NumberValue,BooleanValue, orTextaccording to the JavaScript value type. - Style the headers, estimate column widths from the content, and add thin borders.
- Save the workbook to the VFS, read the generated bytes, and download them as an XLSX file.
Complete React Example
Replace the contents of App.js with the following component:
import React, { useState, useEffect } from 'react';

function App() {
  const [wasmModule, setWasmModule] = useState(null);

  // Load Spire.XLS
  useEffect(() => {
    (async () => {
      try {
        const publicUrl = process.env.PUBLIC_URL || '';
        const spireModule = await import(/* webpackIgnore: true */ `${publicUrl}/spire.xls.js`);
        const rawModule = spireModule.default || spireModule;
        window.wasmModule = typeof rawModule === 'function'
          ? await rawModule({ locateFile: p => p.endsWith('.wasm') ? `${publicUrl}/${p}` : p })
          : rawModule;
        setWasmModule(window.wasmModule);
      } catch (error) {
        console.error('Failed to load spire.xls.js WASM module:', error);
      }
    })();
  }, []);

  // Convert JSON data to an Excel file
  const JsonToExcel = async () => {
    const spirexls = wasmModule?.spirexls;
    if (!spirexls) {
      console.error('Spire.XLS is not initialized.');
      return;
    }

    let workbook;

    try {
      // 1. Load the JSON file into the Virtual File System (VFS)
      const inputFileName = 'employees.json';
      const inputVfsPath = await window.spire.FetchFileToVFS(
        inputFileName,
        '/',
        `${process.env.PUBLIC_URL || ''}/`
      );

      // 2. Read it back as UTF-8 text and parse it into JS objects
      const jsonBytes = window.dotnetRuntime.Module.FS.readFile(inputVfsPath);
      const jsonText = new TextDecoder('utf-8').decode(jsonBytes);
      const data = JSON.parse(jsonText);

      // Guard against empty / invalid input
      if (!Array.isArray(data) || data.length === 0) {
        throw new Error('JSON must be a non-empty array of objects.');
      }

      // 3. Create a new workbook and worksheet
      workbook = new spirexls.Workbook();
      workbook.Worksheets.Clear();
      const sheet = workbook.Worksheets.Add('Employees');

      // 4. Write headers (row 1) from the keys of the first record
      const headers = Object.keys(data[0]);
      headers.forEach((header, col) => {
        const cell = sheet.get(1, col + 1); // 1-based
        cell.Text = header;
        cell.Style.Font.IsBold = true;
        cell.Style.Font.Size = 12;
        cell.Style.Font.Color = spirexls.Color.get_White();
        cell.Style.Color = spirexls.Color.get_DarkBlue();
      });

      // 5. Write data rows (from row 2), keeping the correct cell types
      data.forEach((record, rowIdx) => {
        headers.forEach((key, colIdx) => {
          const cell = sheet.get(rowIdx + 2, colIdx + 1);
          const value = record[key];
          if (typeof value === 'number') {
            cell.NumberValue = value;
          } else if (typeof value === 'boolean') {
            cell.BooleanValue = value;
          } else {
            cell.Text = value == null ? '' : String(value);
          }
        });
      });

      // 6. Set column widths explicitly
      const widths = headers.map((header) => {
        let maxLen = header.length;
        data.forEach(record => {
          const v = record[header];
          maxLen = Math.max(maxLen, v == null ? 0 : String(v).length);
        });
        return Math.min(Math.max(maxLen + 4, 10), 40);
      });
      const columns = sheet.Columns;
      widths.forEach((w, i) => { columns[i].ColumnWidth = w; }); // 0-based

      // 7. Add thin borders to the used range
      const usedRange = sheet.get(1, 1, data.length + 1, headers.length);
      usedRange.Borders.LineStyle = spirexls.LineStyleType.Thin;
      usedRange.Borders.Color = spirexls.Color.get_LightSteelBlue();

      // 8. Save the workbook to the VFS
      const outputFileName = 'employees.xlsx';
      workbook.SaveToFile({
        fileName: outputFileName,
        version: spirexls.ExcelVersion.Version2016
      });

      // 9. Read the saved file, convert to a Blob and trigger download
      const modifiedFileArray = window.dotnetRuntime.Module.FS.readFile(outputFileName);
      const modifiedFile = new Blob([modifiedFileArray], {
        type: 'application/vnd.openxmlformats-officedocument.spreadsheetml.sheet'
      });
      const url = URL.createObjectURL(modifiedFile);
      const a = document.createElement('a');
      a.href = url;
      a.download = outputFileName;
      document.body.appendChild(a);
      a.click();
      document.body.removeChild(a);
      URL.revokeObjectURL(url);

    } catch (error) {
      console.error('Failed to convert JSON to Excel:', error);
    } finally {
      // Clean up resources even when conversion fails part-way through.
      try {
        workbook?.Dispose();
      } catch (cleanupError) {
        console.warn('Failed to dispose workbook:', cleanupError);
      }
    }
  };

  return (
    <div style={{ textAlign: 'center', height: '300px' }}>
      <h1>Convert JSON to Excel Using JavaScript in React</h1>
      <button onClick={JsonToExcel} disabled={!wasmModule}>
        Convert
      </button>
    </div>
  );
}

export default App;
The code uses 1-based row and column indexes for sheet.get(), while the sheet.Columns collection is accessed with a 0-based index. Column widths are estimated from string length and capped at 40; this is a simple sizing rule rather than an exact measurement of rendered text.
Output:
The screenshot below shows the generated employees.xlsx file, with a styled header row and six employee records. Numbers and Boolean values retain their cell types, Chinese characters are preserved, and null or missing values appear as blank cells. Date strings remain in their original YYYY-MM-DD text format.
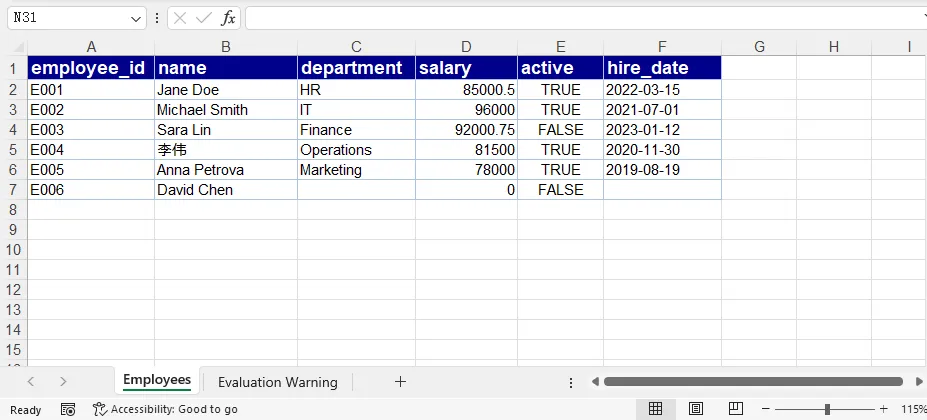
JSON has no native date type, and this code does not convert date strings into Excel dates. Also, the headers come from the first record: properties found only in later records are not included. The next example collects fields across all records to address that limitation.
3. Convert Nested JSON to Excel in React
Nested objects do not map directly to individual worksheet cells. Before exporting them, flatten their properties into a single level and decide how arrays should appear in the worksheet.
For this example, nested object paths become dot-separated column names, and arrays of simple values become comma-separated text. Each employee remains on one row.
Prepare a Nested JSON Example
Save the following content as public/employees_nested.json:
[
  {
    "employee_id": "E001",
    "name": "Jane Doe",
    "salary": 85000.5,
    "active": true,
    "address": {
      "city": "Seattle",
      "country": "USA"
    },
    "skills": ["Recruitment", "Training"]
  },
  {
    "employee_id": "E002",
    "name": "Michael Smith",
    "salary": 96000,
    "active": true,
    "address": {
      "city": "London",
      "country": "UK",
      "postal_code": "SW1A 1AA"
    },
    "skills": ["JavaScript", "React"]
  },
  {
    "employee_id": "E004",
    "name": "李伟",
    "salary": 81500,
    "active": false,
    "address": {
      "city": "Shanghai",
      "country": "China"
    },
    "skills": []
  }
]
The postal_code property appears only in the second employee's address. The export must therefore gather the column names from all flattened records, rather than using only the first one.
Flatten Nested Objects and Handle Arrays
Add these helper functions above function App() in the existing App.js file:
function isRecord(value) {
  return value !== null && typeof value === 'object' && !Array.isArray(value);
}

function flattenRecord(record) {
  // A null-prototype object safely holds arbitrary JSON property names.
  const result = Object.create(null);

  const visit = (value, path) => {
    if (Array.isArray(value)) {
      const containsComplexValues = value.some(
        item => item !== null && typeof item === 'object'
      );

      // Preserve complex arrays as JSON text; join simple arrays for readability.
      result[path] = containsComplexValues
        ? JSON.stringify(value)
        : value.map(item => item == null ? '' : String(item)).join(', ');
    } else if (isRecord(value)) {
      const entries = Object.entries(value);
      if (entries.length === 0 && path) {
        result[path] = '';
      } else {
        entries.forEach(([key, child]) => {
          visit(child, path ? `${path}.${key}` : key);
        });
      }
    } else {
      result[path] = value;
    }
  };

  visit(record, '');
  return result;
}
For the first employee, the resulting object is equivalent to:
{
  "employee_id": "E001",
  "name": "Jane Doe",
  "salary": 85000.5,
  "active": true,
  "address.city": "Seattle",
  "address.country": "USA",
  "skills": "Recruitment, Training"
}
Numbers and Boolean values remain unchanged outside arrays. Empty arrays become empty text. If an array contains objects or other arrays, the helper stores it as JSON text instead of producing an unhelpful [object Object] string.
This dot-separated naming convention assumes that the original property names do not contain dots. If your data includes literal keys such as "address.city", use an escaped path convention or an explicit column mapping to avoid collisions. Array-to-text conversion is intended for readable export, not lossless reconstruction of the original JSON.
Export the Flattened Data to Excel
Keep the module initialization and component layout from the simple example. Replace its JsonToExcel handler with the following handler. It loads the nested JSON file, flattens each record, collects every available field, and exports the resulting table:
const JsonToExcel = async () => {
  const spirexls = wasmModule?.spirexls;
  if (!spirexls) {
    console.error('Spire.XLS is not initialized.');
    return;
  }

  let workbook;

  try {
    // 1. Load and parse the nested JSON file
    const inputVfsPath = await window.spire.FetchFileToVFS(
      'employees_nested.json',
      '/',
      `${process.env.PUBLIC_URL || ''}/`
    );
    const bytes = window.dotnetRuntime.Module.FS.readFile(inputVfsPath);
    const data = JSON.parse(new TextDecoder('utf-8').decode(bytes));

    if (!Array.isArray(data) || data.length === 0 || !data.every(isRecord)) {
      throw new Error('JSON must be a non-empty array of objects.');
    }

    // 2. Flatten records and collect fields from every record
    const flatData = data.map(flattenRecord);
    const headers = [...new Set(flatData.flatMap(record => Object.keys(record)))];
    if (headers.length === 0) {
      throw new Error('JSON records contain no exportable fields.');
    }

    // 3. Create a workbook and worksheet
    workbook = new spirexls.Workbook();
    workbook.Worksheets.Clear();
    const sheet = workbook.Worksheets.Add('Employees');

    // 4. Write and style the headers
    headers.forEach((header, col) => {
      const cell = sheet.get(1, col + 1);
      cell.Text = header;
      cell.Style.Font.IsBold = true;
      cell.Style.Font.Size = 12;
      cell.Style.Font.Color = spirexls.Color.get_White();
      cell.Style.Color = spirexls.Color.get_DarkBlue();
    });

    // 5. Write flattened values, preserving scalar types
    flatData.forEach((record, row) => {
      headers.forEach((key, col) => {
        const cell = sheet.get(row + 2, col + 1);
        const value = record[key];
        if (typeof value === 'number') {
          cell.NumberValue = value;
        } else if (typeof value === 'boolean') {
          cell.BooleanValue = value;
        } else {
          cell.Text = value == null ? '' : String(value);
        }
      });
    });

    // 6. Estimate column widths and add borders
    const columns = sheet.Columns;
    headers.forEach((header, col) => {
      let maxLen = header.length;
      flatData.forEach(record => {
        const value = record[header];
        maxLen = Math.max(maxLen, value == null ? 0 : String(value).length);
      });
      columns[col].ColumnWidth = Math.min(Math.max(maxLen + 4, 10), 40);
    });

    const usedRange = sheet.get(1, 1, flatData.length + 1, headers.length);
    usedRange.Borders.LineStyle = spirexls.LineStyleType.Thin;
    usedRange.Borders.Color = spirexls.Color.get_LightSteelBlue();

    // 7. Save and download the workbook
    const outputFileName = 'employees_nested.xlsx';
    workbook.SaveToFile({
      fileName: outputFileName,
      version: spirexls.ExcelVersion.Version2016
    });

    const outputBytes = window.dotnetRuntime.Module.FS.readFile(outputFileName);
    const blob = new Blob([outputBytes], {
      type: 'application/vnd.openxmlformats-officedocument.spreadsheetml.sheet'
    });
    const url = URL.createObjectURL(blob);
    const link = document.createElement('a');
    link.href = url;
    link.download = outputFileName;
    document.body.appendChild(link);
    link.click();
    link.remove();
    URL.revokeObjectURL(url);

  } catch (error) {
    console.error('Failed to convert nested JSON to Excel:', error);
  } finally {
    try {
      workbook?.Dispose();
    } catch (cleanupError) {
      console.warn('Failed to dispose workbook:', cleanupError);
    }
  }
};
Output:
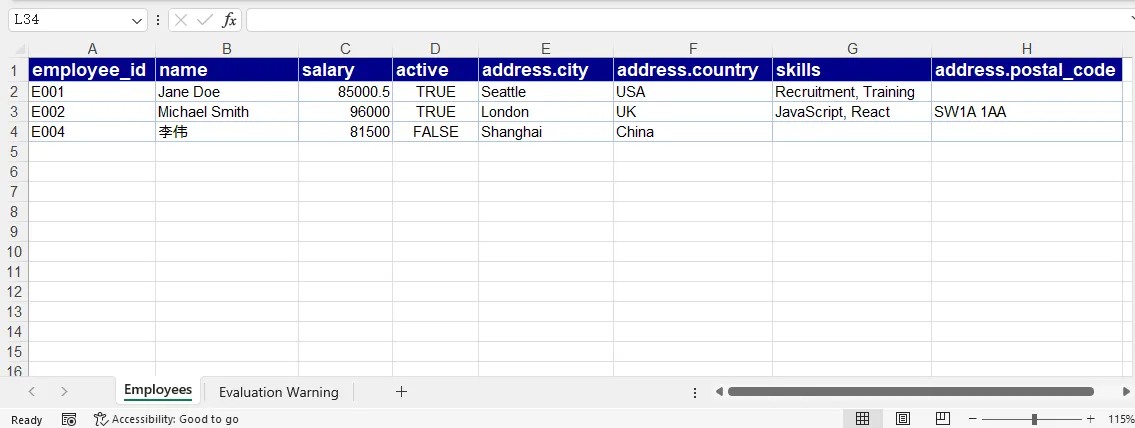
The generated worksheet includes address.city, address.country, and address.postal_code as separate columns. Skills appear as readable text in one cell, and employees without a postal code have an empty cell in that column. Header order follows the first appearance of each field across the records.
For arrays of objects that need to be analyzed as individual items, a separate worksheet or an explicitly defined one-to-many row expansion is usually more useful than storing JSON text. That approach requires deciding which parent fields to repeat and how related records should be linked.
4. Common Issues and Solutions
| Issue | Solution |
|---|---|
| The conversion button stays disabled | Check the browser console and Network panel for module-loading errors. Verify that the runtime files are accessible and come from the same package version. |
| The JSON file cannot be loaded | Confirm that it is in public and that the public URL points to the correct location. An HTML error page returned instead of JSON can also cause a parse error. |
JSON.parse() throws an error |
Check for malformed JSON, comments, trailing commas, or an unexpected response body. |
| Input is empty or has the wrong structure | Provide a non-empty array of objects. For API responses wrapped in an object, select the array property before exporting. |
| Some columns are missing | Collect the union of keys from all records, as shown in the nested example, instead of reading only data[0]. |
A cell contains [object Object] |
Flatten nested objects before writing them, or deliberately serialize complex values with JSON.stringify(). |
| Dates behave like text in Excel | The examples write date strings as text. Add explicit date parsing and Excel date formatting if date calculations are required. |
The simple example validates that the input is a non-empty array but does not verify each member's type. For less predictable input, use the stronger data.every(isRecord) validation from the nested example and reject records with no usable fields.
5. FAQs
Can I convert JSON from an API response to Excel?
Yes. Use fetch() and response.json() to obtain the data, then pass the resulting array through the same worksheet-writing process. If the response has a wrapper such as { "employees": [...] }, select responseData.employees first. Loading a static JSON file into the VFS is not necessary when the data is already available as JavaScript objects.
How do I handle records with different fields?
Build the column list from every record's keys. The nested example uses Set to collect unique field names in their first-seen order. When a record does not contain a column's field, the code writes empty text to that cell.
How can I export nested objects and arrays?
Flatten nested objects into path-based columns, such as address.city. For simple arrays, joining values into one cell keeps each parent record on one row. Arrays of objects can be stored as JSON text, expanded into multiple rows, or exported to a separate worksheet, depending on how users need to work with the data.
Are numbers and Boolean values preserved in Excel?
Yes. These examples assign JavaScript numbers to NumberValue and Boolean values to BooleanValue. Strings remain text, including numeric-looking identifiers and date strings. The null check uses value == null, so valid values such as 0 and false are not replaced with blanks.
6. Conclusion
Converting JSON to Excel in React involves preparing the data, writing it to a worksheet, and downloading the generated workbook. Flat JSON arrays can be exported directly, while nested data needs a defined flattening strategy. With type-aware cell assignments and consistent field collection, both workflows produce readable Excel files for sharing and further analysis.
Set Excel Superscript and Subscript in React with JavaScript
2026-10-08 03:11:46 Written by liu taliaThe number of atoms in a chemical formula, the exponent in a mathematical expression, the square or cube on a unit symbol, the charge at the end of an ion — these characters are set one size smaller and shifted off the baseline, and that is how readers expect to find them. Typed at the same size as the surrounding text, they have to be inferred from context. Excel rich text lets individual characters inside a single cell carry their own formatting, and superscript and subscript are the two forms used most often. Spire.XLS for JavaScript performs this directly in the browser through WebAssembly, managing input and output files with a virtual file system (VFS) and requiring no backend service.
This article covers two key features:
For installation and project setup, see Integrating Spire.XLS for JavaScript in a React Project. The examples below assume Spire.XLS is already installed and the WebAssembly module has been initialized.
Set the Subscript of Text
Superscript and subscript are not whole-cell font properties: RichText.SetFont applies a font to a slice of the text inside a cell rather than to the cell as a whole. Three things have to line up — write the text as a rich-text run, prepare a font that carries the shift, then apply that font to the character range that should move. The steps are as follows:
- Load the font into the VFS.
- Create a workbook and get the first worksheet.
- Write the sample labels, then the chemical formulas with
RichText.Text. - Create a font object with
workbook.CreateFont()and setIsSubscripttotrue. - Apply the font to the digits with
RichText.SetFont(startIndex, endIndex, font), then save the workbook.
Here is a complete code example that sets the subscript of cell text in React:
function App() {
  const setSubscript = async () => {
    // Get the Spire.XLS WASM module
    const xlsModule = window.wasmModule?.spirexls;

    // Check if the module is ready
    if (!xlsModule) {
      alert('Spire.Xls is not ready yet');
      return;
    }

    // Load the font into the VFS
    await window.spire.FetchFileToVFS('ARIAL.TTF', '/Library/Fonts/', `${process.env.PUBLIC_URL}/font/`);

    // Create a new workbook and get the first worksheet
    const workbook = new xlsModule.Workbook();
    const sheet = workbook.Worksheets.get(0);

    // Write the header row and the sample labels
    sheet.Range.get("A1").Text = "Item";
    sheet.Range.get("B1").Text = "Result";
    sheet.Range.get("A2").Text = "Water";
    sheet.Range.get("A3").Text = "Sulfuric acid";

    // Write the chemical formulas
    const waterRange = sheet.Range.get("B2");
    waterRange.RichText.Text = "H2O";
    const acidRange = sheet.Range.get("B3");
    acidRange.RichText.Text = "H2SO4";

    // Create a font and set IsSubscript to true
    const font = workbook.CreateFont();
    font.IsSubscript = true;

    // Apply the subscript font to the digits only: indices start at 0 and the range is inclusive
    waterRange.RichText.SetFont(1, 1, font);
    acidRange.RichText.SetFont(1, 1, font);
    acidRange.RichText.SetFont(4, 4, font);

    // Widen columns A and B so the rich text is fully visible
    sheet.Range.get("A1:A3").ColumnWidth = 18;
    sheet.Range.get("B1:B3").ColumnWidth = 18;

    // Save the workbook
    const outputFileName = "SetSubscript.xlsx";
    workbook.SaveToFile({ fileName: outputFileName });

    // Dispose of the workbook object to free resources
    workbook.Dispose();

    // Read the result file from the VFS and trigger the download
    const fileArray = window.dotnetRuntime.Module.FS.readFile(outputFileName);
    const blob = new Blob([fileArray], { type: 'application/vnd.openxmlformats-officedocument.spreadsheetml.sheet' });
    const url = URL.createObjectURL(blob);
    const a = document.createElement('a');
    a.href = url;
    a.download = outputFileName;
    a.click();
    URL.revokeObjectURL(url);
  };

  return (
    <div style={{ textAlign: 'center', height: '300px' }}>
      <h1>Set Subscript</h1>
      <button onClick={setSubscript}>Start</button>
    </div>
  );
}

export default App;
After running, the effect of setting the subscript of text:
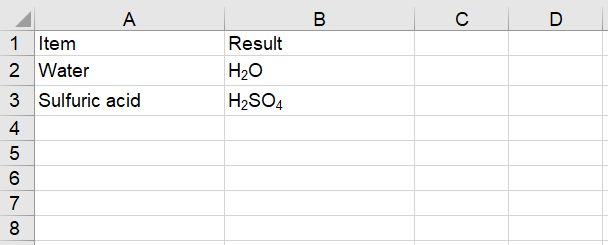
Set the Superscript of Text
Superscript is the mirror image of subscript; the only difference is the direction the font shifts — up rather than down. Superscript suits powers and exponents — the squares in the Pythagorean theorem, the squared cm2 of an area unit, the cubed m3 of a volume unit. A single RichText.SetFont call covers one contiguous range, so text such as a2 + b2 = c2, with three characters to raise, takes three calls. The steps are as follows:
- Load the font into the VFS.
- Create a workbook and get the first worksheet.
- Write the sample labels, then the text that receives the formatting with
RichText.Text. - Create a font object with
workbook.CreateFont()and setIsSuperscripttotrue. - Apply the font to the characters that should be raised with
RichText.SetFont(startIndex, endIndex, font), then save the workbook.
Here is a complete code example that sets the superscript of cell text in React:
function App() {
  const setSuperscript = async () => {
    // Get the Spire.XLS WASM module
    const xlsModule = window.wasmModule?.spirexls;

    // Check if the module is ready
    if (!xlsModule) {
      alert('Spire.Xls is not ready yet');
      return;
    }

    // Load the font into the VFS
    await window.spire.FetchFileToVFS('ARIAL.TTF', '/Library/Fonts/', `${process.env.PUBLIC_URL}/font/`);

    // Create a new workbook and get the first worksheet
    const workbook = new xlsModule.Workbook();
    const sheet = workbook.Worksheets.get(0);

    // Write the header row and the sample labels
    sheet.Range.get("A1").Text = "Item";
    sheet.Range.get("B1").Text = "Result";
    sheet.Range.get("A2").Text = "Pythagorean theorem";
    sheet.Range.get("A3").Text = "Area unit";
    sheet.Range.get("A4").Text = "Volume unit";

    // Write the text that receives the formatting
    const theoremRange = sheet.Range.get("B2");
    theoremRange.RichText.Text = "a2 + b2 = c2";
    const areaRange = sheet.Range.get("B3");
    areaRange.RichText.Text = "cm2";
    const volumeRange = sheet.Range.get("B4");
    volumeRange.RichText.Text = "m3";

    // Create a font and set IsSuperscript to true
    const font = workbook.CreateFont();
    font.IsSuperscript = true;

    // Apply the superscript font to the characters that should be raised
    theoremRange.RichText.SetFont(1, 1, font);
    theoremRange.RichText.SetFont(6, 6, font);
    theoremRange.RichText.SetFont(11, 11, font);
    areaRange.RichText.SetFont(2, 2, font);
    volumeRange.RichText.SetFont(1, 1, font);

    // Widen columns A and B so the rich text is fully visible
    sheet.Range.get("A1:A4").ColumnWidth = 18;
    sheet.Range.get("B1:B4").ColumnWidth = 18;

    // Save the workbook
    const outputFileName = "SetSuperscript.xlsx";
    workbook.SaveToFile({ fileName: outputFileName });

    // Dispose of the workbook object to free resources
    workbook.Dispose();

    // Read the result file from the VFS and trigger the download
    const fileArray = window.dotnetRuntime.Module.FS.readFile(outputFileName);
    const blob = new Blob([fileArray], { type: 'application/vnd.openxmlformats-officedocument.spreadsheetml.sheet' });
    const url = URL.createObjectURL(blob);
    const a = document.createElement('a');
    a.href = url;
    a.download = outputFileName;
    a.click();
    URL.revokeObjectURL(url);
  };

  return (
    <div style={{ textAlign: 'center', height: '300px' }}>
      <h1>Set Superscript</h1>
      <button onClick={setSuperscript}>Start</button>
    </div>
  );
}

export default App;
After running, the effect of setting the superscript of text:
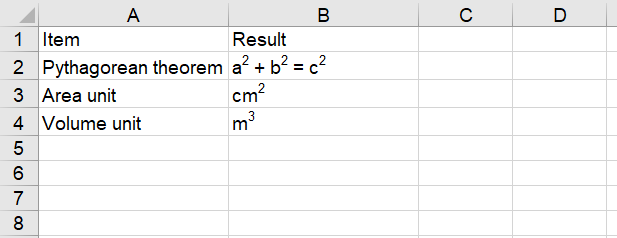
FAQ
How do I remove a superscript or subscript that has already been set?
Cause: Superscript and subscript are formats on individual characters. Calling SetFont again over the same range overwrites those characters with the new font's properties, so applying a font without the shift clears the effect.
Solution: Create a font with IsSubscript or IsSuperscript set to false, and call SetFont over the original range:
// Overwrite the subscript with a plain font
const normal = workbook.CreateFont();
normal.IsSubscript = false;
range.RichText.SetFont(1, 1, normal);
How can I tell whether a character is superscript when reading the file back?
Cause: The shift is a format on the character, not part of the cell's text. Range.Text, Range.Value and RichText.Text all return plain text, so they cannot show which characters carry it.
Solution: Read the font at the character's position and check its superscript and subscript properties. Positions count from 0, the same as with SetFont:
// Read the font at index 1 — the middle "2" in H2O
const font = range.RichText.GetFont(1);
console.log(font.IsSubscript);   // true
console.log(font.IsSuperscript); // false
Get a Free License
Spire.XLS for JavaScript offers a 30-day full-featured free trial license with no functional limitations. Apply here to evaluate before purchasing.
