We have already shown how to use Spire.Presentation to create the bubble chart in C# on the PowerPoint document. This article will demonstrate how to scale the size of bubble chart on the presentation slides in C#. We will use a 3-D bubble chart for example.
Step 1: Create a Presentation instance and load a sample document from the file.
Presentation ppt = new Presentation();
ppt.LoadFromFile("Sample.pptx", FileFormat.Pptx2010);
Step 2: Get the chart from the first presentation slide.
IChart chart = ppt.Slides[0].Shapes[0] as IChart;
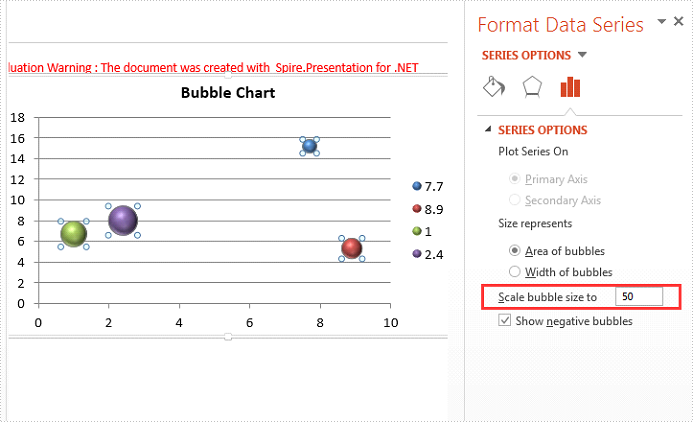
Step 3: Scale the bubble size, the range value is from 0 to 300.
chart.BubbleScale = 50;
Step 4: Save the document to file.
ppt.SaveToFile("Scalesize.pptx", FileFormat.Pptx2010);
Effective screenshot of scale the bubble size:
Full codes:
using Spire.Presentation;
using Spire.Presentation.Charts;

namespace ScaleSize
{
    class Program
    {
        static void Main(string[] args)
        {
            Presentation ppt = new Presentation();
            ppt.LoadFromFile("Sample.pptx", FileFormat.Pptx2010);
            IChart chart = ppt.Slides[0].Shapes[0] as IChart;
            chart.BubbleScale = 50;
            ppt.SaveToFile("Scalesize.pptx", FileFormat.Pptx2010);
        }
    }
}