Tuesday, 06 September 2011 08:03
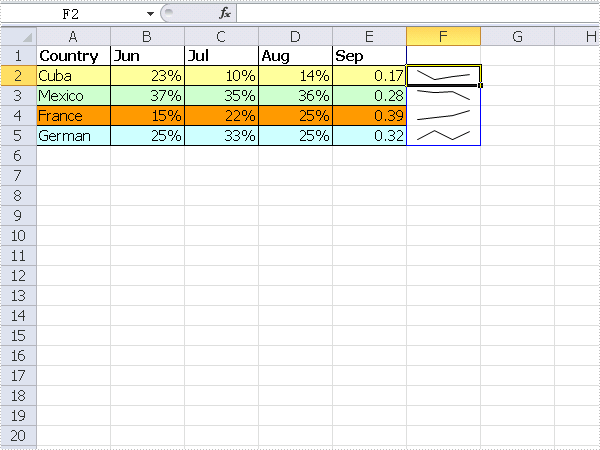
SparkLine Chart
The sample demonstrates how to insert SparkLine into an excel workbook.
using Spire.Xls;
using System.Drawing;

namespace SparkLine
{
    class Program
    {
        static void Main(string[] args)
        {
            Workbook workbook = new Workbook();
            workbook.Version = ExcelVersion.Version2010;
            workbook.CreateEmptySheets(1);

            Worksheet sheet = workbook.Worksheets[0];

            //Country
            sheet.Range["A1"].Value = "Country";
            sheet.Range["A2"].Value = "Cuba";
            sheet.Range["A3"].Value = "Mexico";
            sheet.Range["A4"].Value = "France";
            sheet.Range["A5"].Value = "German";

            //Jun
            sheet.Range["B1"].Value = "Jun";
            sheet.Range["B2"].NumberValue = 0.23;
            sheet.Range["B3"].NumberValue = 0.37;
            sheet.Range["B4"].NumberValue = 0.15;
            sheet.Range["B5"].NumberValue = 0.25;

            //Jul
            sheet.Range["C1"].Value = "Jul";
            sheet.Range["C2"].NumberValue = 0.1;
            sheet.Range["C3"].NumberValue = 0.35;
            sheet.Range["C4"].NumberValue = 0.22;
            sheet.Range["C5"].NumberValue = 0.33;


            //Aug
            sheet.Range["D1"].Value = "Aug";
            sheet.Range["D2"].NumberValue = 0.14;
            sheet.Range["D3"].NumberValue = 0.36;
            sheet.Range["D4"].NumberValue = 0.25;
            sheet.Range["D5"].NumberValue = 0.25;


            //Sep
            sheet.Range["E1"].Value = "Sep";
            sheet.Range["E2"].NumberValue = 0.17;
            sheet.Range["E3"].NumberValue = 0.28;
            sheet.Range["E4"].NumberValue = 0.39;
            sheet.Range["E5"].NumberValue = 0.32;

            //Style
            sheet.Range["A1:E1"].Style.Font.IsBold = true;
            sheet.Range["A2:E2"].Style.KnownColor = ExcelColors.LightYellow;
            sheet.Range["A3:E3"].Style.KnownColor = ExcelColors.LightGreen1;
            sheet.Range["A4:E4"].Style.KnownColor = ExcelColors.LightOrange;
            sheet.Range["A5:E5"].Style.KnownColor = ExcelColors.LightTurquoise;

            //Border
            sheet.Range["A1:E5"].Style.Borders[BordersLineType.EdgeTop].Color = Color.FromArgb(0, 0, 128);
            sheet.Range["A1:E5"].Style.Borders[BordersLineType.EdgeTop].LineStyle = LineStyleType.Thin;
            sheet.Range["A1:E5"].Style.Borders[BordersLineType.EdgeBottom].Color = Color.FromArgb(0, 0, 128);
            sheet.Range["A1:E5"].Style.Borders[BordersLineType.EdgeBottom].LineStyle = LineStyleType.Thin;
            sheet.Range["A1:E5"].Style.Borders[BordersLineType.EdgeLeft].Color = Color.FromArgb(0, 0, 128);
            sheet.Range["A1:E5"].Style.Borders[BordersLineType.EdgeLeft].LineStyle = LineStyleType.Thin;
            sheet.Range["A1:E5"].Style.Borders[BordersLineType.EdgeRight].Color = Color.FromArgb(0, 0, 128);
            sheet.Range["A1:E5"].Style.Borders[BordersLineType.EdgeRight].LineStyle = LineStyleType.Thin;

            sheet.Range["B2:D5"].Style.NumberFormatIndex = 9;

            SparklineGroup sparklineGroup
                = sheet.SparklineGroups.AddGroup(SparklineType.Line);
            SparklineCollection sparklines = sparklineGroup.Add();
            sparklines.Add(sheet["B2:E2"], sheet["F2"]);
            sparklines.Add(sheet["B3:E3"], sheet["F3"]);
            sparklines.Add(sheet["B4:E4"], sheet["F4"]);
            sparklines.Add(sheet["B5:E5"], sheet["F5"]);

            workbook.SaveToFile("Sample.xlsx");
            System.Diagnostics.Process.Start(workbook.FileName);

        }
    }
}
Imports Spire.Xls
Imports System.Drawing
Module Module1
    Sub Main()
        Dim workbook As New Workbook()
        workbook.Version = ExcelVersion.Version2010
        workbook.CreateEmptySheets(1)

        Dim sheet As Worksheet = workbook.Worksheets(0)

        'Country
        sheet.Range("A1").Value = "Country"
        sheet.Range("A2").Value = "Cuba"
        sheet.Range("A3").Value = "Mexico"
        sheet.Range("A4").Value = "France"
        sheet.Range("A5").Value = "German"

        'Jun
        sheet.Range("B1").Value = "Jun"
        sheet.Range("B2").NumberValue = 0.23
        sheet.Range("B3").NumberValue = 0.37
        sheet.Range("B4").NumberValue = 0.15
        sheet.Range("B5").NumberValue = 0.25

        'Jul
        sheet.Range("C1").Value = "Jul"
        sheet.Range("C2").NumberValue = 0.1
        sheet.Range("C3").NumberValue = 0.35
        sheet.Range("C4").NumberValue = 0.22
        sheet.Range("C5").NumberValue = 0.33


        'Aug
        sheet.Range("D1").Value = "Aug"
        sheet.Range("D2").NumberValue = 0.14
        sheet.Range("D3").NumberValue = 0.36
        sheet.Range("D4").NumberValue = 0.25
        sheet.Range("D5").NumberValue = 0.25


        'Sep
        sheet.Range("E1").Value = "Sep"
        sheet.Range("E2").NumberValue = 0.17
        sheet.Range("E3").NumberValue = 0.28
        sheet.Range("E4").NumberValue = 0.39
        sheet.Range("E5").NumberValue = 0.32

        'Style
        sheet.Range("A1:E1").Style.Font.IsBold = True
        sheet.Range("A2:E2").Style.KnownColor = ExcelColors.LightYellow
        sheet.Range("A3:E3").Style.KnownColor = ExcelColors.LightGreen1
        sheet.Range("A4:E4").Style.KnownColor = ExcelColors.LightOrange
        sheet.Range("A5:E5").Style.KnownColor = ExcelColors.LightTurquoise

        'Border
        sheet.Range("A1:E5").Style.Borders(BordersLineType.EdgeTop).Color = Color.FromArgb(0, 0, 128)
        sheet.Range("A1:E5").Style.Borders(BordersLineType.EdgeTop).LineStyle = LineStyleType.Thin
        sheet.Range("A1:E5").Style.Borders(BordersLineType.EdgeBottom).Color = Color.FromArgb(0, 0, 128)
        sheet.Range("A1:E5").Style.Borders(BordersLineType.EdgeBottom).LineStyle = LineStyleType.Thin
        sheet.Range("A1:E5").Style.Borders(BordersLineType.EdgeLeft).Color = Color.FromArgb(0, 0, 128)
        sheet.Range("A1:E5").Style.Borders(BordersLineType.EdgeLeft).LineStyle = LineStyleType.Thin
        sheet.Range("A1:E5").Style.Borders(BordersLineType.EdgeRight).Color = Color.FromArgb(0, 0, 128)
        sheet.Range("A1:E5").Style.Borders(BordersLineType.EdgeRight).LineStyle = LineStyleType.Thin

        sheet.Range("B2:D5").Style.NumberFormatIndex = 9

        Dim sparklineGroup As SparklineGroup = sheet.SparklineGroups.AddGroup(SparklineType.Line)
        Dim sparklines As SparklineCollection = sparklineGroup.Add()
        sparklines.Add(sheet("B2:E2"), sheet("F2"))
        sparklines.Add(sheet("B3:E3"), sheet("F3"))
        sparklines.Add(sheet("B4:E4"), sheet("F4"))
        sparklines.Add(sheet("B5:E5"), sheet("F5"))

        workbook.SaveToFile("Sample.xlsx")
        System.Diagnostics.Process.Start(workbook.FileName)

    End Sub
End Module
Published in
Charts
Sunday, 01 August 2010 16:21
Data Export Bar Chart in C#, VB.NET
Not needing to have Microsoft Excel installed on the machine, The Spire.DataExport can create Excel spreadsheet. This sample demonstrates how to export data table into xls and create bar chart.
private void button1_Click(object sender, EventArgs e)
{
    System.Data.OleDb.OleDbConnection oleDbConnection1
         = new System.Data.OleDb.OleDbConnection();
    oleDbConnection1.ConnectionString
        = @"Provider=Microsoft.Jet.OLEDB.4.0;Data Source=..\..\..\..\Database\demo.mdb";

    System.Data.OleDb.OleDbCommand oleDbCommand1
        = new System.Data.OleDb.OleDbCommand();
    oleDbCommand1.CommandText = "select * from parts";
    oleDbCommand1.Connection = oleDbConnection1;

    System.Data.OleDb.OleDbCommand oleDbCommand2
        = new System.Data.OleDb.OleDbCommand();
    oleDbCommand2.CommandText = "select * from country";
    oleDbCommand2.Connection = oleDbConnection1;

    Spire.DataExport.XLS.CellExport cellExport4
        = new Spire.DataExport.XLS.CellExport();

    Spire.DataExport.XLS.WorkSheet workSheet4 = new Spire.DataExport.XLS.WorkSheet();
    Spire.DataExport.XLS.Chart chart2 = new Spire.DataExport.XLS.Chart();
    Spire.DataExport.XLS.ChartSeries chartSeries2 = new Spire.DataExport.XLS.ChartSeries();
    Spire.DataExport.XLS.WorkSheet workSheet5 = new Spire.DataExport.XLS.WorkSheet();
    Spire.DataExport.XLS.StripStyle stripStyle7 = new Spire.DataExport.XLS.StripStyle();
    Spire.DataExport.XLS.StripStyle stripStyle8 = new Spire.DataExport.XLS.StripStyle();

    cellExport4.ActionAfterExport = Spire.DataExport.Common.ActionType.OpenView;
    cellExport4.AutoFitColWidth = true;
    cellExport4.DataFormats.CultureName = "zh-CN";
    cellExport4.DataFormats.Currency = "¥#,###,##0.00";
    cellExport4.DataFormats.DateTime = "yyyy-M-d H:mm";
    cellExport4.DataFormats.Float = "#,###,##0.00";
    cellExport4.DataFormats.Integer = "#,###,##0";
    cellExport4.DataFormats.Time = "H:mm";
    cellExport4.FileName = "chart2.xls";
    cellExport4.SheetOptions.AggregateFormat.Font.Name = "Arial";
    cellExport4.SheetOptions.CustomDataFormat.Font.Name = "Arial";
    cellExport4.SheetOptions.DefaultFont.Name = "Arial";
    cellExport4.SheetOptions.FooterFormat.Font.Name = "Arial";
    cellExport4.SheetOptions.HeaderFormat.Font.Name = "Arial";
    cellExport4.SheetOptions.HyperlinkFormat.Font.Color = Spire.DataExport.XLS.CellColor.Blue;
    cellExport4.SheetOptions.HyperlinkFormat.Font.Name = "Arial";
    cellExport4.SheetOptions.HyperlinkFormat.Font.Underline = Spire.DataExport.XLS.XlsFontUnderline.Single;
    cellExport4.SheetOptions.NoteFormat.Alignment.Horizontal = Spire.DataExport.XLS.HorizontalAlignment.Left;
    cellExport4.SheetOptions.NoteFormat.Alignment.Vertical = Spire.DataExport.XLS.VerticalAlignment.Top;
    cellExport4.SheetOptions.NoteFormat.Font.Bold = true;
    cellExport4.SheetOptions.NoteFormat.Font.Name = "Tahoma";
    cellExport4.SheetOptions.NoteFormat.Font.Size = 8F;
    cellExport4.SheetOptions.TitlesFormat.Font.Bold = true;
    cellExport4.SheetOptions.TitlesFormat.Font.Name = "Arial";
    chart2.AutoColor = false;
    chart2.CategoryLabels.ColX = ((System.Byte)(1));
    chart2.CategoryLabels.ColY = ((System.Byte)(1));
    chart2.CategoryLabels.RowX = 1;
    chart2.CategoryLabels.RowY = 9;
    chart2.CategoryLabelsColumn = "Name";
    chart2.DataRangeSheet = "Sheet 2";
    chart2.Position.AutoPosition.Height = 23;
    chart2.Position.AutoPosition.Left = 1;
    chart2.Position.AutoPosition.Top = 1;
    chart2.Position.AutoPosition.Width = 11;
    chart2.Position.CustomPosition.X1 = ((System.Byte)(1));
    chart2.Position.CustomPosition.X2 = ((System.Byte)(15));
    chart2.Position.CustomPosition.Y1 = 1;
    chart2.Position.CustomPosition.Y2 = 30;
    chartSeries2.Color = Spire.DataExport.XLS.CellColor.Tan;
    chartSeries2.DataColumn = "Area";
    chartSeries2.DataRangeSheet = "Sheet 2";
    chartSeries2.Title = "Population";
    chart2.Series.Add(chartSeries2);
    chart2.Style = Spire.DataExport.XLS.ChartStyle.Bar;
    chart2.Title = "Chart demo";
    workSheet4.Charts.Add(chart2);
    workSheet4.DataExported = false;
    workSheet4.FormatsExport.CultureName = "zh-CN";
    workSheet4.FormatsExport.Currency = "¥#,###,##0.00";
    workSheet4.FormatsExport.DateTime = "yyyy-M-d H:mm";
    workSheet4.FormatsExport.Float = "#,###,##0.00";
    workSheet4.FormatsExport.Integer = "#,###,##0";
    workSheet4.FormatsExport.Time = "H:mm";
    workSheet4.Options.AggregateFormat.Font.Name = "Arial";
    workSheet4.Options.CustomDataFormat.Font.Name = "Arial";
    workSheet4.Options.DefaultFont.Name = "Arial";
    workSheet4.Options.FooterFormat.Font.Name = "Arial";
    workSheet4.Options.HeaderFormat.Font.Bold = true;
    workSheet4.Options.HeaderFormat.Font.Color = Spire.DataExport.XLS.CellColor.Blue;
    workSheet4.Options.HeaderFormat.Font.Name = "Arial";
    workSheet4.Options.HyperlinkFormat.Font.Color = Spire.DataExport.XLS.CellColor.Blue;
    workSheet4.Options.HyperlinkFormat.Font.Name = "Arial";
    workSheet4.Options.HyperlinkFormat.Font.Underline = Spire.DataExport.XLS.XlsFontUnderline.Single;
    workSheet4.Options.NoteFormat.Alignment.Horizontal = Spire.DataExport.XLS.HorizontalAlignment.Left;
    workSheet4.Options.NoteFormat.Alignment.Vertical = Spire.DataExport.XLS.VerticalAlignment.Top;
    workSheet4.Options.NoteFormat.Font.Bold = true;
    workSheet4.Options.NoteFormat.Font.Name = "Tahoma";
    workSheet4.Options.NoteFormat.Font.Size = 8F;
    workSheet4.Options.TitlesFormat.Font.Bold = true;
    workSheet4.Options.TitlesFormat.Font.Name = "Times New Roman";
    workSheet4.Options.TitlesFormat.Font.Size = 13F;
    workSheet4.SheetName = "charts";
    workSheet4.StartDataCol = ((System.Byte)(0));
    workSheet5.AutoFitColWidth = true;
    workSheet5.FormatsExport.CultureName = "zh-CN";
    workSheet5.FormatsExport.Currency = "¥#,###,##0.00";
    workSheet5.FormatsExport.DateTime = "yyyy-M-d H:mm";
    workSheet5.FormatsExport.Float = "#,###,##0.00";
    workSheet5.FormatsExport.Integer = "#,###,##0";
    workSheet5.FormatsExport.Time = "H:mm";
    stripStyle7.Borders.Bottom.Style = Spire.DataExport.XLS.CellBorderStyle.Medium;
    stripStyle7.Borders.Left.Style = Spire.DataExport.XLS.CellBorderStyle.Medium;
    stripStyle7.Borders.Right.Style = Spire.DataExport.XLS.CellBorderStyle.Medium;
    stripStyle7.Borders.Top.Style = Spire.DataExport.XLS.CellBorderStyle.Medium;
    stripStyle7.FillStyle.Background = Spire.DataExport.XLS.CellColor.LightGreen;
    stripStyle7.FillStyle.Pattern = Spire.DataExport.XLS.Pattern.Solid;
    stripStyle7.Font.Name = "Arial";
    stripStyle8.Borders.Bottom.Style = Spire.DataExport.XLS.CellBorderStyle.Medium;
    stripStyle8.Borders.Left.Style = Spire.DataExport.XLS.CellBorderStyle.Medium;
    stripStyle8.Borders.Right.Style = Spire.DataExport.XLS.CellBorderStyle.Medium;
    stripStyle8.Borders.Top.Style = Spire.DataExport.XLS.CellBorderStyle.Medium;
    stripStyle8.FillStyle.Background = Spire.DataExport.XLS.CellColor.LightTurquoise;
    stripStyle8.FillStyle.Pattern = Spire.DataExport.XLS.Pattern.Solid;
    stripStyle8.Font.Name = "Arial";
    workSheet5.ItemStyles.Add(stripStyle7);
    workSheet5.ItemStyles.Add(stripStyle8);
    workSheet5.ItemType = Spire.DataExport.XLS.CellItemType.Col;
    workSheet5.Options.AggregateFormat.Font.Name = "Arial";
    workSheet5.Options.CustomDataFormat.Font.Name = "Arial";
    workSheet5.Options.DefaultFont.Name = "Arial";
    workSheet5.Options.FooterFormat.Font.Name = "Arial";
    workSheet5.Options.HeaderFormat.Font.Name = "Arial";
    workSheet5.Options.HyperlinkFormat.Font.Color = Spire.DataExport.XLS.CellColor.Blue;
    workSheet5.Options.HyperlinkFormat.Font.Name = "Arial";
    workSheet5.Options.HyperlinkFormat.Font.Underline = Spire.DataExport.XLS.XlsFontUnderline.Single;
    workSheet5.Options.NoteFormat.Alignment.Horizontal = Spire.DataExport.XLS.HorizontalAlignment.Left;
    workSheet5.Options.NoteFormat.Alignment.Vertical = Spire.DataExport.XLS.VerticalAlignment.Top;
    workSheet5.Options.NoteFormat.Font.Bold = true;
    workSheet5.Options.NoteFormat.Font.Name = "Tahoma";
    workSheet5.Options.NoteFormat.Font.Size = 8F;
    workSheet5.Options.TitlesFormat.Borders.Bottom.Style = Spire.DataExport.XLS.CellBorderStyle.Medium;
    workSheet5.Options.TitlesFormat.Borders.Left.Style = Spire.DataExport.XLS.CellBorderStyle.Medium;
    workSheet5.Options.TitlesFormat.Borders.Right.Style = Spire.DataExport.XLS.CellBorderStyle.Medium;
    workSheet5.Options.TitlesFormat.Borders.Top.Style = Spire.DataExport.XLS.CellBorderStyle.Medium;
    workSheet5.Options.TitlesFormat.FillStyle.Background = Spire.DataExport.XLS.CellColor.LightYellow;
    workSheet5.Options.TitlesFormat.FillStyle.Pattern = Spire.DataExport.XLS.Pattern.Solid;
    workSheet5.Options.TitlesFormat.Font.Bold = true;
    workSheet5.Options.TitlesFormat.Font.Name = "Arial";
    workSheet5.SheetName = "Sheet 2";
    workSheet5.SQLCommand = oleDbCommand2;
    workSheet5.StartDataCol = ((System.Byte)(0));
    cellExport4.Sheets.Add(workSheet4);
    cellExport4.Sheets.Add(workSheet5);
    cellExport4.SQLCommand = oleDbCommand1;

    oleDbConnection1.Open();
    try
    {
        cellExport4.SaveToFile();
    }
    finally
    {
        oleDbConnection1.Close();
    }
}
Private Sub Button1_Click(ByVal sender As System.Object, ByVal e As System.EventArgs) Handles Button1.Click
    Dim oleDbConnection1 As New System.Data.OleDb.OleDbConnection()
    oleDbConnection1.ConnectionString = "Provider=Microsoft.Jet.OLEDB.4.0;Data Source=..\..\..\..\Database\demo.mdb"

    Dim oleDbCommand1 As New System.Data.OleDb.OleDbCommand()
    oleDbCommand1.CommandText = "select * from parts"
    oleDbCommand1.Connection = oleDbConnection1

    Dim oleDbCommand2 As New System.Data.OleDb.OleDbCommand()
    oleDbCommand2.CommandText = "select * from country"
    oleDbCommand2.Connection = oleDbConnection1

    Dim cellExport4 As New Spire.DataExport.XLS.CellExport()

    Dim workSheet4 As New Spire.DataExport.XLS.WorkSheet()
    Dim chart2 As New Spire.DataExport.XLS.Chart()
    Dim chartSeries2 As New Spire.DataExport.XLS.ChartSeries()
    Dim workSheet5 As New Spire.DataExport.XLS.WorkSheet()
    Dim stripStyle7 As New Spire.DataExport.XLS.StripStyle()
    Dim stripStyle8 As New Spire.DataExport.XLS.StripStyle()

    cellExport4.ActionAfterExport = Spire.DataExport.Common.ActionType.OpenView
    cellExport4.AutoFitColWidth = True
    cellExport4.DataFormats.CultureName = "zh-CN"
    cellExport4.DataFormats.Currency = "¥#,###,##0.00"
    cellExport4.DataFormats.DateTime = "yyyy-M-d H:mm"
    cellExport4.DataFormats.Float = "#,###,##0.00"
    cellExport4.DataFormats.[Integer] = "#,###,##0"
    cellExport4.DataFormats.Time = "H:mm"
    cellExport4.FileName = "chart2.xls"
    cellExport4.SheetOptions.AggregateFormat.Font.Name = "Arial"
    cellExport4.SheetOptions.CustomDataFormat.Font.Name = "Arial"
    cellExport4.SheetOptions.DefaultFont.Name = "Arial"
    cellExport4.SheetOptions.FooterFormat.Font.Name = "Arial"
    cellExport4.SheetOptions.HeaderFormat.Font.Name = "Arial"
    cellExport4.SheetOptions.HyperlinkFormat.Font.Color = Spire.DataExport.XLS.CellColor.Blue
    cellExport4.SheetOptions.HyperlinkFormat.Font.Name = "Arial"
    cellExport4.SheetOptions.HyperlinkFormat.Font.Underline = Spire.DataExport.XLS.XlsFontUnderline.[Single]
    cellExport4.SheetOptions.NoteFormat.Alignment.Horizontal = Spire.DataExport.XLS.HorizontalAlignment.Left
    cellExport4.SheetOptions.NoteFormat.Alignment.Vertical = Spire.DataExport.XLS.VerticalAlignment.Top
    cellExport4.SheetOptions.NoteFormat.Font.Bold = True
    cellExport4.SheetOptions.NoteFormat.Font.Name = "Tahoma"
    cellExport4.SheetOptions.NoteFormat.Font.Size = 8.0F
    cellExport4.SheetOptions.TitlesFormat.Font.Bold = True
    cellExport4.SheetOptions.TitlesFormat.Font.Name = "Arial"
    chart2.AutoColor = False
    chart2.CategoryLabels.ColX = CByte(1)
    chart2.CategoryLabels.ColY = CByte(1)
    chart2.CategoryLabels.RowX = 1
    chart2.CategoryLabels.RowY = 9
    chart2.CategoryLabelsColumn = "Name"
    chart2.DataRangeSheet = "Sheet 2"
    chart2.Position.AutoPosition.Height = 23
    chart2.Position.AutoPosition.Left = 1
    chart2.Position.AutoPosition.Top = 1
    chart2.Position.AutoPosition.Width = 11
    chart2.Position.CustomPosition.X1 = CByte(1)
    chart2.Position.CustomPosition.X2 = CByte(15)
    chart2.Position.CustomPosition.Y1 = 1
    chart2.Position.CustomPosition.Y2 = 30
    chartSeries2.Color = Spire.DataExport.XLS.CellColor.Tan
    chartSeries2.DataColumn = "Area"
    chartSeries2.DataRangeSheet = "Sheet 2"
    chartSeries2.Title = "Population"
    chart2.Series.Add(chartSeries2)
    chart2.Style = Spire.DataExport.XLS.ChartStyle.Bar
    chart2.Title = "Chart demo"
    workSheet4.Charts.Add(chart2)
    workSheet4.DataExported = False
    workSheet4.FormatsExport.CultureName = "zh-CN"
    workSheet4.FormatsExport.Currency = "¥#,###,##0.00"
    workSheet4.FormatsExport.DateTime = "yyyy-M-d H:mm"
    workSheet4.FormatsExport.Float = "#,###,##0.00"
    workSheet4.FormatsExport.[Integer] = "#,###,##0"
    workSheet4.FormatsExport.Time = "H:mm"
    workSheet4.Options.AggregateFormat.Font.Name = "Arial"
    workSheet4.Options.CustomDataFormat.Font.Name = "Arial"
    workSheet4.Options.DefaultFont.Name = "Arial"
    workSheet4.Options.FooterFormat.Font.Name = "Arial"
    workSheet4.Options.HeaderFormat.Font.Bold = True
    workSheet4.Options.HeaderFormat.Font.Color = Spire.DataExport.XLS.CellColor.Blue
    workSheet4.Options.HeaderFormat.Font.Name = "Arial"
    workSheet4.Options.HyperlinkFormat.Font.Color = Spire.DataExport.XLS.CellColor.Blue
    workSheet4.Options.HyperlinkFormat.Font.Name = "Arial"
    workSheet4.Options.HyperlinkFormat.Font.Underline = Spire.DataExport.XLS.XlsFontUnderline.[Single]
    workSheet4.Options.NoteFormat.Alignment.Horizontal = Spire.DataExport.XLS.HorizontalAlignment.Left
    workSheet4.Options.NoteFormat.Alignment.Vertical = Spire.DataExport.XLS.VerticalAlignment.Top
    workSheet4.Options.NoteFormat.Font.Bold = True
    workSheet4.Options.NoteFormat.Font.Name = "Tahoma"
    workSheet4.Options.NoteFormat.Font.Size = 8.0F
    workSheet4.Options.TitlesFormat.Font.Bold = True
    workSheet4.Options.TitlesFormat.Font.Name = "Times New Roman"
    workSheet4.Options.TitlesFormat.Font.Size = 13.0F
    workSheet4.SheetName = "charts"
    workSheet4.StartDataCol = CByte(0)
    workSheet5.AutoFitColWidth = True
    workSheet5.FormatsExport.CultureName = "zh-CN"
    workSheet5.FormatsExport.Currency = "¥#,###,##0.00"
    workSheet5.FormatsExport.DateTime = "yyyy-M-d H:mm"
    workSheet5.FormatsExport.Float = "#,###,##0.00"
    workSheet5.FormatsExport.[Integer] = "#,###,##0"
    workSheet5.FormatsExport.Time = "H:mm"
    stripStyle7.Borders.Bottom.Style = Spire.DataExport.XLS.CellBorderStyle.Medium
    stripStyle7.Borders.Left.Style = Spire.DataExport.XLS.CellBorderStyle.Medium
    stripStyle7.Borders.Right.Style = Spire.DataExport.XLS.CellBorderStyle.Medium
    stripStyle7.Borders.Top.Style = Spire.DataExport.XLS.CellBorderStyle.Medium
    stripStyle7.FillStyle.Background = Spire.DataExport.XLS.CellColor.LightGreen
    stripStyle7.FillStyle.Pattern = Spire.DataExport.XLS.Pattern.Solid
    stripStyle7.Font.Name = "Arial"
    stripStyle8.Borders.Bottom.Style = Spire.DataExport.XLS.CellBorderStyle.Medium
    stripStyle8.Borders.Left.Style = Spire.DataExport.XLS.CellBorderStyle.Medium
    stripStyle8.Borders.Right.Style = Spire.DataExport.XLS.CellBorderStyle.Medium
    stripStyle8.Borders.Top.Style = Spire.DataExport.XLS.CellBorderStyle.Medium
    stripStyle8.FillStyle.Background = Spire.DataExport.XLS.CellColor.LightTurquoise
    stripStyle8.FillStyle.Pattern = Spire.DataExport.XLS.Pattern.Solid
    stripStyle8.Font.Name = "Arial"
    workSheet5.ItemStyles.Add(stripStyle7)
    workSheet5.ItemStyles.Add(stripStyle8)
    workSheet5.ItemType = Spire.DataExport.XLS.CellItemType.Col
    workSheet5.Options.AggregateFormat.Font.Name = "Arial"
    workSheet5.Options.CustomDataFormat.Font.Name = "Arial"
    workSheet5.Options.DefaultFont.Name = "Arial"
    workSheet5.Options.FooterFormat.Font.Name = "Arial"
    workSheet5.Options.HeaderFormat.Font.Name = "Arial"
    workSheet5.Options.HyperlinkFormat.Font.Color = Spire.DataExport.XLS.CellColor.Blue
    workSheet5.Options.HyperlinkFormat.Font.Name = "Arial"
    workSheet5.Options.HyperlinkFormat.Font.Underline = Spire.DataExport.XLS.XlsFontUnderline.[Single]
    workSheet5.Options.NoteFormat.Alignment.Horizontal = Spire.DataExport.XLS.HorizontalAlignment.Left
    workSheet5.Options.NoteFormat.Alignment.Vertical = Spire.DataExport.XLS.VerticalAlignment.Top
    workSheet5.Options.NoteFormat.Font.Bold = True
    workSheet5.Options.NoteFormat.Font.Name = "Tahoma"
    workSheet5.Options.NoteFormat.Font.Size = 8.0F
    workSheet5.Options.TitlesFormat.Borders.Bottom.Style = Spire.DataExport.XLS.CellBorderStyle.Medium
    workSheet5.Options.TitlesFormat.Borders.Left.Style = Spire.DataExport.XLS.CellBorderStyle.Medium
    workSheet5.Options.TitlesFormat.Borders.Right.Style = Spire.DataExport.XLS.CellBorderStyle.Medium
    workSheet5.Options.TitlesFormat.Borders.Top.Style = Spire.DataExport.XLS.CellBorderStyle.Medium
    workSheet5.Options.TitlesFormat.FillStyle.Background = Spire.DataExport.XLS.CellColor.LightYellow
    workSheet5.Options.TitlesFormat.FillStyle.Pattern = Spire.DataExport.XLS.Pattern.Solid
    workSheet5.Options.TitlesFormat.Font.Bold = True
    workSheet5.Options.TitlesFormat.Font.Name = "Arial"
    workSheet5.SheetName = "Sheet 2"
    workSheet5.SQLCommand = oleDbCommand2
    workSheet5.StartDataCol = CByte(0)
    cellExport4.Sheets.Add(workSheet4)
    cellExport4.Sheets.Add(workSheet5)
    cellExport4.SQLCommand = oleDbCommand1

    oleDbConnection1.Open()
    Try
        cellExport4.SaveToFile()
    Finally
        oleDbConnection1.Close()
    End Try
End Sub
Published in
Cell
Sunday, 01 August 2010 16:02
Data Export Pie3D Chart in C#, VB.NET
Not needing to have Microsoft Excel installed on the machine, The Spire.DataExport can create Excel spreadsheet. This sample demonstrates how to export data table into xls and create pie-3d chart.
private void button1_Click(object sender, EventArgs e)
{
    System.Data.OleDb.OleDbConnection oleDbConnection1
         = new System.Data.OleDb.OleDbConnection();
    oleDbConnection1.ConnectionString
        = @"Provider=Microsoft.Jet.OLEDB.4.0;Data Source=..\..\..\..\Database\demo.mdb";

    System.Data.OleDb.OleDbCommand oleDbCommand1
        = new System.Data.OleDb.OleDbCommand();
    oleDbCommand1.CommandText = "select * from parts";
    oleDbCommand1.Connection = oleDbConnection1;

    System.Data.OleDb.OleDbCommand oleDbCommand2
        = new System.Data.OleDb.OleDbCommand();
    oleDbCommand2.CommandText = "select * from country";
    oleDbCommand2.Connection = oleDbConnection1;

    Spire.DataExport.XLS.CellExport cellExport2
        = new Spire.DataExport.XLS.CellExport();
    Spire.DataExport.XLS.WorkSheet workSheet3 = new Spire.DataExport.XLS.WorkSheet();
    Spire.DataExport.XLS.Chart chart1 = new Spire.DataExport.XLS.Chart();
    Spire.DataExport.XLS.ChartSeries chartSeries1 = new Spire.DataExport.XLS.ChartSeries();
    Spire.DataExport.XLS.StripStyle stripStyle5 = new Spire.DataExport.XLS.StripStyle();
    Spire.DataExport.XLS.StripStyle stripStyle6 = new Spire.DataExport.XLS.StripStyle();

    cellExport2.ActionAfterExport = Spire.DataExport.Common.ActionType.OpenView;
    cellExport2.AutoFitColWidth = true;
    cellExport2.DataFormats.CultureName = "zh-CN";
    cellExport2.DataFormats.Currency = "¥#,###,##0.00";
    cellExport2.DataFormats.DateTime = "yyyy-M-d H:mm";
    cellExport2.DataFormats.Float = "#,###,##0.00";
    cellExport2.DataFormats.Integer = "#,###,##0";
    cellExport2.DataFormats.Time = "H:mm";
    cellExport2.FileName = "chart1.xls";
    cellExport2.SheetOptions.AggregateFormat.Font.Name = "Arial";
    cellExport2.SheetOptions.CustomDataFormat.Font.Name = "Arial";
    cellExport2.SheetOptions.DefaultFont.Name = "Arial";
    cellExport2.SheetOptions.FooterFormat.Font.Name = "Arial";
    cellExport2.SheetOptions.HeaderFormat.Font.Name = "Arial";
    cellExport2.SheetOptions.HyperlinkFormat.Font.Color = Spire.DataExport.XLS.CellColor.Blue;
    cellExport2.SheetOptions.HyperlinkFormat.Font.Name = "Arial";
    cellExport2.SheetOptions.HyperlinkFormat.Font.Underline = Spire.DataExport.XLS.XlsFontUnderline.Single;
    cellExport2.SheetOptions.NoteFormat.Alignment.Horizontal = Spire.DataExport.XLS.HorizontalAlignment.Left;
    cellExport2.SheetOptions.NoteFormat.Alignment.Vertical = Spire.DataExport.XLS.VerticalAlignment.Top;
    cellExport2.SheetOptions.NoteFormat.Font.Bold = true;
    cellExport2.SheetOptions.NoteFormat.Font.Name = "Tahoma";
    cellExport2.SheetOptions.NoteFormat.Font.Size = 8F;
    cellExport2.SheetOptions.TitlesFormat.Font.Bold = true;
    cellExport2.SheetOptions.TitlesFormat.Font.Name = "Arial";
    workSheet3.AutoFitColWidth = true;
    chart1.CategoryLabels.ColX = ((System.Byte)(1));
    chart1.CategoryLabels.ColY = ((System.Byte)(1));
    chart1.CategoryLabels.RowX = 1;
    chart1.CategoryLabels.RowY = 9;
    chart1.CategoryLabelsColumn = "Name";
    chart1.DataRangeSheet = "charts";
    chart1.Position.AutoPosition.Height = 12;
    chart1.Position.AutoPosition.Top = 1;
    chart1.Position.AutoPosition.Width = 6;
    chartSeries1.DataColumn = "Population";
    chartSeries1.DataRangeSheet = "charts";
    chartSeries1.Title = "Population";
    chart1.Series.Add(chartSeries1);
    chart1.Style = Spire.DataExport.XLS.ChartStyle.Pie3d;
    chart1.Title = "Chart demo";
    workSheet3.Charts.Add(chart1);
    workSheet3.FormatsExport.CultureName = "zh-CN";
    workSheet3.FormatsExport.Currency = "¥#,###,##0.00";
    workSheet3.FormatsExport.DateTime = "yyyy-M-d H:mm";
    workSheet3.FormatsExport.Float = "#,###,##0.00";
    workSheet3.FormatsExport.Integer = "#,###,##0";
    workSheet3.FormatsExport.Time = "H:mm";
    stripStyle5.Borders.Bottom.Style = Spire.DataExport.XLS.CellBorderStyle.Medium;
    stripStyle5.Borders.Left.Style = Spire.DataExport.XLS.CellBorderStyle.Medium;
    stripStyle5.Borders.Right.Style = Spire.DataExport.XLS.CellBorderStyle.Medium;
    stripStyle5.Borders.Top.Style = Spire.DataExport.XLS.CellBorderStyle.Medium;
    stripStyle5.FillStyle.Background = Spire.DataExport.XLS.CellColor.LightGreen;
    stripStyle5.FillStyle.Pattern = Spire.DataExport.XLS.Pattern.Solid;
    stripStyle5.Font.Name = "Arial";
    stripStyle6.Borders.Bottom.Style = Spire.DataExport.XLS.CellBorderStyle.Medium;
    stripStyle6.Borders.Left.Style = Spire.DataExport.XLS.CellBorderStyle.Medium;
    stripStyle6.Borders.Right.Style = Spire.DataExport.XLS.CellBorderStyle.Medium;
    stripStyle6.Borders.Top.Style = Spire.DataExport.XLS.CellBorderStyle.Medium;
    stripStyle6.FillStyle.Background = Spire.DataExport.XLS.CellColor.LightTurquoise;
    stripStyle6.FillStyle.Pattern = Spire.DataExport.XLS.Pattern.Solid;
    stripStyle6.Font.Name = "Arial";
    workSheet3.ItemStyles.Add(stripStyle5);
    workSheet3.ItemStyles.Add(stripStyle6);
    workSheet3.ItemType = Spire.DataExport.XLS.CellItemType.Col;
    workSheet3.Options.AggregateFormat.Font.Name = "Arial";
    workSheet3.Options.CustomDataFormat.Font.Name = "Arial";
    workSheet3.Options.DefaultFont.Name = "Arial";
    workSheet3.Options.FooterFormat.Font.Name = "Arial";
    workSheet3.Options.HeaderFormat.Font.Bold = true;
    workSheet3.Options.HeaderFormat.Font.Color = Spire.DataExport.XLS.CellColor.Blue;
    workSheet3.Options.HeaderFormat.Font.Name = "Arial";
    workSheet3.Options.HyperlinkFormat.Font.Color = Spire.DataExport.XLS.CellColor.Blue;
    workSheet3.Options.HyperlinkFormat.Font.Name = "Arial";
    workSheet3.Options.HyperlinkFormat.Font.Underline = Spire.DataExport.XLS.XlsFontUnderline.Single;
    workSheet3.Options.NoteFormat.Alignment.Horizontal = Spire.DataExport.XLS.HorizontalAlignment.Left;
    workSheet3.Options.NoteFormat.Alignment.Vertical = Spire.DataExport.XLS.VerticalAlignment.Top;
    workSheet3.Options.NoteFormat.Font.Bold = true;
    workSheet3.Options.NoteFormat.Font.Name = "Tahoma";
    workSheet3.Options.NoteFormat.Font.Size = 8F;
    workSheet3.Options.TitlesFormat.Borders.Bottom.Style = Spire.DataExport.XLS.CellBorderStyle.Medium;
    workSheet3.Options.TitlesFormat.Borders.Left.Style = Spire.DataExport.XLS.CellBorderStyle.Medium;
    workSheet3.Options.TitlesFormat.Borders.Right.Style = Spire.DataExport.XLS.CellBorderStyle.Medium;
    workSheet3.Options.TitlesFormat.Borders.Top.Style = Spire.DataExport.XLS.CellBorderStyle.Medium;
    workSheet3.Options.TitlesFormat.FillStyle.Background = Spire.DataExport.XLS.CellColor.LightYellow;
    workSheet3.Options.TitlesFormat.FillStyle.Pattern = Spire.DataExport.XLS.Pattern.Solid;
    workSheet3.Options.TitlesFormat.Font.Bold = true;
    workSheet3.Options.TitlesFormat.Font.Name = "Arial";
    workSheet3.SheetName = "charts";
    workSheet3.SQLCommand = oleDbCommand2;
    workSheet3.StartDataCol = ((System.Byte)(0));
    cellExport2.Sheets.Add(workSheet3);
    cellExport2.SQLCommand = oleDbCommand1;

    oleDbConnection1.Open();
    try
    {
        cellExport2.SaveToFile();
    }
    finally
    {
        oleDbConnection1.Close();
    }
}
Private Sub Button1_Click(ByVal sender As System.Object, ByVal e As System.EventArgs) Handles Button1.Click
    Dim oleDbConnection1 As New System.Data.OleDb.OleDbConnection()
    oleDbConnection1.ConnectionString = "Provider=Microsoft.Jet.OLEDB.4.0;Data Source=..\..\..\..\Database\demo.mdb"

    Dim oleDbCommand1 As New System.Data.OleDb.OleDbCommand()
    oleDbCommand1.CommandText = "select * from parts"
    oleDbCommand1.Connection = oleDbConnection1

    Dim oleDbCommand2 As New System.Data.OleDb.OleDbCommand()
    oleDbCommand2.CommandText = "select * from country"
    oleDbCommand2.Connection = oleDbConnection1

    Dim cellExport2 As New Spire.DataExport.XLS.CellExport()
    Dim workSheet3 As New Spire.DataExport.XLS.WorkSheet()
    Dim chart1 As New Spire.DataExport.XLS.Chart()
    Dim chartSeries1 As New Spire.DataExport.XLS.ChartSeries()
    Dim stripStyle5 As New Spire.DataExport.XLS.StripStyle()
    Dim stripStyle6 As New Spire.DataExport.XLS.StripStyle()

    cellExport2.ActionAfterExport = Spire.DataExport.Common.ActionType.OpenView
    cellExport2.AutoFitColWidth = True
    cellExport2.DataFormats.CultureName = "zh-CN"
    cellExport2.DataFormats.Currency = "¥#,###,##0.00"
    cellExport2.DataFormats.DateTime = "yyyy-M-d H:mm"
    cellExport2.DataFormats.Float = "#,###,##0.00"
    cellExport2.DataFormats.[Integer] = "#,###,##0"
    cellExport2.DataFormats.Time = "H:mm"
    cellExport2.FileName = "chart1.xls"
    cellExport2.SheetOptions.AggregateFormat.Font.Name = "Arial"
    cellExport2.SheetOptions.CustomDataFormat.Font.Name = "Arial"
    cellExport2.SheetOptions.DefaultFont.Name = "Arial"
    cellExport2.SheetOptions.FooterFormat.Font.Name = "Arial"
    cellExport2.SheetOptions.HeaderFormat.Font.Name = "Arial"
    cellExport2.SheetOptions.HyperlinkFormat.Font.Color = Spire.DataExport.XLS.CellColor.Blue
    cellExport2.SheetOptions.HyperlinkFormat.Font.Name = "Arial"
    cellExport2.SheetOptions.HyperlinkFormat.Font.Underline = Spire.DataExport.XLS.XlsFontUnderline.[Single]
    cellExport2.SheetOptions.NoteFormat.Alignment.Horizontal = Spire.DataExport.XLS.HorizontalAlignment.Left
    cellExport2.SheetOptions.NoteFormat.Alignment.Vertical = Spire.DataExport.XLS.VerticalAlignment.Top
    cellExport2.SheetOptions.NoteFormat.Font.Bold = True
    cellExport2.SheetOptions.NoteFormat.Font.Name = "Tahoma"
    cellExport2.SheetOptions.NoteFormat.Font.Size = 8.0F
    cellExport2.SheetOptions.TitlesFormat.Font.Bold = True
    cellExport2.SheetOptions.TitlesFormat.Font.Name = "Arial"
    workSheet3.AutoFitColWidth = True
    chart1.CategoryLabels.ColX = CByte(1)
    chart1.CategoryLabels.ColY = CByte(1)
    chart1.CategoryLabels.RowX = 1
    chart1.CategoryLabels.RowY = 9
    chart1.CategoryLabelsColumn = "Name"
    chart1.DataRangeSheet = "charts"
    chart1.Position.AutoPosition.Height = 12
    chart1.Position.AutoPosition.Top = 1
    chart1.Position.AutoPosition.Width = 6
    chartSeries1.DataColumn = "Population"
    chartSeries1.DataRangeSheet = "charts"
    chartSeries1.Title = "Population"
    chart1.Series.Add(chartSeries1)
    chart1.Style = Spire.DataExport.XLS.ChartStyle.Pie3d
    chart1.Title = "Chart demo"
    workSheet3.Charts.Add(chart1)
    workSheet3.FormatsExport.CultureName = "zh-CN"
    workSheet3.FormatsExport.Currency = "¥#,###,##0.00"
    workSheet3.FormatsExport.DateTime = "yyyy-M-d H:mm"
    workSheet3.FormatsExport.Float = "#,###,##0.00"
    workSheet3.FormatsExport.[Integer] = "#,###,##0"
    workSheet3.FormatsExport.Time = "H:mm"
    stripStyle5.Borders.Bottom.Style = Spire.DataExport.XLS.CellBorderStyle.Medium
    stripStyle5.Borders.Left.Style = Spire.DataExport.XLS.CellBorderStyle.Medium
    stripStyle5.Borders.Right.Style = Spire.DataExport.XLS.CellBorderStyle.Medium
    stripStyle5.Borders.Top.Style = Spire.DataExport.XLS.CellBorderStyle.Medium
    stripStyle5.FillStyle.Background = Spire.DataExport.XLS.CellColor.LightGreen
    stripStyle5.FillStyle.Pattern = Spire.DataExport.XLS.Pattern.Solid
    stripStyle5.Font.Name = "Arial"
    stripStyle6.Borders.Bottom.Style = Spire.DataExport.XLS.CellBorderStyle.Medium
    stripStyle6.Borders.Left.Style = Spire.DataExport.XLS.CellBorderStyle.Medium
    stripStyle6.Borders.Right.Style = Spire.DataExport.XLS.CellBorderStyle.Medium
    stripStyle6.Borders.Top.Style = Spire.DataExport.XLS.CellBorderStyle.Medium
    stripStyle6.FillStyle.Background = Spire.DataExport.XLS.CellColor.LightTurquoise
    stripStyle6.FillStyle.Pattern = Spire.DataExport.XLS.Pattern.Solid
    stripStyle6.Font.Name = "Arial"
    workSheet3.ItemStyles.Add(stripStyle5)
    workSheet3.ItemStyles.Add(stripStyle6)
    workSheet3.ItemType = Spire.DataExport.XLS.CellItemType.Col
    workSheet3.Options.AggregateFormat.Font.Name = "Arial"
    workSheet3.Options.CustomDataFormat.Font.Name = "Arial"
    workSheet3.Options.DefaultFont.Name = "Arial"
    workSheet3.Options.FooterFormat.Font.Name = "Arial"
    workSheet3.Options.HeaderFormat.Font.Bold = True
    workSheet3.Options.HeaderFormat.Font.Color = Spire.DataExport.XLS.CellColor.Blue
    workSheet3.Options.HeaderFormat.Font.Name = "Arial"
    workSheet3.Options.HyperlinkFormat.Font.Color = Spire.DataExport.XLS.CellColor.Blue
    workSheet3.Options.HyperlinkFormat.Font.Name = "Arial"
    workSheet3.Options.HyperlinkFormat.Font.Underline = Spire.DataExport.XLS.XlsFontUnderline.[Single]
    workSheet3.Options.NoteFormat.Alignment.Horizontal = Spire.DataExport.XLS.HorizontalAlignment.Left
    workSheet3.Options.NoteFormat.Alignment.Vertical = Spire.DataExport.XLS.VerticalAlignment.Top
    workSheet3.Options.NoteFormat.Font.Bold = True
    workSheet3.Options.NoteFormat.Font.Name = "Tahoma"
    workSheet3.Options.NoteFormat.Font.Size = 8.0F
    workSheet3.Options.TitlesFormat.Borders.Bottom.Style = Spire.DataExport.XLS.CellBorderStyle.Medium
    workSheet3.Options.TitlesFormat.Borders.Left.Style = Spire.DataExport.XLS.CellBorderStyle.Medium
    workSheet3.Options.TitlesFormat.Borders.Right.Style = Spire.DataExport.XLS.CellBorderStyle.Medium
    workSheet3.Options.TitlesFormat.Borders.Top.Style = Spire.DataExport.XLS.CellBorderStyle.Medium
    workSheet3.Options.TitlesFormat.FillStyle.Background = Spire.DataExport.XLS.CellColor.LightYellow
    workSheet3.Options.TitlesFormat.FillStyle.Pattern = Spire.DataExport.XLS.Pattern.Solid
    workSheet3.Options.TitlesFormat.Font.Bold = True
    workSheet3.Options.TitlesFormat.Font.Name = "Arial"
    workSheet3.SheetName = "charts"
    workSheet3.SQLCommand = oleDbCommand2
    workSheet3.StartDataCol = CByte(0)
    cellExport2.Sheets.Add(workSheet3)
    cellExport2.SQLCommand = oleDbCommand1

    oleDbConnection1.Open()
    Try
        cellExport2.SaveToFile()
    Finally
        oleDbConnection1.Close()
    End Try
End Sub
Published in
Cell
Saturday, 03 July 2010 00:30
EXCEL Pie Charts in C#, VB.NET
The sample demonstrates how to create a pie chart in an excel workbook.
		private void btnRun_Click(object sender, System.EventArgs e)
		{
			Workbook workbook = new Workbook();

			//Initialize worksheet
			workbook.CreateEmptySheets(1);
			Worksheet sheet = workbook.Worksheets[0];
			sheet.Name = "Chart data";
			sheet.GridLinesVisible = false;

			//Add a new  chart worsheet to workbook
			Chart chart = null;
			if (checkBox1.Checked)
			{
				chart = sheet.Charts.Add(ExcelChartType.Pie3D);
			}
			else
			{
				chart = sheet.Charts.Add(ExcelChartType.Pie);
			}

			CreateChartData(sheet);
			CreateChart(sheet, chart);

			workbook.SaveToFile("Sample.xls");
			ExcelDocViewer(workbook.FileName);
		}


		private void CreateChart(Worksheet  sheet, Chart chart)
		{
			//Set region of chart data
			chart.DataRange = sheet.Range["B2:B5"];
			chart.SeriesDataFromRange = false;

			//Set position of chart
			chart.LeftColumn = 1;
			chart.TopRow = 6;
			chart.RightColumn = 9;
			chart.BottomRow = 25;


			//Chart title
			chart.ChartTitle = "Sales by year";
			chart.ChartTitleArea.IsBold = true;
			chart.ChartTitleArea.Size = 12;


			Charts.ChartSerie cs = chart.Series[0];
			cs.CategoryLabels = sheet.Range["A2:A5"];
			cs.Values = sheet.Range["B2:B5"];
			cs.DataFormat.ShowActiveValue = true;

		}
		private void CreateChartData(Worksheet sheet)
		{
			//Country
			sheet.Range["A1"].Value = "Year";
			sheet.Range["A2"].Value = "2002";
			sheet.Range["A3"].Value = "2003";
			sheet.Range["A4"].Value = "2004";
			sheet.Range["A5"].Value = "2005";

			//Jun
			sheet.Range["B1"].Value = "Sales";
			sheet.Range["B2"].NumberValue = 4000;
			sheet.Range["B3"].NumberValue = 6000;
			sheet.Range["B4"].NumberValue = 7000;
			sheet.Range["B5"].NumberValue = 8500;


			//Style
			sheet.Range["A1:B1"].Style.Font.IsBold = true;
			sheet.Range["A2:B2"].Style.KnownColor = ExcelColors.LightYellow;
			sheet.Range["A3:B3"].Style.KnownColor = ExcelColors.LightGreen1;
			sheet.Range["A4:B4"].Style.KnownColor = ExcelColors.LightOrange;
			sheet.Range["A5:B5"].Style.KnownColor = ExcelColors.LightTurquoise;

			//Border
			sheet.Range["A1:B5"].Style.Borders[BordersLineType.EdgeTop].Color = Color.FromArgb(0, 0, 128);
			sheet.Range["A1:B5"].Style.Borders[BordersLineType.EdgeTop].LineStyle = LineStyleType.Thin;
			sheet.Range["A1:B5"].Style.Borders[BordersLineType.EdgeBottom].Color = Color.FromArgb(0, 0, 128);
			sheet.Range["A1:B5"].Style.Borders[BordersLineType.EdgeBottom].LineStyle = LineStyleType.Thin;
			sheet.Range["A1:B5"].Style.Borders[BordersLineType.EdgeLeft].Color = Color.FromArgb(0, 0, 128);
			sheet.Range["A1:B5"].Style.Borders[BordersLineType.EdgeLeft].LineStyle = LineStyleType.Thin;
			sheet.Range["A1:B5"].Style.Borders[BordersLineType.EdgeRight].Color = Color.FromArgb(0, 0, 128);
			sheet.Range["A1:B5"].Style.Borders[BordersLineType.EdgeRight].LineStyle = LineStyleType.Thin;

			sheet.Range["B2:C5"].Style.NumberFormat = "\"$\"#,##0";
		}

		private void ExcelDocViewer( string fileName )
		{
			try
			{
				System.Diagnostics.Process.Start(fileName);
			}
			catch{}
		}
		Private Sub btnRun_Click(ByVal sender As Object, ByVal e As System.EventArgs) Handles btnRun.Click
			Dim workbook As Workbook = New Workbook()

			'Initialize worksheet
			workbook.CreateEmptySheets(1)
			Dim sheet As Worksheet = workbook.Worksheets(0)
			sheet.Name = "Chart data"
			sheet.GridLinesVisible = False

			'Add a new  chart worsheet to workbook
			Dim chart As Chart = Nothing
			If checkBox1.Checked Then
				chart = sheet.Charts.Add(ExcelChartType.Pie3D)
			Else
				chart = sheet.Charts.Add(ExcelChartType.Pie)
			End If

			CreateChartData(sheet)
			CreateChart(sheet, chart)

			workbook.SaveToFile("Sample.xls")
			ExcelDocViewer(workbook.FileName)
		End Sub


		Private Sub CreateChart(ByVal sheet As Worksheet, ByVal chart As Chart)
			'Set region of chart data
			chart.DataRange = sheet.Range("B2:B5")
			chart.SeriesDataFromRange = False

			'Set position of chart
			chart.LeftColumn = 1
			chart.TopRow = 6
			chart.RightColumn = 9
			chart.BottomRow = 25


			'Chart title
			chart.ChartTitle = "Sales by year"
			chart.ChartTitleArea.IsBold = True
			chart.ChartTitleArea.Size = 12


			Dim cs As Charts.ChartSerie = chart.Series(0)
			cs.CategoryLabels = sheet.Range("A2:A5")
			cs.Values = sheet.Range("B2:B5")
			cs.DataFormat.ShowActiveValue = True

		End Sub
		Private Sub CreateChartData(ByVal sheet As Worksheet)
			'Country
			sheet.Range("A1").Value = "Year"
			sheet.Range("A2").Value = "2002"
			sheet.Range("A3").Value = "2003"
			sheet.Range("A4").Value = "2004"
			sheet.Range("A5").Value = "2005"

			'Jun
			sheet.Range("B1").Value = "Sales"
			sheet.Range("B2").NumberValue = 4000
			sheet.Range("B3").NumberValue = 6000
			sheet.Range("B4").NumberValue = 7000
			sheet.Range("B5").NumberValue = 8500


			'Style
			sheet.Range("A1:B1").Style.Font.IsBold = True
			sheet.Range("A2:B2").Style.KnownColor = ExcelColors.LightYellow
			sheet.Range("A3:B3").Style.KnownColor = ExcelColors.LightGreen1
			sheet.Range("A4:B4").Style.KnownColor = ExcelColors.LightOrange
			sheet.Range("A5:B5").Style.KnownColor = ExcelColors.LightTurquoise

			'Border
			sheet.Range("A1:B5").Style.Borders(BordersLineType.EdgeTop).Color = Color.FromArgb(0, 0, 128)
			sheet.Range("A1:B5").Style.Borders(BordersLineType.EdgeTop).LineStyle = LineStyleType.Thin
			sheet.Range("A1:B5").Style.Borders(BordersLineType.EdgeBottom).Color = Color.FromArgb(0, 0, 128)
			sheet.Range("A1:B5").Style.Borders(BordersLineType.EdgeBottom).LineStyle = LineStyleType.Thin
			sheet.Range("A1:B5").Style.Borders(BordersLineType.EdgeLeft).Color = Color.FromArgb(0, 0, 128)
			sheet.Range("A1:B5").Style.Borders(BordersLineType.EdgeLeft).LineStyle = LineStyleType.Thin
			sheet.Range("A1:B5").Style.Borders(BordersLineType.EdgeRight).Color = Color.FromArgb(0, 0, 128)
			sheet.Range("A1:B5").Style.Borders(BordersLineType.EdgeRight).LineStyle = LineStyleType.Thin

			sheet.Range("B2:C5").Style.NumberFormat = """$""#,##0"
		End Sub

		Private Sub ExcelDocViewer(ByVal fileName As String)
			Try
				System.Diagnostics.Process.Start(fileName)
			Catch
			End Try
		End Sub
Published in
Charts