How to Filter Excel Pivot Tables with Python: Step-by-Step Guide

Introduction
Pivot Tables in Excel are versatile tools that enable efficient data summarization and analysis. They allow users to explore data, uncover insights, and generate reports dynamically. One of the most powerful features of Pivot Tables is filtering, which lets users focus on specific data subsets without altering the original data structure.
What This Tutorial Covers
This tutorial provides a detailed, step-by-step guide on how to programmatically apply various types of filters to a Pivot Table in Excel using Python with the Spire.XLS for Python library. It covers the following topics:
- Benefits of Filtering Data in Pivot Tables
- Install Python Excel Library – Spire.XLS for Python
- Add Report Filter to Pivot Table
- Apply Row Field Filter in Pivot Table
- Apply Column Field Filter in Pivot Table
- FAQs
- Conclusion
Benefits of Filtering Data in Pivot Tables
Filtering is an essential feature of Pivot Tables that provides the following benefits:
- Enhanced Data Analysis: Quickly focus on specific segments or categories of your data to draw meaningful insights.
- Dynamic Data Updates: Filters automatically adjust to reflect changes when the underlying data is refreshed, keeping your analysis accurate.
- Improved Data Organization: Display only relevant data in your reports without altering or deleting the original dataset, preserving data integrity.
Install Python Excel Library – Spire.XLS for Python
Before working with Pivot Tables in Excel using Python, ensure the Spire.XLS for Python library is installed. The quickest way to do this is using pip, Python’s package manager. Simply run the following command in your terminal or command prompt:
pip install spire.xlsOnce installed, you’re ready to start automating Pivot Table filtering in your Python projects.
Add Report Filter to Pivot Table
A report filter allows you to filter the entire Pivot Table based on a particular field and value. This type of filter is useful when you want to display data for a specific category or item globally across the Pivot Table, without changing the layout.
Steps to Add a Report Filter
- Initialize the Workbook: Create a Workbook object to manage your Excel file.
- Load the Excel File: Use Workbook.LoadFromFile() to load an existing file containing a Pivot Table.
- Access the Worksheet: Use Workbook.Worksheets[] to select the desired worksheet.
- Locate the Pivot Table: Use Worksheet.PivotTables[] to access the specific Pivot Table.
- Define the Report Filter: Create a PivotReportFilter object specifying the field to filter.
- Apply the Report Filter: Add the filter to the Pivot Table using XlsPivotTable.ReportFilters.Add().
- Save the Updated File: Use Workbook.SaveToFile() to save your changes.
Code Example
- Python
from spire.xls import *

# Create an object of the Workbook class
workbook = Workbook()

# Load an existing Excel file containing a Pivot Table
workbook.LoadFromFile("Sample.xlsx")

# Access the first worksheet
sheet = workbook.Worksheets[0]

# Access the first Pivot Table in the worksheet
pt = sheet.PivotTables[0]

# Create a report filter for the field "Product"
reportFilter = PivotReportFilter("Product", True)

# Add the report filter to the pivot table
pt.ReportFilters.Add(reportFilter)

# Save the updated workbook to a new file
workbook.SaveToFile("AddReportFilter.xlsx", FileFormat.Version2016)
workbook.Dispose()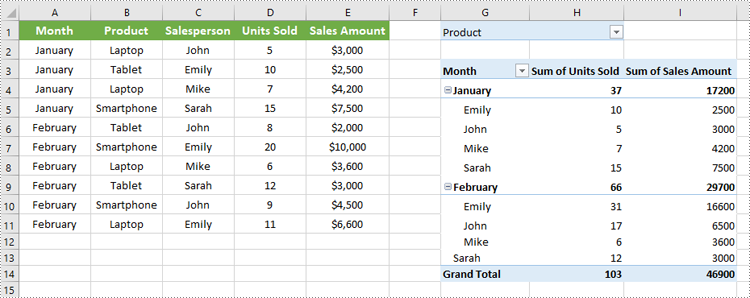
Apply Row Field Filter in Pivot Table
Row field filters allow you to filter data displayed in the row fields of an Excel Pivot Table. These filters can be based on labels (specific text values) or values (numeric criteria).
Steps to Add a Row Field Filter
- Initialize the Workbook: Create a Workbook object to manage the Excel file.
- Load the Excel File: Use Workbook.LoadFromFile() to load your target file containing a Pivot Table.
- Access the Worksheet: Select the desired worksheet using Workbook.Worksheets[].
- Locate the Pivot Table: Access the specific Pivot Table using Worksheet.PivotTables[].
- Add a Row Field Filter: Add a label filter or value filter using
XlsPivotTable.RowFields[].AddLabelFilter() or
XlsPivotTable.RowFields[].AddValueFilter().
- Calculate Pivot Table Data: Use XlsPivotTable.CalculateData() to calculate the pivot table data.
- Save the Updated File: Save your changes using Workbook.SaveToFile().
Code Example
- Python
from spire.xls import *

# Create an object of the Workbook class
workbook = Workbook()

# Load an Excel file
workbook.LoadFromFile("Sample.xlsx")

# Get the first worksheet
sheet = workbook.Worksheets[0]

# Get the first pivot table
pt = sheet.PivotTables[0]

# Add a value filter to the first row field in the pivot table
pt.RowFields[0].AddValueFilter(PivotValueFilterType.GreaterThan, pt.DataFields[0], Int32(5000), None)

# Or add a label filter to the first row field in the pivot table
# pt.RowFields[0].AddLabelFilter(PivotLabelFilterType.Equal, "Mike", None)

# Calculate the pivot table data
pt.CalculateData()

# Save the resulting file
workbook.SaveToFile("AddRowFieldFilter.xlsx", FileFormat.Version2016)
workbook.Dispose()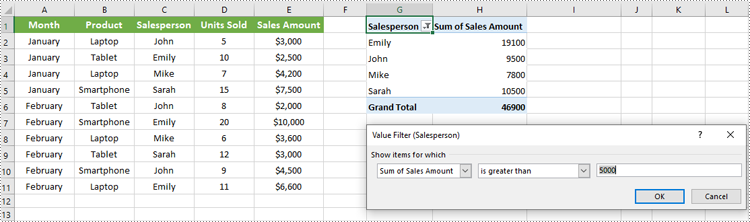
Apply Column Field Filter in Pivot Table
Column field filters in Excel Pivot Tables allow you to filter data displayed in the column fields. Similar to row field filters, column field filters can be based on labels (text values) or values (numeric criteria).
Steps to Add Column Field Filter
- Initialize the Workbook: Create a Workbook object to manage your Excel file.
- Load the Excel File: Use Workbook.LoadFromFile() to open your file containing a Pivot Table.
- Access the Worksheet: Select the target worksheet using Workbook.Worksheets[].
- Locate the Pivot Table: Use Worksheet.PivotTables[] to access the desired Pivot Table.
- Add a Column Field Filter: Add a label filter or value filter using
XlsPivotTable.ColumnFields[].AddLabelFilter() or
XlsPivotTable.ColumnFields[].AddValueFilter().
- Calculate Pivot Table Data: Use XlsPivotTable.CalculateData() to calculate the Pivot Table data.
- Save the Updated File: Save your changes using Workbook.SaveToFile().
Code Example
- Python
from spire.xls import *

# Create an object of the Workbook class
workbook = Workbook()

# Load the Excel file
workbook.LoadFromFile("Sample.xlsx")

# Access the first worksheet
sheet = workbook.Worksheets[0]

# Access the first Pivot Table
pt = sheet.PivotTables[0]

# Add a label filter to the first column field
pt.ColumnFields[0].AddLabelFilter(PivotLabelFilterType.Equal, String("Laptop"), None)

# # Or add a value filter to the first column field
# pt.ColumnFields[0].AddValueFilter(PivotValueFilterType.Between, pt.DataFields[0], Int32(5000), Int32(10000))

# Calculate the pivot table data
pt.CalculateData()

# Save the updated workbook
workbook.SaveToFile("AddColumnFieldFilter.xlsx", FileFormat.Version2016)
workbook.Dispose()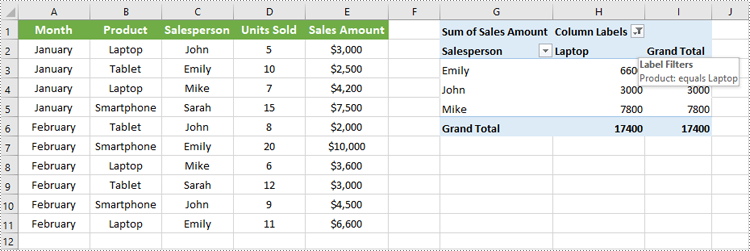
Conclusion
Filtering Pivot Tables in Excel is crucial for effective data analysis, allowing users to zoom in on relevant information without disrupting the table’s structure. Using Spire.XLS for Python, developers can easily automate adding, modifying, and managing filters on Pivot Tables programmatically. This tutorial covered the primary filter types—report filters, row field filters, and column field filters—with detailed code examples to help you get started quickly.
FAQs
Q: Can I add multiple filters to the same Pivot Table?
A: Yes, you can add multiple report filters, row filters, and column filters simultaneously to customize your data views with Spire.XLS.
Q: Do filters update automatically if the source data changes?
A: Yes, after refreshing the Pivot Table or recalculating with CalculateData(), filters will reflect the latest data.
Q: Can I filter based on custom conditions?
A: Spire.XLS supports many filter types including label filters (equals, begins with, contains) and value filters (greater than, less than, between).
Q: Is it possible to remove filters programmatically?
A: Yes, you can remove filters by clearing or resetting the respective filter collections or fields.
Get a Free License
To fully experience the capabilities of Spire.XLS for .NET without any evaluation limitations, you can request a free 30-day trial license.
Python: Create Pivot Charts in Excel
Pivot charts are a powerful tool in Excel that allows you to visualize data from pivot tables in an easy-to-understand format. They enable users to summarize large datasets, highlight trends, and make data-driven decisions through interactive graphs. Whether you're analyzing sales figures, performance metrics, or any other form of data, pivot charts provide a dynamic way to represent complex data visually. In this article, we will demonstrate how to create pivot charts in Excel in Python using Spire.XLS for Python.
- Create Pivot Charts in Excel in Python
- Show or Hide Field Buttons in Pivot Charts in Excel in Python
- Format Pivot Chart Series in Excel in Python
Install Spire.XLS for Python
This scenario requires Spire.XLS for Python and plum-dispatch v1.7.4. They can be easily installed in your Windows through the following pip command.
pip install Spire.XLS
If you are unsure how to install, please refer to this tutorial: How to Install Spire.XLS for Python on Windows
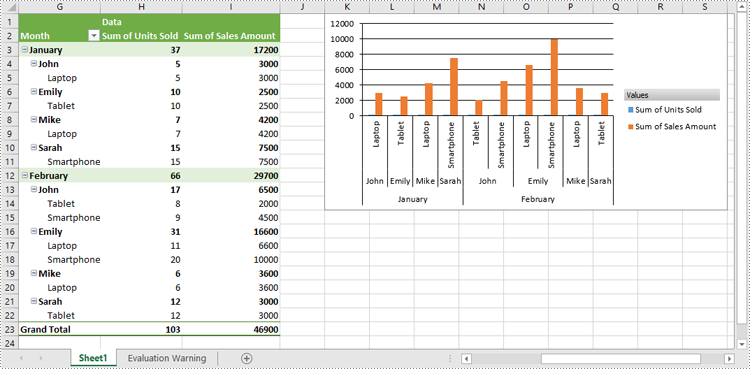
Create Pivot Charts in Excel in Python
Spire.XLS for Python provides the Worksheet.Charts.Add(pivotChartType:ExcelChartType, pivotTable:IPivotTable) method to create a pivot chart based on a specific pivot table in Excel. The detailed steps are as follows:
- Create an object of the Workbook class.
- Load an Excel file using Workbook.LoadFromFile() method.
- Get a specific worksheet in the Excel file using Workbook.Worksheets[index] property.
- Get a specific pivot table in the worksheet using Worksheet.PivotTables[index] property.
- Add a pivot chart based on the pivot table to the worksheet using Worksheet.Charts.Add(pivotChartType:ExcelChartType, pivotTable:IPivotTable) method.
- Set the position and title of the pivot chart.
- Save the resulting file using Workbook.SaveToFile() method.
- Python
from spire.xls import *
from spire.xls.common import *

# Create a Workbook object
workbook = Workbook()
# Load an Excel file
workbook.LoadFromFile("PivotTable.xlsx")

# Get the first worksheet
sheet = workbook.Worksheets[0]

# Get the first pivot table in the worksheet
pivotTable = sheet.PivotTables[0]

# Create a clustered column chart based on the pivot table
pivotChart = sheet.Charts.Add(ExcelChartType.ColumnClustered, pivotTable)
# Set chart position
pivotChart.TopRow = 1
pivotChart.LeftColumn = 11
pivotChart.RightColumn = 20
pivotChart.BottomRow = 15

# Set chart title to null
pivotChart.ChartTitle = ""

# Save the resulting file
workbook.SaveToFile("CreatePivotChart.xlsx", ExcelVersion.Version2013)
workbook.Dispose()
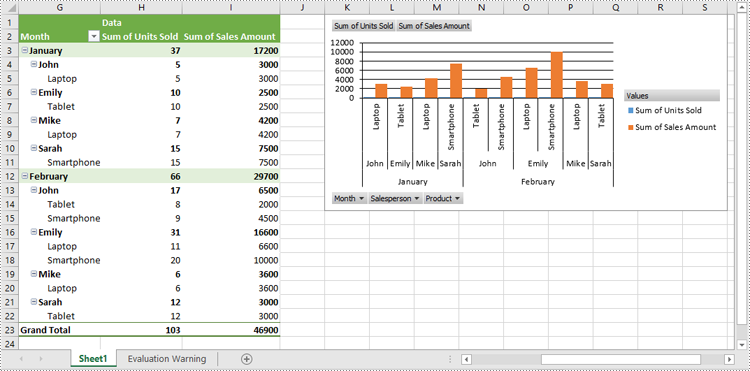
Show or Hide Field Buttons in Pivot Charts in Excel in Python
You can show or hide the following field buttons in a pivot chart with Spire.XLS for Python:
- Entire Field Buttons
- Report Filter Field Buttons
- Legend Field Buttons
- Axis Field Buttons
- Value Field Buttons
The detailed steps are as follows:
- Create an object of the Workbook class.
- Load an Excel file using Workbook.LoadFromFile() method.
- Get a specific worksheet in the Excel file using Workbook.Worksheets[index] property.
- Get a specific pivot table in the worksheet using Worksheet.PivotTables[index] property.
- Add a pivot chart based on the pivot table to the worksheet using Worksheet.Charts.Add(pivotChartType:ExcelChartType, pivotTable:IPivotTable) method.
- Set the position and title of the pivot chart.
- Hide specific field buttons in the pivot chart, such as the axis field buttons and the value field buttons, using Chart.DisplayAxisFieldButtons and Chart.DisplayValueFieldButtons properties.
- Save the resulting file using Workbook.SaveToFile() method.
- Python
from spire.xls import *
from spire.xls.common import *

# Create a Workbook object
workbook = Workbook()
# Load an Excel file
workbook.LoadFromFile("CreatePivotChart.xlsx")

# Get the first worksheet
sheet = workbook.Worksheets[0]

# Get the first pivot table in the worksheet
pivotTable = sheet.PivotTables[0]

# Create a clustered column chart based on the pivot table
pivotChart = sheet.Charts.Add(ExcelChartType.ColumnClustered, pivotTable)
# Set chart position
pivotChart.TopRow = 1
pivotChart.LeftColumn = 11
pivotChart.RightColumn = 20
pivotChart.BottomRow = 15

# Set chart title to null
pivotChart.ChartTitle = ""

# Hide specific field buttons
pivotChart.DisplayAxisFieldButtons = False
pivotChart.DisplayValueFieldButtons = False
# pivotChart.DisplayLegendFieldButtons = False
# pivotChart.ShowReportFilterFieldButtons = False
# pivotChart.DisplayEntireFieldButtons = False

# Save the resulting file
workbook.SaveToFile("HideFieldButtons.xlsx", ExcelVersion.Version2013)
workbook.Dispose()
Format Pivot Chart Series in Excel in Python
When generating a pivot chart using a pivot table as the data source with Spire.XLS for Python, the chart series are not automatically created. You need to add the series to the pivot chart and then apply the desired formatting. The detailed steps are as follows.
- Create an object of the Workbook class.
- Load an Excel file using Workbook.LoadFromFile() method.
- Get a specific worksheet in the Excel file using Workbook.Worksheets[index] property.
- Get a specific pivot table in the worksheet using Worksheet.PivotTables[index] property.
- Add a pivot chart based on the pivot table to the worksheet using Worksheet.Charts.Add(pivotChartType:ExcelChartType, pivotTable:IPivotTable) method.
- Set the position and title of the pivot chart.
- Add series to the chart using Chart.Series.Add() method and then apply the desired formatting to the series.
- Save the resulting file using Workbook.SaveToFile() method.
- Python
from spire.xls import *
from spire.xls.common import *

# Create a Workbook object
workbook = Workbook()
# Load an Excel file
workbook.LoadFromFile("CreatePivotChart.xlsx")

# Get the first worksheet
sheet = workbook.Worksheets[0]

# Get the first pivot table in the worksheet
pivotTable = sheet.PivotTables[0]

# Create a clustered column chart based on the pivot table
pivotChart = sheet.Charts.Add(ExcelChartType.ColumnClustered, pivotTable)
# Set chart position
pivotChart.TopRow = 1
pivotChart.LeftColumn = 11
pivotChart.RightColumn = 20
pivotChart.BottomRow = 15

# Set chart title to null
pivotChart.ChartTitle = ""

# Add chart series
series = pivotChart.Series.Add(ExcelChartType.ColumnClustered)
# Set bar width
series.GetCommonSerieFormat().GapWidth = 10
# Set overlap
# series.GetCommonSerieFormat().Overlap = 100

# Save the resulting file
workbook.SaveToFile("FormatChartSeries.xlsx", ExcelVersion.Version2013)
workbook.Dispose()
Apply for a Temporary License
If you'd like to remove the evaluation message from the generated documents, or to get rid of the function limitations, please request a 30-day trial license for yourself.
Python: Create or Operate Pivot Tables in Excel
Pivot tables provide a flexible way to organize, manipulate, and summarize data from different perspectives, enabling users to gain valuable insights and make informed decisions. With pivot tables, you can easily rearrange and summarize data based on various criteria, such as categories, dates, or numerical values. This feature is particularly useful when dealing with complex datasets or when you need to compare and analyze data from different angles. In this article, you will learn how to create or operate pivot tables in an Excel document using Spire.XLS for Python.
- Create a Pivot Table in Excel in Python
- Sort Pivot Table by Column Values in Python
- Expand or Collapse Rows in Pivot Table in Python
Install Spire.XLS for Python
This scenario requires Spire.XLS for Python and plum-dispatch v1.7.4. They can be easily installed in your Windows through the following pip command.
pip install Spire.XLS
If you are unsure how to install, please refer to this tutorial: How to Install Spire.XLS for Python on Windows
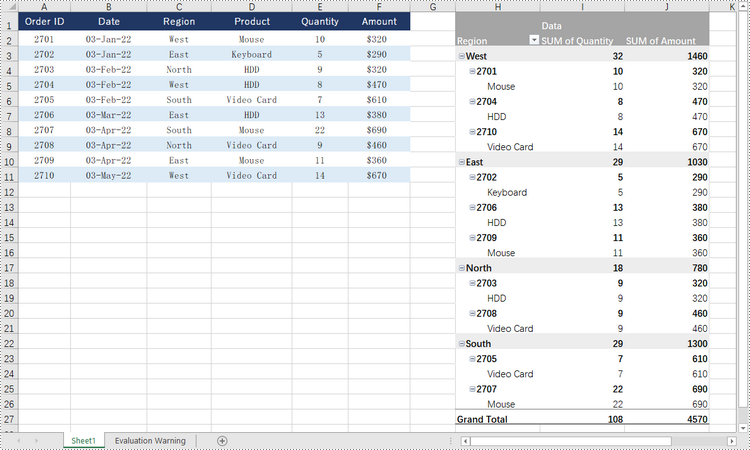
Create a Pivot Table in Excel in Python
Spire.XLS for Python offers the PivotTable class to work with pivot tables in an Excel document. To create a pivot table based on the data in an existing Excel worksheet, follow the steps below.
- Create a Workbook object.
- Load a sample Excel document using Workbook.LoadFromFile() method.
- Get a specified worksheet through Workbook.Worksheets[index] property.
- Specify the range of cells on which the pivot table will be created using Worksheet.Range property
- Create an object of PivotCache using Workbook.PivotCaches.Add() method.
- Add a pivot table to the worksheet using Worksheet.PivotTables.Add() method.
- Add fields to rows area.
- Add fields to values area.
- Save the result document using Workbook.SaveToFile() method.
- Python
from spire.xls import *
from spire.xls.common import *

# Create a Workbook object
workbook = Workbook()

# Load a sample Excel document
workbook.LoadFromFile("C:\\Users\\Administrator\\Desktop\\Data.xlsx")

# Get the first worksheet
sheet = workbook.Worksheets[0]

# Select the data source range
cellRange = sheet.Range["C1:F11"]
piVotCache = workbook.PivotCaches.Add(cellRange)

# Add a PivotTable to the worksheet and set the location and cache of it
pivotTable = sheet.PivotTables.Add("Pivot Table", sheet.Range["H1"], piVotCache)

# Add "Region" and "Product" fields to rows area
regionField = pivotTable.PivotFields["Region"]
regionField.Axis = AxisTypes.Row
pivotTable.Options.RowHeaderCaption = "Region"
productField = pivotTable.PivotFields["Product"]
productField.Axis = AxisTypes.Row

# Add "Quantity" and "Amount" fields to values area
pivotTable.DataFields.Add(pivotTable.PivotFields["Quantity"], "SUM of Quantity", SubtotalTypes.Sum)
pivotTable.DataFields.Add(pivotTable.PivotFields["Amount"], "SUM of Amount", SubtotalTypes.Sum)

# Apply a built-in style to the pivot table
pivotTable.BuiltInStyle = PivotBuiltInStyles.PivotStyleMedium11

# Set column width
sheet.SetColumnWidth(8, 16);
sheet.SetColumnWidth(9, 16);
sheet.SetColumnWidth(10, 16);

# Save the document
workbook.SaveToFile("output/PivotTable.xlsx", ExcelVersion.Version2016)
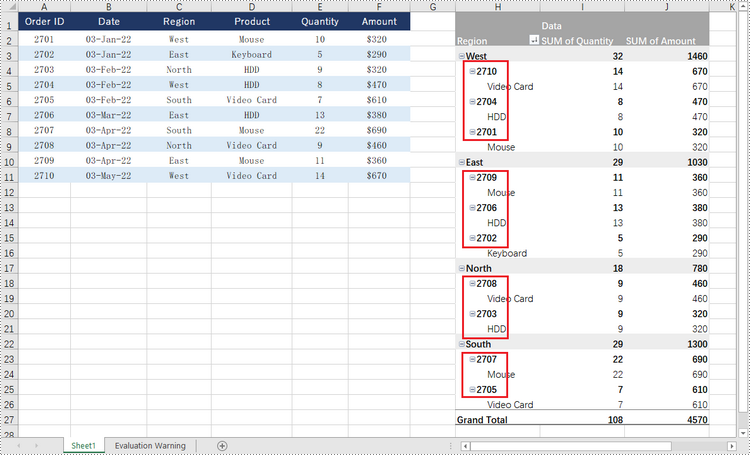
Sort Pivot Table by Column Values in Python
A specific field can be accessed through the PivotTable.PivotFields[index] property, and then you can set its sort type using the PivotField.SortType property. The following are the steps to sort pivot table by the values of a specific field.
- Create a Workbook object.
- Load an Excel document using Workbook.LoadFromFile() method.
- Get a specific worksheet through Workbook.Worksheets[index] property.
- Get a specific pivot table from the worksheet through Worksheet.PivotTables[index] property.
- Get a specific field through PivotTable.PivotFields[fieldName] property.
- Sort data in the field through PivotField.SortType property.
- Save the workbook to a different file using Workbook.SaveToFile() method.
- Python
from spire.xls import *
from spire.xls.common import *

# Create a Workbook object
workbook = Workbook()

# Load an Excel document
workbook.LoadFromFile("C:\\Users\\Administrator\\Desktop\\PivotTable.xlsx");

# Get the first worksheet
sheet = workbook.Worksheets[0]

# Get the specified pivot table
pivotTable = sheet.PivotTables[0]

# Get the specified field
idField = pivotTable.PivotFields["Order ID"]

# Sort data in the column of "Order ID" field
idField.SortType = PivotFieldSortType.Descending

# Save the document
workbook.SaveToFile("output/SortData.xlsx", ExcelVersion.Version2016)
Expand or Collapse Rows in Pivot Table in Python
To collapse the details under a certain pivot field, use PivotField.HideItemDetail(string itemValue, bool isHiddenDetail) method and set the second parameter to true; to show the details, set the second parameter to false. The detailed steps are as follows.
- Create a Workbook object.
- Load an Excel document using Workbook.LoadFromFile() method.
- Get a specific worksheet through Workbook.Worksheets[index] property.
- Get a specific pivot table from the worksheet through Worksheet.PivotTables[index] property.
- Get a specific field through PivotTable.PivotFields[fieldName] property.
- Collapse or expand rows of the field using PivotField.HideItemDetail(string itemValue, bool isHiddenDetail) method.
- Save the workbook to a different file using Workbook.SaveToFile() method.
- Python
from spire.xls import *
from spire.xls.common import *

# Create a Workbook object
workbook = Workbook()

# Load a sample Excel document
workbook.LoadFromFile("C:\\Users\\Administrator\\Desktop\\PivotTable.xlsx");

# Get the first worksheet
sheet = workbook.Worksheets[0]

# Get the specified pivot table
pivotTable = sheet.PivotTables[0]

# Get the specified field
regoinField = pivotTable.PivotFields["Region"]

# Hide details under the selected item of the region
regoinField.HideItemDetail("West", True)
regoinField.HideItemDetail("East", True)

# Save the document
workbook.SaveToFile("output/CollapseRows.xlsx", ExcelVersion.Version2016)
Apply for a Temporary License
If you'd like to remove the evaluation message from the generated documents, or to get rid of the function limitations, please request a 30-day trial license for yourself.