Chart (13)
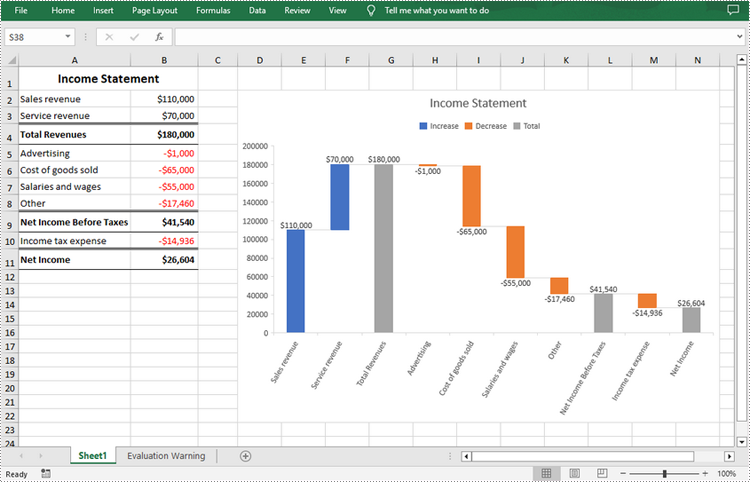
A waterfall chart, also called a bridge chart or a cascade chart, is one of the most visually descriptive charts in Excel. It shows the cumulative effect of positive and negative contributions over a period of time, which is useful in many scenarios where quantitative analysis is required, such as visualizing profit and loss statements, showing budget changes in a project, or monitoring shop inventories. In this article, you will learn how to create a waterfall chart in Excel in Java using Spire.XLS for Java.
Install Spire.XLS for Java
First of all, you're required to add the Spire.Xls.jar file as a dependency in your Java program. The JAR file can be downloaded from this link. If you use Maven, you can easily import the JAR file in your application by adding the following code to your project's pom.xml file.
<repositories>
    <repository>
        <id>com.e-iceblue</id>
        <name>e-iceblue</name>
        <url>https://repo.e-iceblue.com/nexus/content/groups/public/</url>
    </repository>
</repositories>
<dependencies>
    <dependency>
        <groupId>e-iceblue</groupId>
        <artifactId>spire.xls</artifactId>
        <version>16.6.5</version>
    </dependency>
</dependencies>
Create a Waterfall Chart in Excel in Java
Waterfall charts are ideal for analyzing financial statements. To create a waterfall chart, you could first add a chart to a specified worksheet using Worksheet.getCharts().add() method, and then set the chart type to Waterfall using Chart.setChartType(ExcelChartType.WaterFall) method. The following are the detailed steps.
- Create a Workbook instance.
- Load a sample Excel document using Workbook.loadFromFile() method.
- Get a specified worksheet by its index using Workbook.getWorksheets().get() method.
- Add a chart to the worksheet Worksheet.getCharts().add() method, and then set the chart type to waterfall using Chart.setChartType(ExcelChartType.WaterFall) method.
- Set data range for the chart using Chart.setDataRange() method.
- Set position and title of the chart.
- Get a specified data series of the chart, and then set specific data points in the chart as totals or subtotals using ChartSerie.getDataPoints().get().setAsTotal() method.
- Show the connector lines between data points using ChartSerie.getFormat().showConnectorLines(true) method.
- Show data labels for data points, and set the legend position of the chart.
- Save the result document using Workbook.saveToFile() method.
- Java
import com.spire.xls.*;

public class WaterfallChart {
    public static void main(String []args){
        //Create a Workbook object
        Workbook workbook=new Workbook();

        //Load a sample Excel document
        workbook.loadFromFile("data.xlsx");

        //Get the first worksheet
        Worksheet sheet=workbook.getWorksheets().get(0);

        //Add a waterfall chart to the worksheet
        Chart chart=sheet.getCharts().add();
        chart.setChartType(ExcelChartType.WaterFall);

        //Set data range for the chart
        chart.setDataRange(sheet.getRange().get("A2:B11"));

        //Set position of the chart
        chart.setLeftColumn(4);
        chart.setTopRow(2);
        chart.setRightColumn(15);
        chart.setBottomRow(23);

        //Set chart title
        chart.setChartTitle("Income Statement");

        //Set specific data points in the chart as totals or subtotals
        chart.getSeries().get(0).getDataPoints().get(2).setAsTotal(true);
        chart.getSeries().get(0).getDataPoints().get(7).setAsTotal(true);
        chart.getSeries().get(0).getDataPoints().get(9).setAsTotal(true);

        //Show the connector lines between data points
        chart.getSeries().get(0).getFormat().showConnectorLines(true);

        //Show data labels for data points
        chart.getSeries().get(0).getDataPoints().getDefaultDataPoint().getDataLabels().hasValue(true);
        chart.getSeries().get(0).getDataPoints().getDefaultDataPoint().getDataLabels().setSize(8);

        //Set the legend position of the chart
        chart.getLegend().setPosition(LegendPositionType.Top);

        //Save the result document
        workbook.saveToFile("WaterfallChart.xlsx",FileFormat.Version2016);
    }
}
Apply for a Temporary License
If you'd like to remove the evaluation message from the generated documents, or to get rid of the function limitations, please request a 30-day trial license for yourself.
A bar chart is a type of graph that represents or summarizes data in the form of horizontal rectangular bars of equal width but different lengths. In MS Excel, the bar chart is a great tool to compare data among different groups, which helps users to analyze data and draw conclusions quickly. In this article, you will learn how to programmatically create a clustered bar chart or a stacked bar chart in an Excel worksheet using Spire.XLS for Java.
Install Spire.XLS for Java
First of all, you're required to add the Spire.Xls.jar file as a dependency in your Java program. The JAR file can be downloaded from this link. If you use Maven, you can easily import the JAR file in your application by adding the following code to your project's pom.xml file.
<repositories>
    <repository>
        <id>com.e-iceblue</id>
        <name>e-iceblue</name>
        <url>https://repo.e-iceblue.com/nexus/content/groups/public/</url>
    </repository>
</repositories>
<dependencies>
    <dependency>
        <groupId>e-iceblue</groupId>
        <artifactId>spire.xls</artifactId>
        <version>16.6.5</version>
    </dependency>
</dependencies>
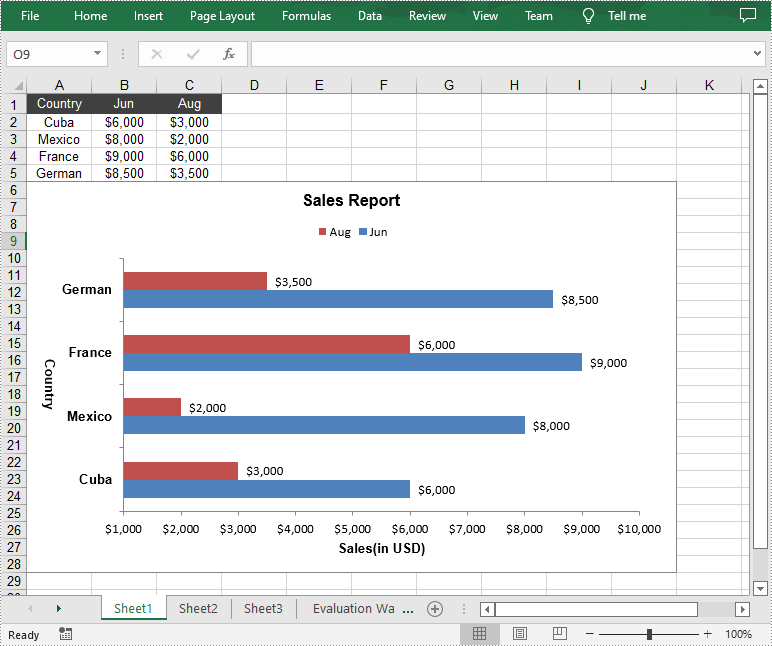
Create a Clustered Bar Chart in Excel
In clustered bar chart, data values of different series are displayed in separate bars side-by-side, which allows a direct comparison of multiple data series per category. The following are the detailed steps to create a clustered bar chart in an Excel worksheet.
- Create an instance of Workbook class.
- Get a specified worksheet by its index using Workbook.getWorksheets().get() method.
- Add some data to specified cells and set the cell styles.
- Add a 2D clustered bar chart to the specified worksheet using Worksheet.getCharts().add(ExcelChartType.BarClustered) method.
- Set data range for the chart using Chart.setDataRange(CellRange dataRange) method.
- Set the position and title of the chart.
- Get the primary category axis of the chart using Chart.getPrimaryCategoryAxis() method, and then set the display text and title of the category axis using the methods under ChartCategoryAxis class.
- Get the primary value axis of the chart using Chart.getPrimaryValueAxis() method, and then set the title, minimum value and major gridlines of the value axis using the methods under ChartValueAxis class.
- Loop through the data series of the chart, and then show data labels for the data points of each data series by setting the value of ChartSerie.getDataPoints().getDefaultDataPoint().getDataLabels().hasValue() method to true.
- Set the position of chart legend using Chart.getLegend().setPosition() method.
- Save the result file using Workbook.saveToFile() method.
- Java
import com.spire.xls.*;
import com.spire.xls.charts.ChartSerie;
import com.spire.xls.charts.ChartSeries;

import java.awt.*;

public class CreateBarChart {

    public static void main(String[] args) {

        //Create an instance of Workbook class
        Workbook workbook = new Workbook();

        //Get the first worksheet
        Worksheet sheet = workbook.getWorksheets().get(0);

        //Insert data to specified cells
        sheet.getCellRange("A1").setValue("Country");
        sheet.getCellRange("A2").setValue("Cuba");
        sheet.getCellRange("A3").setValue("Mexico");
        sheet.getCellRange("A4").setValue("France");
        sheet.getCellRange("A5").setValue("German");

        sheet.getCellRange("B1").setValue("Jun");
        sheet.getCellRange("B2").setNumberValue(6000);
        sheet.getCellRange("B3").setNumberValue(8000);
        sheet.getCellRange("B4").setNumberValue(9000);
        sheet.getCellRange("B5").setNumberValue(8500);

        sheet.getCellRange("C1").setValue("Aug");
        sheet.getCellRange("C2").setNumberValue(3000);
        sheet.getCellRange("C3").setNumberValue(2000);
        sheet.getCellRange("C4").setNumberValue(6000);
        sheet.getCellRange("C5").setNumberValue(3500);

        //Set cell styles
        sheet.getCellRange("A1:C1").setRowHeight(15);
        sheet.getCellRange("A1:C1").getCellStyle().setColor(Color.darkGray);
        sheet.getCellRange("A1:C1").getCellStyle().getExcelFont().setColor(Color.white);
        sheet.getCellRange("A1:C5").getCellStyle().setVerticalAlignment(VerticalAlignType.Center);
        sheet.getCellRange("A1:C5").getCellStyle().setHorizontalAlignment(HorizontalAlignType.Center);

        //Set number format
        sheet.getCellRange("B2:C5").getCellStyle().setNumberFormat("\"$\"#,##0");

        //Add a clustered bar chart to the worksheet
        Chart chart = sheet.getCharts().add(ExcelChartType.BarClustered);

        //Set data range for the chart
        chart.setDataRange(sheet.getCellRange("A1:C5"));
        chart.setSeriesDataFromRange(false);

        //Set position of the chart
        chart.setLeftColumn(1);
        chart.setTopRow(6);
        chart.setRightColumn(11);
        chart.setBottomRow(29);

        //Set and format chart title
        chart.setChartTitle("Sales Report");
        chart.getChartTitleArea().isBold(true);
        chart.getChartTitleArea().setSize(12);

        //Set and format category axis title
        chart.getPrimaryCategoryAxis().setTitle("Country");
        chart.getPrimaryCategoryAxis().getFont().isBold(true);
        chart.getPrimaryCategoryAxis().getTitleArea().isBold(true);
        chart.getPrimaryCategoryAxis().getTitleArea().setTextRotationAngle(90);

        //Set and format value axis title
        chart.getPrimaryValueAxis().setTitle("Sales(in USD)");
        chart.getPrimaryValueAxis().hasMajorGridLines(false);
        chart.getPrimaryValueAxis().setMinValue(1000);
        chart.getPrimaryValueAxis().getTitleArea().isBold(true);

        //Show data labels for data points
        ChartSeries series = chart.getSeries();
        for (int i = 0;i < series.size();i++)
        {
            ChartSerie cs = series.get(i);
            cs.getFormat().getOptions().isVaryColor(true);
            cs.getDataPoints().getDefaultDataPoint().getDataLabels().hasValue(true);
        }

        //Set position of chart legend
        chart.getLegend().setPosition(LegendPositionType.Top);

        //Save the result file
        workbook.saveToFile("CreateBarChart.xlsx", ExcelVersion.Version2016);
    }
}
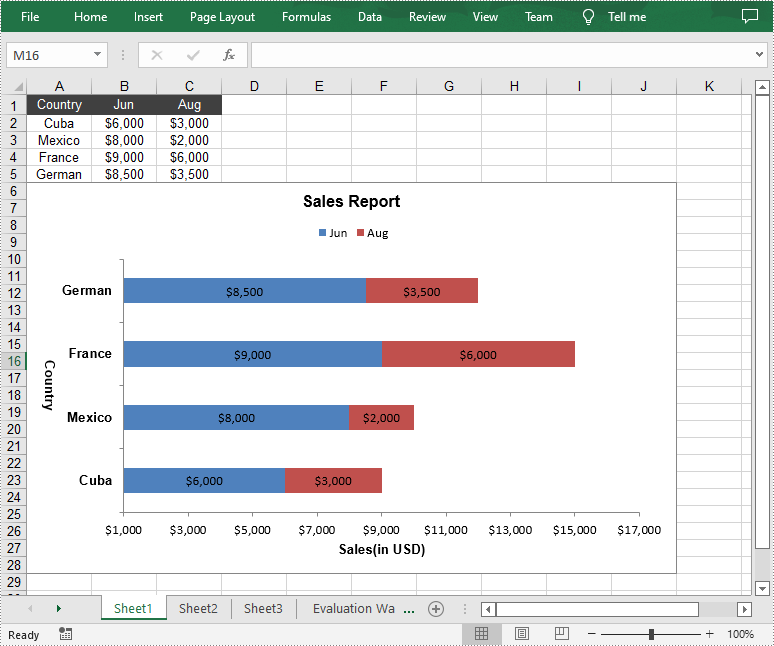
Create a Stacked Bar Chart in Excel
In stacked bar chart, data values of different series are stacked one over the other in a single bar. Compared with the clustered bar chart, the stacked bar chart provides a clearer view of part-to-whole comparison in each category. The following are the detailed steps to create a stacked bar chart in an Excel worksheet.
- Create an instance of Workbook class.
- Get a specified worksheet by its index using Workbook.getWorksheets().get() method.
- Add some data to specified cells and set the cell styles.
- Add a 2D stacked bar chart to the specified worksheet using Worksheet.getCharts().add(ExcelChartType.BarStacked) method.
- Set data range for the chart using Chart.setDataRange(CellRange dataRange) method.
- Set position, title, category axis title and value axis title for the chart.
- Loop through the data series of the chart, and then show data labels for the data points of each data series by setting the value of ChartSerie.getDataPoints().getDefaultDataPoint().getDataLabels().hasValue() method to true.
- Set the position of chart legend using Chart.getLegend().setPosition() method.
- Save the result file using Workbook.saveToFile() method.
- Java
import com.spire.xls.*;
import com.spire.xls.charts.ChartSerie;
import com.spire.xls.charts.ChartSeries;

import java.awt.*;

public class CreateBarChart {

    public static void main(String[] args) {

        //Create a Workbook object
        Workbook workbook = new Workbook();

        //Get the first worksheet
        Worksheet sheet = workbook.getWorksheets().get(0);

        //Insert data to specified cells
        sheet.getCellRange("A1").setValue("Country");
        sheet.getCellRange("A2").setValue("Cuba");
        sheet.getCellRange("A3").setValue("Mexico");
        sheet.getCellRange("A4").setValue("France");
        sheet.getCellRange("A5").setValue("German");

        sheet.getCellRange("B1").setValue("Jun");
        sheet.getCellRange("B2").setNumberValue(6000);
        sheet.getCellRange("B3").setNumberValue(8000);
        sheet.getCellRange("B4").setNumberValue(9000);
        sheet.getCellRange("B5").setNumberValue(8500);

        sheet.getCellRange("C1").setValue("Aug");
        sheet.getCellRange("C2").setNumberValue(3000);
        sheet.getCellRange("C3").setNumberValue(2000);
        sheet.getCellRange("C4").setNumberValue(6000);
        sheet.getCellRange("C5").setNumberValue(3500);

        //Set cell styles
        sheet.getCellRange("A1:C1").setRowHeight(15);
        sheet.getCellRange("A1:C1").getCellStyle().setColor(Color.darkGray);
        sheet.getCellRange("A1:C1").getCellStyle().getExcelFont().setColor(Color.white);
        sheet.getCellRange("A1:C5").getCellStyle().setVerticalAlignment(VerticalAlignType.Center);
        sheet.getCellRange("A1:C5").getCellStyle().setHorizontalAlignment(HorizontalAlignType.Center);

        //Set number format
        sheet.getCellRange("B2:C5").getCellStyle().setNumberFormat("\"$\"#,##0");

        //Add a stacked bar chart to the worksheet
        Chart chart = sheet.getCharts().add(ExcelChartType.BarStacked);

        //Set data range for the chart
        chart.setDataRange(sheet.getCellRange("A1:C5"));
        chart.setSeriesDataFromRange(false);

        //Set position of the chart
        chart.setLeftColumn(1);
        chart.setTopRow(6);
        chart.setRightColumn(11);
        chart.setBottomRow(29);

        //Set and format chart title
        chart.setChartTitle("Sales Report");
        chart.getChartTitleArea().isBold(true);
        chart.getChartTitleArea().setSize(12);

        //Set and format category axis title
        chart.getPrimaryCategoryAxis().setTitle("Country");
        chart.getPrimaryCategoryAxis().getFont().isBold(true);
        chart.getPrimaryCategoryAxis().getTitleArea().isBold(true);
        chart.getPrimaryCategoryAxis().getTitleArea().setTextRotationAngle(90);

        //Set and format value axis title
        chart.getPrimaryValueAxis().setTitle("Sales(in USD)");
        chart.getPrimaryValueAxis().hasMajorGridLines(false);
        chart.getPrimaryValueAxis().setMinValue(1000);
        chart.getPrimaryValueAxis().getTitleArea().isBold(true);

        //Show data labels for data points
        ChartSeries series = chart.getSeries();
        for (int i = 0;i < series.size();i++)
        {
            ChartSerie cs = series.get(i);
            cs.getFormat().getOptions().isVaryColor(true);
            cs.getDataPoints().getDefaultDataPoint().getDataLabels().hasValue(true);
        }

        //Set position of chart legend
        chart.getLegend().setPosition(LegendPositionType.Top);

        //Save the result file
        workbook.saveToFile("StackedBarChart.xlsx", ExcelVersion.Version2016);
    }
}
Apply for a Temporary License
If you'd like to remove the evaluation message from the generated documents, or to get rid of the function limitations, please request a 30-day trial license for yourself.
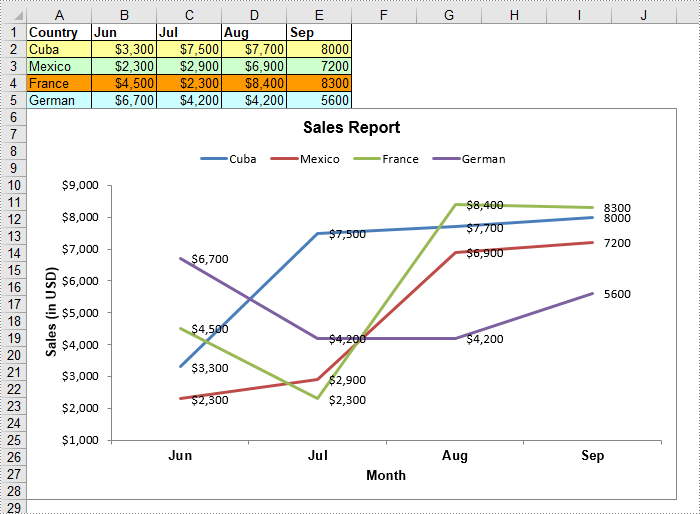
Line chart is a fundamental chart type used to display trends or changes in data over a specific time interval. A line chart uses lines to connect data points, it can include a single line for one data set or multiple lines for two or more data sets. This article will demonstrate how to create a line chart in Excel in Java using Spire.XLS for Java.
Install Spire.XLS for Java
First of all, you're required to add the Spire.Xls.jar file as a dependency in your Java program. The JAR file can be downloaded from this link. If you use Maven, you can easily import the JAR file in your application by adding the following code to your project's pom.xml file.
<repositories>
    <repository>
        <id>com.e-iceblue</id>
        <name>e-iceblue</name>
        <url>https://repo.e-iceblue.com/nexus/content/groups/public/</url>
    </repository>
</repositories>
<dependencies>
    <dependency>
        <groupId>e-iceblue</groupId>
        <artifactId>spire.xls</artifactId>
        <version>16.6.5</version>
    </dependency>
</dependencies>
Create a Line Chart in Excel using Java
The following are the main steps to create a line chart:
- Create an instance of Workbook class.
- Get the first worksheet by its index (zero-based) though Workbook.getWorksheets().get(sheetIndex) method.
- Add some data to the worksheet.
- Add a line chart to the worksheet using Worksheet.getCharts().add(ExcelChartType.Line) method.
- Set data range for the chart through Chart.setDataRange() method.
- Set position, title, category axis title and value axis title for the chart.
- Loop through the data series of the chart, show data labels for the data points of each data series using ChartSerie.getDataPoints().getDefaultDataPoint().getDataLabels().hasValue(true) method.
- Set the position of chart legend through Chart.getLegend().setPosition() method.
- Save the result file using Workbook.saveToFile() method.
- Java
import com.spire.xls.*;
import com.spire.xls.charts.ChartSerie;

import java.awt.*;

public class CreateLineChart {
    public static void main(String []args){
        //Create a Workbook instance
        Workbook workbook = new Workbook();

        //Get the first worksheet
        Worksheet sheet = workbook.getWorksheets().get(0);
        //Set sheet name
        sheet.setName("Line Chart");;
        //Hide gridlines
        sheet.setGridLinesVisible(false);

        //Add some data to the the worksheet
        sheet.getRange().get("A1").setValue("Country");
        sheet.getRange().get("A2").setValue("Cuba");
        sheet.getRange().get("A3").setValue("Mexico");
        sheet.getRange().get("A4").setValue("France");
        sheet.getRange().get("A5").setValue("German");

        sheet.getRange().get("B1").setValue("Jun");
        sheet.getRange().get("B2").setNumberValue(3300);
        sheet.getRange().get("B3").setNumberValue(2300);
        sheet.getRange().get("B4").setNumberValue(4500);
        sheet.getRange().get("B5").setNumberValue(6700);

        sheet.getRange().get("C1").setValue("Jul");
        sheet.getRange().get("C2").setNumberValue(7500);
        sheet.getRange().get("C3").setNumberValue(2900);
        sheet.getRange().get("C4").setNumberValue(2300);
        sheet.getRange().get("C5").setNumberValue(4200);

        sheet.getRange().get("D1").setValue("Aug");
        sheet.getRange().get("D2").setNumberValue(7700);
        sheet.getRange().get("D3").setNumberValue(6900);
        sheet.getRange().get("D4").setNumberValue(8400);
        sheet.getRange().get("D5").setNumberValue(4200);

        sheet.getRange().get("E1").setValue("Sep");
        sheet.getRange().get("E2").setNumberValue(8000);
        sheet.getRange().get("E3").setNumberValue(7200);
        sheet.getRange().get("E4").setNumberValue(8300);
        sheet.getRange().get("E5").setNumberValue(5600);

        //Set font and fill color for specified cells
        sheet.getRange().get("A1:E1").getStyle().getFont().isBold(true);
        sheet.getRange().get("A2:E2").getStyle().setKnownColor(ExcelColors.LightYellow);;
        sheet.getRange().get("A3:E3").getStyle().setKnownColor(ExcelColors.LightGreen1);
        sheet.getRange().get("A4:E4").getStyle().setKnownColor(ExcelColors.LightOrange);
        sheet.getRange().get("A5:E5").getStyle().setKnownColor(ExcelColors.LightTurquoise);

        //Set cell borders
        sheet.getRange().get("A1:E5").getStyle().getBorders().getByBordersLineType(BordersLineType.EdgeTop).setColor(new Color(0, 0, 128));
        sheet.getRange().get("A1:E5").getStyle().getBorders().getByBordersLineType(BordersLineType.EdgeTop).setLineStyle(LineStyleType.Thin);
        sheet.getRange().get("A1:E5").getStyle().getBorders().getByBordersLineType(BordersLineType.EdgeBottom).setColor(new Color(0, 0, 128));
        sheet.getRange().get("A1:E5").getStyle().getBorders().getByBordersLineType(BordersLineType.EdgeBottom).setLineStyle(LineStyleType.Thin);
        sheet.getRange().get("A1:E5").getStyle().getBorders().getByBordersLineType(BordersLineType.EdgeLeft).setColor(new Color(0, 0, 128));
        sheet.getRange().get("A1:E5").getStyle().getBorders().getByBordersLineType(BordersLineType.EdgeLeft).setLineStyle(LineStyleType.Thin);
        sheet.getRange().get("A1:E5").getStyle().getBorders().getByBordersLineType(BordersLineType.EdgeRight).setColor(new Color(0, 0, 128));
        sheet.getRange().get("A1:E5").getStyle().getBorders().getByBordersLineType(BordersLineType.EdgeRight).setLineStyle(LineStyleType.Thin);

        //Set number format
        sheet.getRange().get("B2:D5").getStyle().setNumberFormat("\"$\"#,##0");

        //Add a line chart to the worksheet
        Chart chart = sheet.getCharts().add(ExcelChartType.Line);

        //Set data range for the chart
        chart.setDataRange(sheet.getRange().get("A1:E5"));

        //Set position of the chart
        chart.setLeftColumn(1);
        chart.setTopRow(6);
        chart.setRightColumn(11);
        chart.setBottomRow(29);

        //Set and format chart title
        chart.setChartTitle("Sales Report");
        chart.getChartTitleArea().isBold(true);
        chart.getChartTitleArea().setSize(12);

        //Set and format category axis title
        chart.getPrimaryCategoryAxis().setTitle("Month");
        chart.getPrimaryCategoryAxis().getFont().isBold(true);
        chart.getPrimaryCategoryAxis().getTitleArea().isBold(true);

        //Set and format value axis title
        chart.getPrimaryValueAxis().setTitle("Sales (in USD)");
        chart.getPrimaryValueAxis().hasMajorGridLines(false);
        chart.getPrimaryValueAxis().getTitleArea().setTextRotationAngle(-90);
        chart.getPrimaryValueAxis().setMinValue(1000);
        chart.getPrimaryValueAxis().getTitleArea().isBold(true);

        //Loop through the data series of the chart
        for(ChartSerie cs : (Iterable) chart.getSeries())
        {
            cs.getFormat().getOptions().isVaryColor(true);
            //Show data labels for data points
            cs.getDataPoints().getDefaultDataPoint().getDataLabels().hasValue(true);
        }

        //Set position of chart legend
        chart.getLegend().setPosition(LegendPositionType.Top);

        //Save the result file
        workbook.saveToFile("LineChart.xlsx", ExcelVersion.Version2016);
    }
}
Apply for a Temporary License
If you'd like to remove the evaluation message from the generated documents, or to get rid of the function limitations, please request a 30-day trial license for yourself.
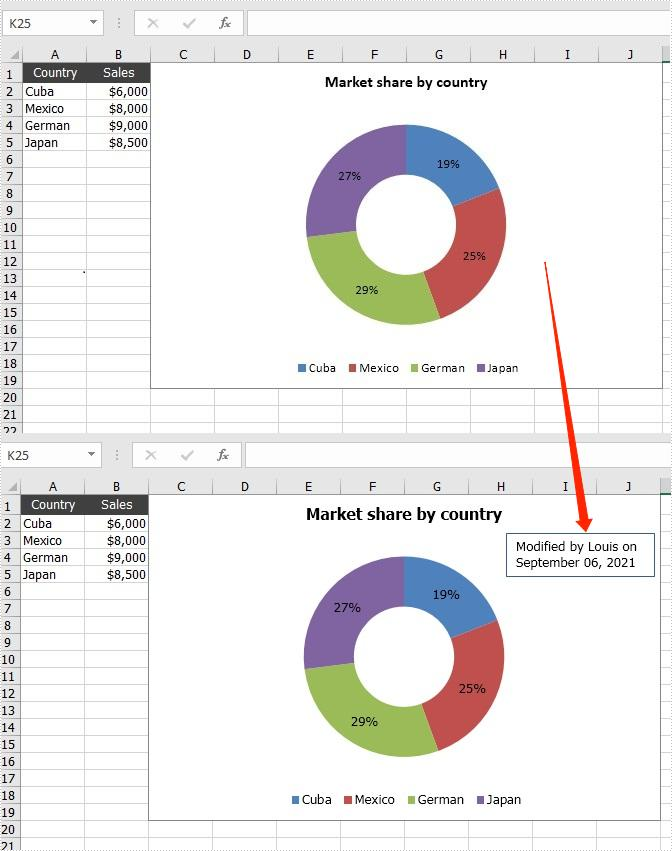
Text box allows people to enter text in it and move it arbitrarily. When dealing with the chart in Excel document, if the text description of the original chart is not specific enough, you can add additional information to the chart by adding text boxes to it. This article will introduce how to add a text box to a chart programmatically using Spire.XLS for Java.
Install Spire.XLS for Java
First of all, you're required to add the Spire.Xls.jar file as a dependency in your Java program. The JAR file can be downloaded from this link. If you use Maven, you can easily import the JAR file in your application by adding the following code to your project's pom.xml file.
<repositories>
    <repository>
        <id>com.e-iceblue</id>
        <name>e-iceblue</name>
        <url>https://repo.e-iceblue.com/nexus/content/groups/public/</url>
    </repository>
</repositories>
<dependencies>
    <dependency>
        <groupId>e-iceblue</groupId>
        <artifactId>spire.xls</artifactId>
        <version>16.6.5</version>
    </dependency>
</dependencies>
Add a Text Box to a Chart
The detailed steps are listed as below.
- Create a Workbook instance and load a sample Excel document using Workbook.loadFromFile() method.
- Get a specified worksheet using Workbook.getWorksheets().get() method.
- Get a specific chart using Worksheet.getCharts().get() method.
- Add a text box to the chart using Chart.getShapes().addTextBox() method, and then add text content in the text box using ITextBoxLinkShape.setText() method.
- Set the size and position of the added text box using the method offered by ITextBoxLinkShape interface.
- Save the document to file using Workbook.saveToFile() method.
- Java
import com.spire.xls.*;
import com.spire.xls.core.*;

public class addTextBoxToChart {
    public static void main(String[] args)throws Exception {
        //Create a Workbook instance
        Workbook workbook = new Workbook();

        //Load an Excel document
        workbook.loadFromFile("DoughnutChart.xlsx");

        //Get the first worksheet
        Worksheet sheet = workbook.getWorksheets().get(0);

        //Get the first chart
        Chart chart = sheet.getCharts().get(0);

        //Add a text box to the chart
        ITextBoxLinkShape textbox = chart.getShapes().addTextBox();
        textbox.setText("Modified by Louis on September 06, 2021");

        //Set the size and position of the text box
        textbox.setWidth(1100);
        textbox.setHeight(480);
        textbox.setLeft(2800);
        textbox.setTop(480);

        //Save the result file
        workbook.saveToFile("addTextBoxToChart.xlsx", ExcelVersion.Version2013);
    }
}
Apply for a Temporary License
If you'd like to remove the evaluation message from the generated documents, or to get rid of the function limitations, please request a 30-day trial license for yourself.
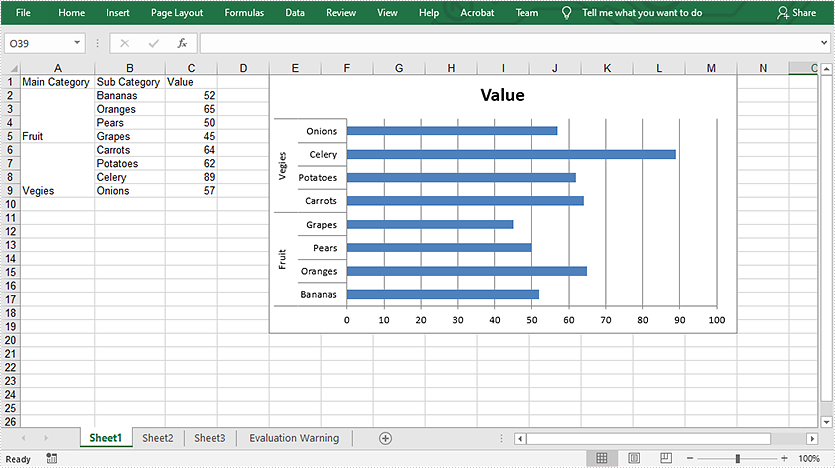
This article demonstrates how to create multi-level category chart in Excel using Spire.XLS for Java.
import com.spire.xls.*;
import com.spire.xls.charts.*;

public class CreateMultiLevelChart {
    public static void main(String []args) throws Exception {
        //create a workbook
        Workbook workbook = new Workbook();
        Worksheet sheet = workbook.getWorksheets().get(0);

        //write data to cells
        sheet.getCellRange("A1").setText( "Main Category");
        sheet.getCellRange("A2").setText("Fruit");
        sheet.getCellRange("A6").setText("Vegies");
        sheet.getCellRange("B1").setText("Sub Category");
        sheet.getCellRange("B2").setText( "Bananas");
        sheet.getCellRange("B3").setText( "Oranges");
        sheet.getCellRange("B4").setText( "Pears");
        sheet.getCellRange("B5").setText("Grapes");
        sheet.getCellRange("B6").setText( "Carrots");
        sheet.getCellRange("B7").setText( "Potatoes");
        sheet.getCellRange("B8").setText( "Celery");
        sheet.getCellRange("B9").setText( "Onions");
        sheet.getCellRange("C1").setText("Value");
        sheet.getCellRange("C2").setValue("52");
        sheet.getCellRange("C3").setValue( "65");
        sheet.getCellRange("C4").setValue( "50");
        sheet.getCellRange("C5").setValue( "45");
        sheet.getCellRange("C6").setValue( "64");
        sheet.getCellRange("C7").setValue( "62");
        sheet.getCellRange("C8").setValue( "89");
        sheet.getCellRange("C9").setValue( "57");

        //vertically merge cells from A2 to A5, A6 to A9
        sheet.getCellRange("A2:A5").merge();
        sheet.getCellRange("A6:A9").merge();
        sheet.autoFitColumn(1);
        sheet.autoFitColumn(2);

        //add a clustered bar chart to worksheet
        Chart chart = sheet.getCharts().add(ExcelChartType.BarClustered);
        chart.setChartTitle( "Value");
        chart.getPlotArea().getFill().setFillType( ShapeFillType.NoFill);
        chart.getLegend().delete();
        chart.setLeftColumn(5);
        chart.setTopRow(1);
        chart.setRightColumn(14);

        //set the data source of series data
        chart.setDataRange(sheet.getCellRange("C2:C9"));
        chart.setSeriesDataFromRange(false);

        //set the data source of category labels
        ChartSerie serie = chart.getSeries().get(0);
        serie.setCategoryLabels( sheet.getCellRange("A2:B9"));

        //show multi-level category labels
        chart.getPrimaryCategoryAxis().setMultiLevelLable( true);

        //save the document
        workbook.saveToFile("output/createMultiLevelChart.xlsx", ExcelVersion.Version2013);
    }
}
Output:
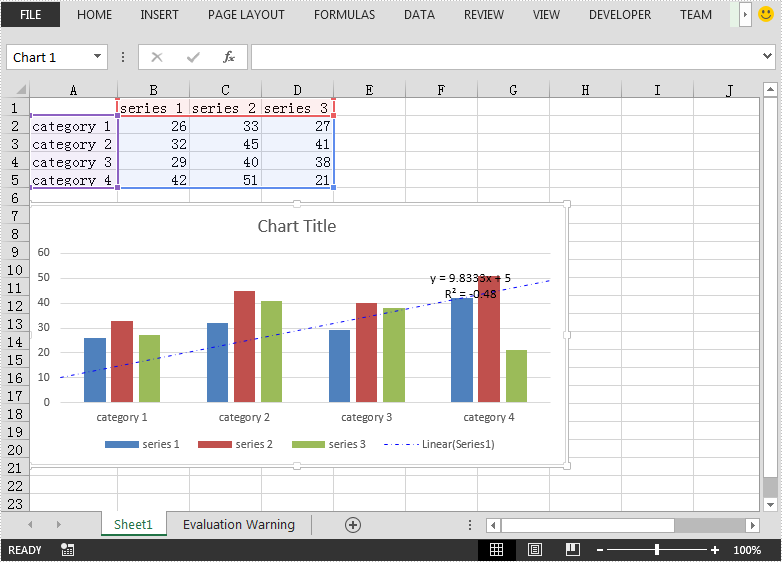
Add Trendline to Chart and Read Trendline Equation in Excel in Java
2020-11-17 08:12:33 Written by KoohjiThis article demonstrates how to add Trendline to an Excel chart and read the equation of the Trendline using Spire.XLS for Java.
Add Trendline
import com.spire.xls.*;
import com.spire.xls.core.IChartTrendLine;

import java.awt.*;

public class AddTrendline {
    public static void main(String[] args){
        //Create a Workbook instance
        Workbook workbook = new Workbook();
        //Load the Excel file
        workbook.loadFromFile("test.xlsx");

        //Get the first chart in the first worksheet
        Chart chart = workbook.getWorksheets().get(0).getCharts().get(0);

        //Add a Trendline to the first series of the chart
        IChartTrendLine trendLine = chart.getSeries().get(0).getTrendLines().add(TrendLineType.Linear);

        //Set Trendline name
        trendLine.setName("Linear(Series1)");
        //Set line type and color
        trendLine.getBorder().setPattern(ChartLinePatternType.DashDot);
        trendLine.getBorder().setColor(Color.blue);
        //Set forward and backward value
        trendLine.setForward(0.5);
        trendLine.setBackward(0.5);
        //Set intercept value
        trendLine.setIntercept(5);

        //Display equation on chart
        trendLine.setDisplayEquation(true);
        //Display R-Squared value on chart
        trendLine.setDisplayRSquared(true);

        //Save the result file
        workbook.saveToFile("AddTrendline.xlsx", ExcelVersion.Version2013);
    }
}
Read Trendline equation
import com.spire.xls.Chart;
import com.spire.xls.Workbook;
import com.spire.xls.core.IChartTrendLine;
public class ReadEquationOfTrendline {
public static void main(String[] args){
//Create a Workbook instance
Workbook workbook = new Workbook();
//Load the Excel file
workbook.loadFromFile("AddTrendline.xlsx");
//Get the first chart in the first worksheet
Chart chart = workbook.getWorksheets().get(0).getCharts().get(0);
//Read the equation of the first series of the chart
IChartTrendLine trendLine = chart.getSeries().get(0).getTrendLines().get(0);
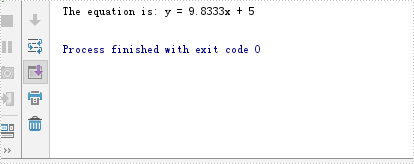
String equation = trendLine.getFormula();
System.out.println("The equation is: " + equation);
}
}
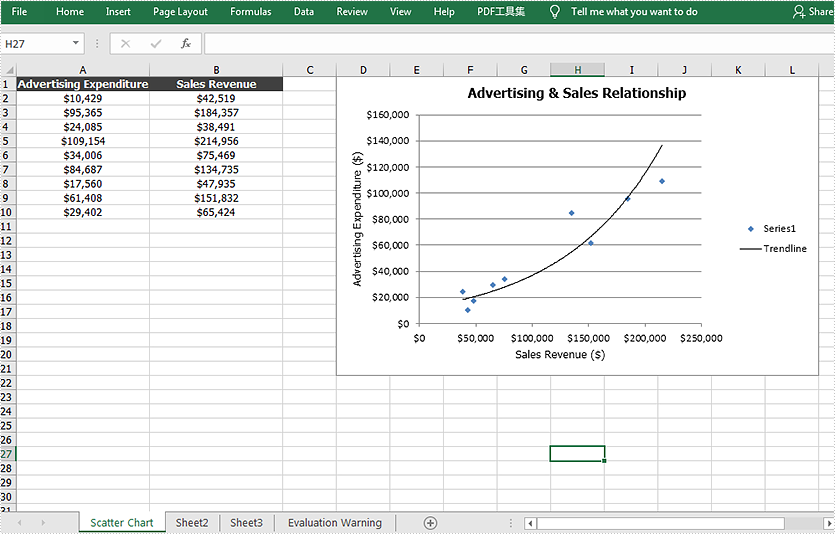
This article demonstrates how to create a scatter chart and add a trendline to it in an Excel document by using Spire.XLS for Java.
import com.spire.xls.*;
import com.spire.xls.core.IChartTrendLine;

import java.awt.*;

public class ScatterChart {
    public static void main(String[] args) {

        //Create a a Workbook object and get the first worksheet
        Workbook workbook = new Workbook();
        Worksheet sheet = workbook.getWorksheets().get(0);

        //Rename the first worksheet and set the column width
        sheet.getCellRange("A1:B1").setColumnWidth(22f);;
        sheet.setName("Scatter Chart");

        //Insert data
        sheet.getCellRange("A1").setValue("Advertising Expenditure");
        sheet.getCellRange("A2").setValue("10429");
        sheet.getCellRange("A3").setValue("95365");
        sheet.getCellRange("A4").setValue("24085");
        sheet.getCellRange("A5").setValue("109154");
        sheet.getCellRange("A6").setValue("34006");
        sheet.getCellRange("A7").setValue("84687");
        sheet.getCellRange("A8").setValue("17560");
        sheet.getCellRange("A9").setValue ("61408");
        sheet.getCellRange("A10").setValue ("29402");

        sheet.getCellRange("B1").setValue("Sales Revenue");
        sheet.getCellRange("B2").setValue ("42519");
        sheet.getCellRange("B3").setValue("184357");
        sheet.getCellRange("B4").setValue ("38491");
        sheet.getCellRange("B5").setValue ("214956");
        sheet.getCellRange("B6").setValue ("75469");
        sheet.getCellRange("B7").setValue ("134735");
        sheet.getCellRange("B8").setValue("47935");
        sheet.getCellRange("B9").setValue ("151832");
        sheet.getCellRange("B10").setValue ("65424");

        //Set cell style
        sheet.getCellRange("A1:B1").getStyle().getFont().isBold(true);
        sheet.getCellRange("A1:B1").getStyle().setColor(Color.darkGray);
        sheet.getCellRange("A1:B1").getCellStyle().getExcelFont().setColor(Color.white);
        sheet.getCellRange("A1:B10").getStyle().setHorizontalAlignment(HorizontalAlignType.Center);
        sheet.getCellRange("A2:B10").getCellStyle().setNumberFormat("\"$\"#,##0") ;


        //Create a scatter chart and set its data range
        Chart chart = sheet.getCharts().add(ExcelChartType.ScatterMarkers);
        chart.setDataRange(sheet.getCellRange("B2:B10"));
        chart.setSeriesDataFromRange(false);

        //Set position of the chart.
        chart.setLeftColumn(4);
        chart.setTopRow(1);
        chart.setRightColumn(13);
        chart.setBottomRow(22);

        //Set chart title and series data label
        chart.setChartTitle("Advertising & Sales Relationship");
        chart.getChartTitleArea().isBold(true);
        chart.getChartTitleArea().setSize(12);
        chart.getSeries().get(0).setCategoryLabels(sheet.getCellRange("B2:B10"));
        chart.getSeries().get(0).setValues(sheet.getCellRange("A2:A10"));

        //Add a trendline
        IChartTrendLine trendLine = chart.getSeries().get(0).getTrendLines().add(TrendLineType.Exponential);
        trendLine.setName("Trendline");

        //Set title of  the x and y axis
        chart.getPrimaryValueAxis().setTitle("Advertising Expenditure ($)");
        chart.getPrimaryCategoryAxis().setTitle("Sales Revenue ($)");

        //Save the document
        workbook.saveToFile("ScatterChart.xlsx",ExcelVersion.Version2010);
        workbook.dispose();
    }
}
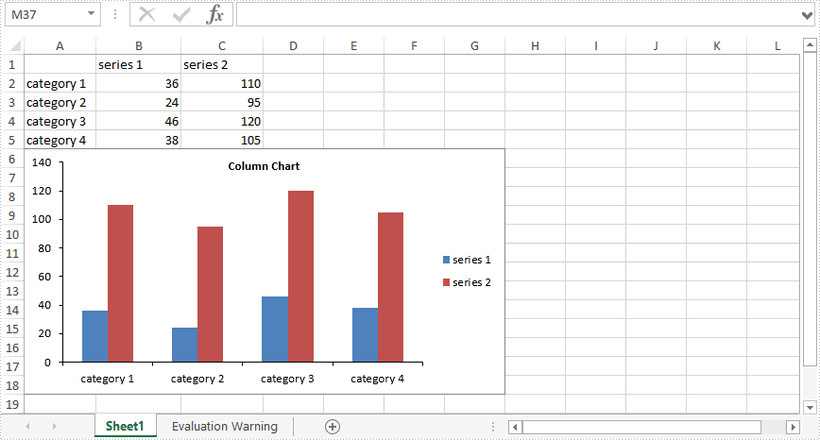
This article demonstrates how to hide gridlines in an Excel chart using Spire.XLS for Java.
import com.spire.xls.*;

public class HideGridlinesInChart {

    public static void main(String[] args) {

        //Create a Workbook object
        Workbook workbook = new Workbook();

        //Load an Excel file that contains data for creating chart
        workbook.loadFromFile("C:\\Users\\Administrator\\Desktop\\data.xlsx");

        //Get the first worksheet
        Worksheet sheet = workbook.getWorksheets().get(0);

        //Add a column chart
        Chart chart = sheet.getCharts().add(ExcelChartType.ColumnClustered);
        chart.setChartTitle("Column Chart");

        //Set the chart data range
        chart.setDataRange(sheet.getCellRange("A1:C5"));
        chart.setSeriesDataFromRange(false);

        //Set the chart position
        chart.setLeftColumn(1);
        chart.setTopRow(6);
        chart.setRightColumn(8);
        chart.setBottomRow(19);

        //Hide the grid lines of chart
        chart.getPrimaryValueAxis().hasMajorGridLines(false);

        //Save the document
        workbook.saveToFile("HideGridlines.xlsx", ExcelVersion.Version2016);
    }
}
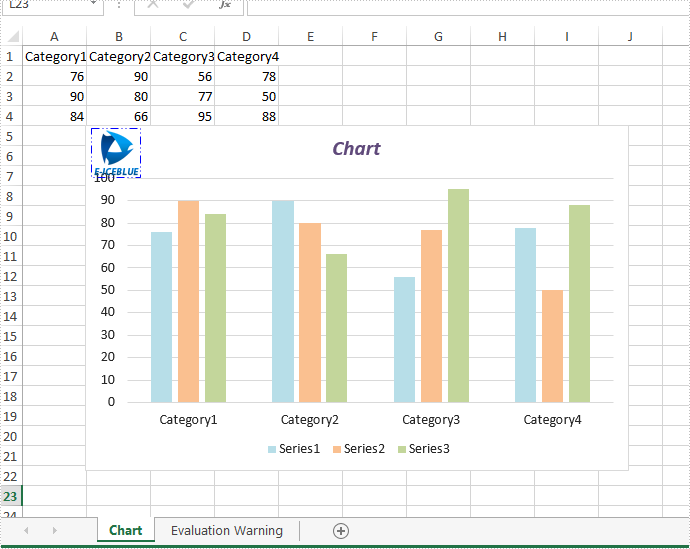
This article will introduce how to add a picture to Excel chart in java applications by using Spire.XLS for java.
import com.spire.xls.*;
import com.spire.xls.core.IPictureShape;
import com.spire.xls.core.IShape;
import java.awt.*;

public class addPictureToChart {
    public static void main(String[] args) {

        //Load the document from disk
        Workbook workbook = new Workbook();
        workbook.loadFromFile("Sample.xlsx");

        //get the first worksheet
        Worksheet sheet = workbook.getWorksheets().get(0);

        //get the first chart
        Chart chart = sheet.getCharts().get(0);

        //add the picture to chart and set its format
        IShape picture = chart.getShapes().addPicture("48.png");
        ((IPictureShape) picture).getLine().setDashStyle(ShapeDashLineStyleType.DashDotDot);
        ((IPictureShape) picture).getLine().setForeColor(Color.blue);

         //save the document
        String result = "output/AddPictureToChart.xlsx";
        workbook.saveToFile(result, ExcelVersion.Version2010);

    }
}
Effective screenshot after adding picture to Excel Chart:
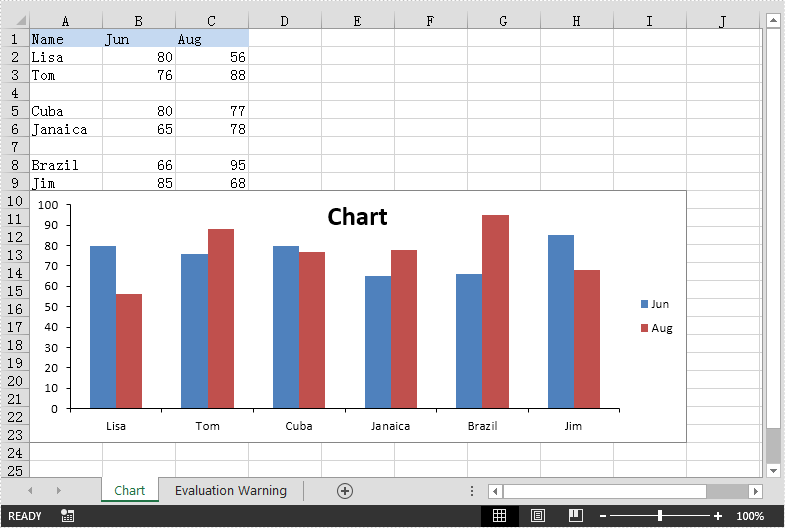
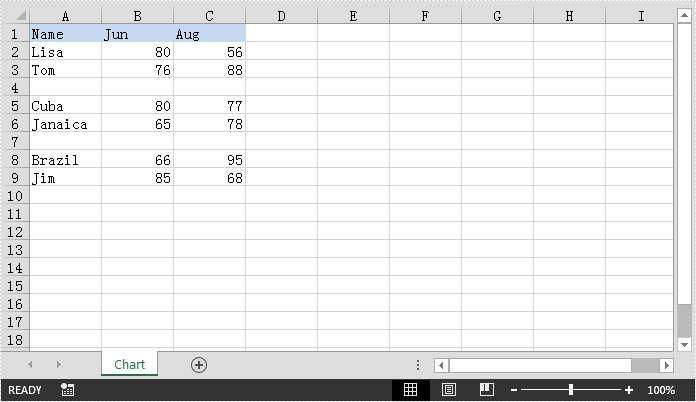
This article demonstrates how to create chart with non-contiguous data in Excel using Spire.XLS for Java.
The example Excel file:
import com.spire.xls.*;
import com.spire.xls.charts.ChartSerie;

import java.awt.*;

public class ChartWithNonContiguousData {
    public static void main(String[] args){
        //Create a Workbook instance
        Workbook workbook = new Workbook();
        //Load the Excel file
        workbook.loadFromFile("NonContiguousData.xlsx");

        //Get the first worksheet
        Worksheet sheet = workbook.getWorksheets().get(0);

        //Add a clustered column chart to the worksheet
        Chart chart = sheet.getCharts().add(ExcelChartType.ColumnClustered);
        chart.setSeriesDataFromRange(false);
        //Set chart position
        chart.setLeftColumn(1);
        chart.setTopRow(10);
        chart.setRightColumn(10);
        chart.setBottomRow(24);

        //Add a series to the chart
        ChartSerie cs1 = (ChartSerie)chart.getSeries().add();
        //Set series name
        cs1.setName(sheet.getCellRange("B1").getValue());
        //Set category labels for the series using non-contiguous data
        cs1.setCategoryLabels(sheet.getCellRange("A2:A3").addCombinedRange(sheet.getCellRange("A5:A6"))
.addCombinedRange(sheet.getCellRange("A8:A9")));
        //Set values for the series using non-contiguous data
        cs1.setValues(sheet.getCellRange("B2:B3").addCombinedRange(sheet.getCellRange("B5:B6"))
.addCombinedRange(sheet.getCellRange("B8:B9")));
        //Specify the series type
        cs1.setSerieType(ExcelChartType.ColumnClustered);

        //Add a series to the chart
        ChartSerie cs2 = (ChartSerie)chart.getSeries().add();
        //Set series name
        cs2.setName(sheet.getCellRange("C1").getValue());
        //Set category labels for the series using non-contiguous data
        cs2.setCategoryLabels(sheet.getCellRange("A2:A3").addCombinedRange(sheet.getCellRange("A5:A6"))
.addCombinedRange(sheet.getCellRange("A8:A9")));
        //Set values for the series using non-contiguous data
        cs2.setValues(sheet.getCellRange("C2:C3").addCombinedRange(sheet.getCellRange("C5:C6"))
.addCombinedRange(sheet.getCellRange("C8:C9")));
        //Specify the series type
        cs2.setSerieType(ExcelChartType.ColumnClustered);

        //Set chart title
        chart.setChartTitle("Chart");
        chart.getChartTitleArea().getFont().setSize(20);
        chart.getChartTitleArea().setColor(Color.black);

        chart.getPrimaryValueAxis().hasMajorGridLines(false);

        //Save the result file
        workbook.saveToFile("Chart.xlsx", ExcelVersion.Version2013);
    }
}
Output: