
Chart (2)
Charts in Word documents are a valuable tool for presenting and analyzing data in a visually appealing and understandable format. They help summarize key trends, patterns, or relationships within the data, which is especially useful when you are creating company reports, business proposals or research papers. In this article, you will learn how to programmatically add a line chart to a Word document using Spire.Doc for .NET.
Install Spire.Doc for .NET
To begin with, you need to add the DLL files included in the Spire.Doc for.NET package as references in your .NET project. The DLL files can be either downloaded from this link or installed via NuGet.
PM> Install-Package Spire.Doc
Create a Line Chart in Word in C# and VB.NET
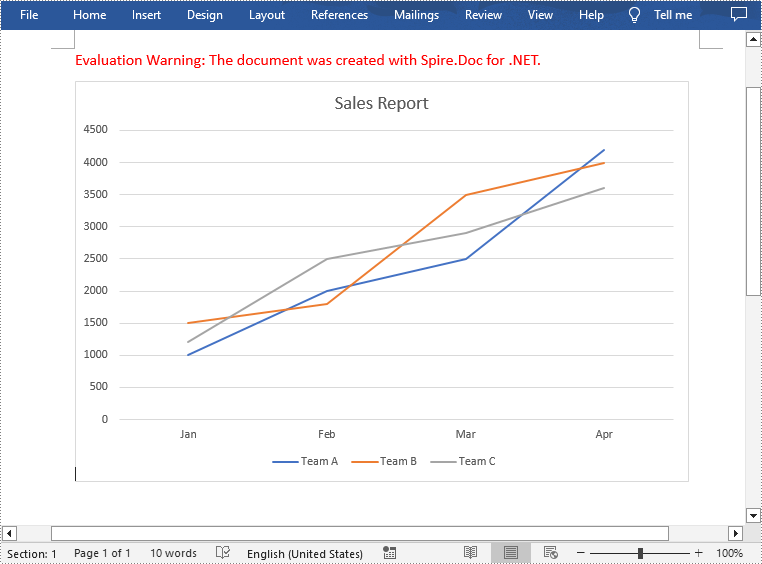
A line chart is a common type of chart that connects a series of data points with a continuous line. To add a line chart in Word, Spire.Doc for .NET offers the Paragraph.AppendChart(ChartType.Line, float width, float height) method. The following are the detailed steps.
- Create a Document object.
- Add a section and then add a paragraph to the section.
- Add a line chart with specified size to the paragraph using Paragraph.AppendChart(ChartType.Line, float width, float height) method.
- Get the chart and then set the chart title using Chart.Tilte.Text property.
- Add a custom series to the chart using Chart.Series.Add(string seriesName, string[] categories, double[] values) method.
- Set the legend position using Chart.Legend.Position property.
- Save the result document using Document.SaveToFile() method.
- C#
- VB.NET
using Spire.Doc;
using Spire.Doc.Documents;
using Spire.Doc.Fields.Shapes.Charts;
using Spire.Doc.Fields;

namespace WordLineChart
{
    class Program
    {
        static void Main(string[] args)
        {
            //Create a Document object
            Document document = new Document();

            //Add a section
            Section section = document.AddSection();

            //Add a paragraph to the section
            Paragraph newPara = section.AddParagraph();

            //Add a line chart with specified size to the paragraph
            ShapeObject shape = newPara.AppendChart(ChartType.Line, 460, 300);

            //Get the chart
            Chart chart = shape.Chart;

            //Set chart title
            chart.Title.Text = "Sales Report";

            //Clear the default series data of the chart
            chart.Series.Clear();

            //Add three custom series with specified series names, category names, and series values to chart
            string[] categories = { "Jan", "Feb", "Mar", "Apr"};
            chart.Series.Add("Team A", categories, new double[] { 1000, 2000, 2500, 4200 });
            chart.Series.Add("Team B", categories, new double[] { 1500, 1800, 3500, 4000 });
            chart.Series.Add("Team C", categories, new double[] { 1200, 2500, 2900, 3600 });

            //Set the legend position
            chart.Legend.Position = LegendPosition.Bottom;

            //Save the result document
            document.SaveToFile("AppendLineChart.docx", FileFormat.Docx);
        }
    }
}
Apply for a Temporary License
If you'd like to remove the evaluation message from the generated documents, or to get rid of the function limitations, please request a 30-day trial license for yourself.
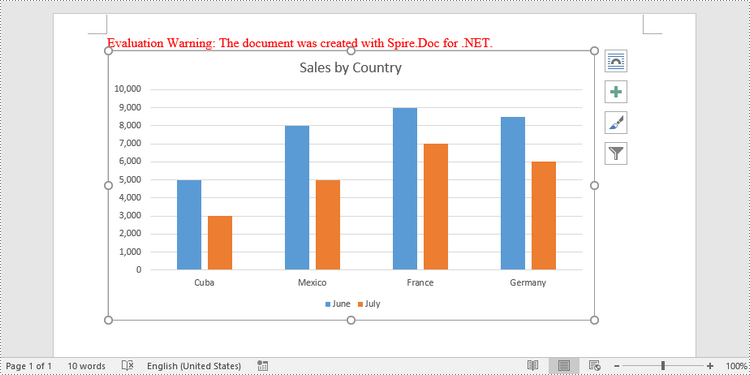
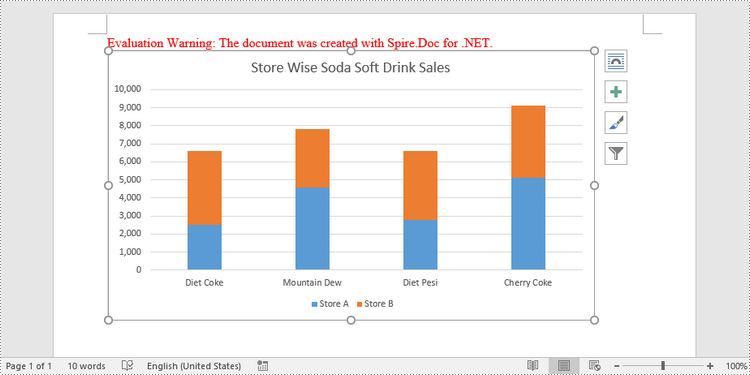
A clustered column chart and a stacked column chart are two variations of the column chart. The clustered column chart enables simple comparison of values across different categories, whereas the stacked column chart displays both the total value of different categories and the proportion of each individual component. In this article, you will learn how to create clustered or stacked column charts in Word in C# and VB.NET using Spire.Doc for .NET.
- Create a Clustered Column Chart in Word in C#, VB.NET
- Create a Stacked Column Chart in Word in C#, VB.NET
Install Spire.Doc for .NET
To begin with, you need to add the DLL files included in the Spire.Doc for.NET package as references in your .NET project. The DLL files can be either downloaded from this link or installed via NuGet.
PM> Install-Package Spire.Doc
Create a Clustered Column Chart in Word in C#, VB.NET
To add a chart to a Word document, use Paragraph.AppenChart(ChartType chartType, float width, float height) method. The ChartType enumeration includes various chart types predefined in MS Word. The following are the steps to add a clustered column chart in Word using Spire.Doc for .NET.
- Create a Document object.
- Add a section and a paragraph.
- Add a column chart to the paragraph using Paragraph.AppendChart() method.
- Add series to the chart using Chart.Series.Add() method.
- Set the chart title through Chart.Tilte.Text property.
- Save the document to a Word file using Document.SaveToFile() method.
- C#
- VB.NET
using Spire.Doc;
using Spire.Doc.Documents;
using Spire.Doc.Fields.Shapes.Charts;
using Spire.Doc.Fields;

namespace CreateColumnChart
{
    class Program
    {
        static void Main(string[] args)
        {
            //Create a Document object
            Document document = new Document();

            //Add a section
            Section section = document.AddSection();

            //Add a paragraph
            Paragraph paragraph = section.AddParagraph();

            //Add a column chart
            ShapeObject shape = paragraph.AppendChart(ChartType.Column, 450, 250);

            //Get the chart
            Chart chart = shape.Chart;

            //Clear the default data
            chart.Series.Clear();

            //Add a series including series name, category names, and series values to chart
            chart.Series.Add("June",
                new[] { "Cuba", "Mexico", "France", "Germany" },
                new double[] { 5000, 8000, 9000, 8500 });

            //Add another series
            chart.Series.Add("July",
            new[] { "Cuba", "Mexico", "France", "Germany" },
            new double[] { 3000, 5000, 7000, 6000 });

            //Set the chart title
            chart.Title.Text = "Sales by Country";

            //Set the number format of the Y-axis
            chart.AxisY.NumberFormat.FormatCode = "#,##0";

            //Set the legend position
            chart.Legend.Position = LegendPosition.Bottom;

            //Save to file
            document.SaveToFile("ClusteredColumnChart.docx", FileFormat.Docx2019);
        }
    }
}
Create a Stacked Column Chart in Word in C#, VB.NET
A stacked column chart can be created pretty much in the same way as a clustered column chart. The only difference is you have to change the chart type from Column to ColumnStacked.
- Create a Document object.
- Add a section and a paragraph.
- Add a stacked column chart to the paragraph using Paragraph.AppendChart() method.
- Add series to the chart using Chart.Series.Add() method.
- Set the chart title through Chart.Tilte.Text property.
- Save the document to a Word file using Document.SaveToFile() method.
- C#
- VB.NET
using Spire.Doc;
using Spire.Doc.Documents;
using Spire.Doc.Fields.Shapes.Charts;
using Spire.Doc.Fields;

namespace StackedColumnChart
{
    class Program
    {
        static void Main(string[] args)
        {
            //Create a Document object
            Document document = new Document();

            //Add a section
            Section section = document.AddSection();

            //Add a paragraph
            Paragraph paragraph = section.AddParagraph();

            //Add a stacked column chart
            ShapeObject shape = paragraph.AppendChart(ChartType.ColumnStacked, 450, 250);

            //Get the chart
            Chart chart = shape.Chart;

            //Clear the default data
            chart.Series.Clear();

            //Add a series including series name, category names, and series values to chart
            chart.Series.Add("Store A",
                new[] { "Diet Coke", "Mountain Dew", "Diet Pesi", "Cherry Coke" },
                new double[] { 2500, 4600, 2800, 5100 });

            //Add another series
            chart.Series.Add("Store B",
            new[] { "Diet Coke", "Mountain Dew", "Diet Pesi", "Cherry Coke" },
            new double[] { 4100, 3200, 3800, 4000 });

            //Set the chart title
            chart.Title.Text = "Store Wise Soda Soft Drink Sales";

            //Set the number format of the Y-axis
            chart.AxisY.NumberFormat.FormatCode = "#,##0";

            //Set the legend position
            chart.Legend.Position = LegendPosition.Bottom;

            //Save to file
            document.SaveToFile("StackedColumnChart.docx", FileFormat.Docx2019);
        }
    }
}
Apply for a Temporary License
If you'd like to remove the evaluation message from the generated documents, or to get rid of the function limitations, please request a 30-day trial license for yourself.
