Bedingte Formatierung ist eine Funktion in Microsoft Excel, mit der Sie Formatierungsregeln auf Zellen basierend auf bestimmten Bedingungen oder Kriterien anwenden können. Diese Bedingungen können auf Zellwerten, Formeln oder anderen angegebenen Kriterien basieren. Mit der bedingten Formatierung können Sie das Erscheinungsbild von Zellen dynamisch ändern, z. B. Schriftfarbe, Hintergrundfarbe der Zelle, Rahmen und Datenbalken, um bestimmte Datenpunkte optisch hervorzuheben oder hervorzuheben. In diesem Blog erfahren Sie, wie das geht Wenden Sie mit Python bedingte Formatierung auf Excel an.
Wir werden einige häufig verwendete Arten von Regeln zur bedingten Formatierung in Excel besprechen:
- Zellenregeln hervorheben
- Obere oder untere Regeln
- Datenbalken
- Farbskalen
- Symbolsätze
- Formelbasierte Regeln
Python-Bibliothek zum Anwenden bedingter Formatierung auf Excel
Um mit Python eine bedingte Formatierung auf Excel-Dateien anzuwenden, müssen wir ein Python-Modul installieren, das diese Funktionalität unterstützt. In diesem Blogbeitrag verwenden wir die Bibliothek Spire.XLS for Python, die einen umfassenden Satz an Funktionen und Eigenschaften bietet, die speziell für die Anwendung bedingter Formatierungsregeln auf Excel-Dateien basierend auf verschiedenen Kriterien wie Zellwerten, Formeln und mehr entwickelt wurden.
Um Spire.XLS for Python zu installieren, können Sie den folgenden pip-Befehl ausführen:
pip install Spire.XLS
Zellenregeln hervorheben
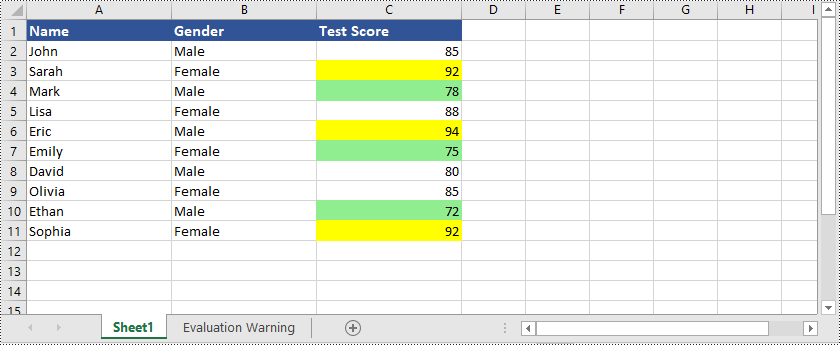
Regeln zum Hervorheben von Zellen sind eine Art bedingte Formatierung in Excel, mit der Sie Zellen basierend auf ihren Werten hervorheben können. Sie können Bedingungen wie „größer als“, „kleiner als“, „gleich“, „zwischen“, und „mehr“ festlegen, um zu bestimmen, welche Zellen formatiert werden sollen. Sie können Formatierungsoptionen wie Schriftfarbe, Hintergrundfarbe und Rahmen auswählen.
Hier ist ein Beispiel, das zeigt, wie es geht Markieren Sie Zellen mit Werten, die größer oder kleiner als ein bestimmter Wert in Excel sind mit Python und Spire.XLS for Python:
- Python
from spire.xls import *
from spire.xls.common import *

# Create an object of the Workbook class
workbook = Workbook()
# Load an Excel file
workbook.LoadFromFile("Example1.xlsx")
# Get the first worksheet
sheet = workbook.Worksheets[0]

# Add a conditional format to the sheet
conditionalFormat = sheet.ConditionalFormats.Add()
# Specify the cell range to apply the conditional format
conditionalFormat.AddRange(sheet.Range["C2:C11"])

# Create the first condition to highlight cells containing values greater than a specific value
condition1 = conditionalFormat.AddCondition()
condition1.FormatType = ConditionalFormatType.CellValue
condition1.FirstFormula = "90"
condition1.Operator = ComparisonOperatorType.Greater
condition1.BackColor = Color.get_Yellow()

# Create the second condition to highlight cells containing values less than a specific value
condition2 = conditionalFormat.AddCondition()
condition2.FormatType = ConditionalFormatType.CellValue
condition2.FirstFormula = "80"
condition2.Operator = ComparisonOperatorType.Less
condition2.BackColor = Color.get_LightGreen()

# Save the result file
workbook.SaveToFile("HighlightCellRules.xlsx", ExcelVersion.Version2016)
workbook.Dispose()
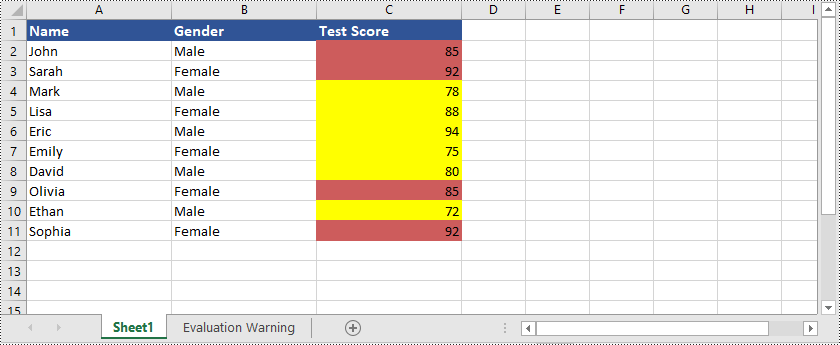
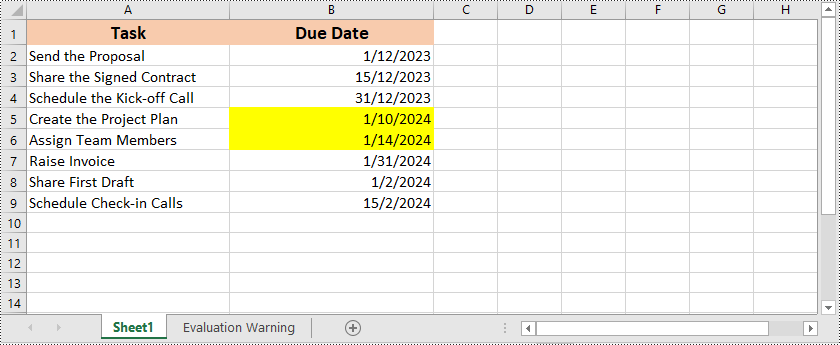
Neben der Hervorhebung von Zellen mit Werten, die größer oder kleiner als ein bestimmter Wert sind, unterstützt Spire.XLS for Python auch viele andere Optionen. Sie können beispielsweise Zellen mit doppelten oder eindeutigen Werten hervorheben und Zellen mit Datumsangaben hervorheben, die innerhalb eines bestimmten Werts liegen Zeitraum und vieles mehr.
Hier ist ein Beispiel, das zeigt, wie es geht Markieren Sie Zellen mit doppelten oder eindeutigen Werten in Excel mit Python und Spire.XLS for Python:
- Python
from spire.xls import *
from spire.xls.common import *

# Create an object of the Workbook class
workbook = Workbook()
# Load an Excel file
workbook.LoadFromFile("Example1.xlsx")
# Get the first worksheet
sheet = workbook.Worksheets[0]

# Add a conditional format to the worksheet
conditionalFormat = sheet.ConditionalFormats.Add()
# Specify the cell range to apply the conditional format
conditionalFormat.AddRange(sheet.Range["C2:C11"])

# Create the first condition to highlight cells containing duplicate values
condition1 = conditionalFormat.AddCondition()
condition1.FormatType = ConditionalFormatType.DuplicateValues
condition1.BackColor = Color.get_IndianRed()

# Create the second condition to highlight cells containing unique values
condition2 = conditionalFormat.AddCondition()
condition2.FormatType = ConditionalFormatType.UniqueValues
condition2.BackColor = Color.get_Yellow()

# Save the result file
workbook.SaveToFile("HighlightCellRules.xlsx", ExcelVersion.Version2016)
workbook.Dispose()
Hier ist ein Beispiel, das zeigt, wie es geht Markieren Sie Zellen mit Datumsangaben, die in einen bestimmten Zeitraum in Excel fallen mit Python und Spire.XLS for Python:
- Python
from spire.xls import *
from spire.xls.common import *

# Create an object of the Workbook class
workbook = Workbook()
# Load an Excel file
workbook.LoadFromFile("Example2.xlsx")
# Get the first worksheet
sheet = workbook.Worksheets[0]

# Add a conditional format to the worksheet
conditionalFormat = sheet.ConditionalFormats.Add()
# Specify the cell range to apply the conditional format
conditionalFormat.AddRange(sheet.Range["B2:B9"])

# Create a condition to highlight cells with dates that fall within a specific time period
condition = conditionalFormat.AddTimePeriodCondition(TimePeriodType.Last7Days)
condition.BackColor = Color.get_Yellow()

# Save the result file
workbook.SaveToFile("HighlightCellRules.xlsx", ExcelVersion.Version2016)
workbook.Dispose()
Obere oder untere Regeln
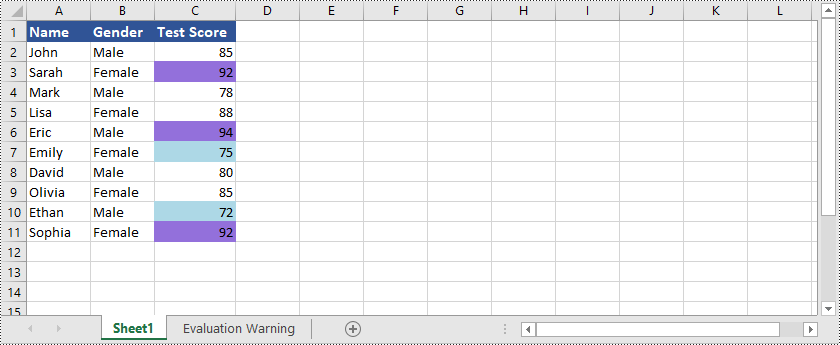
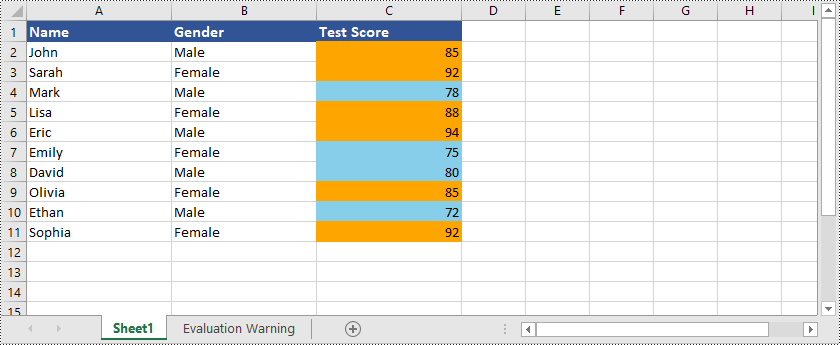
Top/Bottom-Regeln sind eine weitere Art der bedingten Formatierung in Excel, mit der Sie Zellen hervorheben können, die die höchsten oder niedrigsten Werte innerhalb eines Bereichs enthalten. Sie können die Anzahl der hervorzuhebenden oberen oder unteren Werte angeben, und Excel wendet die Formatierung automatisch basierend auf der ausgewählten Regel an.
Hier ist ein Beispiel, das zeigt, wie es geht Markieren Sie Zellen mit den höchsten oder niedrigsten Werten in Excel mit Python und Spire.XLS for Python:
- Python
from spire.xls import *
from spire.xls.common import *

# Create an object of the Workbook class
workbook = Workbook()
# Load an Excel file
workbook.LoadFromFile("Example1.xlsx")
# Get the first worksheet
sheet = workbook.Worksheets[0]

# Add a conditional format to the worksheet
conditionalFormat = sheet.ConditionalFormats.Add()
# Specify the cell range to apply the conditional format
conditionalFormat.AddRange(sheet.Range["C2:C11"])

# Add the first condition to highlight the top 2 ranked values
condition1 = conditionalFormat.AddTopBottomCondition(TopBottomType.Top, 2)
condition1.BackColor = Color.get_MediumPurple()

# Add the second condition to highlight the bottom 2 ranked values
condition2 = conditionalFormat.AddTopBottomCondition(TopBottomType.Bottom, 2)
condition2.BackColor = Color.get_LightBlue()

# Save the result file
workbook.SaveToFile("TopOrBottomRules.xlsx", ExcelVersion.Version2016)
workbook.Dispose()
Spire.XLS for Python ist nicht nur in der Lage, Zellen hervorzuheben, die die obersten oder niedrigsten Werte enthalten Hervorheben von Zellen mit Werten über oder unter dem Durchschnittswert in Excel. Sie können sich auf das folgende Beispiel beziehen:
- Python
from spire.xls import *
from spire.xls.common import *

# Create an object of the Workbook class
workbook = Workbook()
# Load an Excel file
workbook.LoadFromFile("Example1.xlsx")
# Get the first worksheet
sheet = workbook.Worksheets[0]

# Add a conditional format to the worksheet
conditionalFormat1 = sheet.ConditionalFormats.Add()
# Specify the cell range to apply the conditional format
conditionalFormat1.AddRange(sheet.Range["C2:C11"])

# Create a condition to highlight cells with values below the average
condition1 = conditionalFormat1.AddAverageCondition(AverageType.Below)
condition1.BackColor = Color.get_SkyBlue()

# Add a conditional format to the worksheet
conditionalFormat2 = sheet.ConditionalFormats.Add()
# Specify the cell range to apply the conditional format
conditionalFormat2.AddRange(sheet.Range["C2:C11"])

# Create a condition to highlight cells with values above the average
condition2 = conditionalFormat2.AddAverageCondition(AverageType.Above)
condition2.BackColor = Color.get_Orange()

# Save the result file
workbook.SaveToFile("HighlightValuesAboveOrBelowAverage.xlsx", ExcelVersion.Version2016)
workbook.Dispose()
Datenbalken
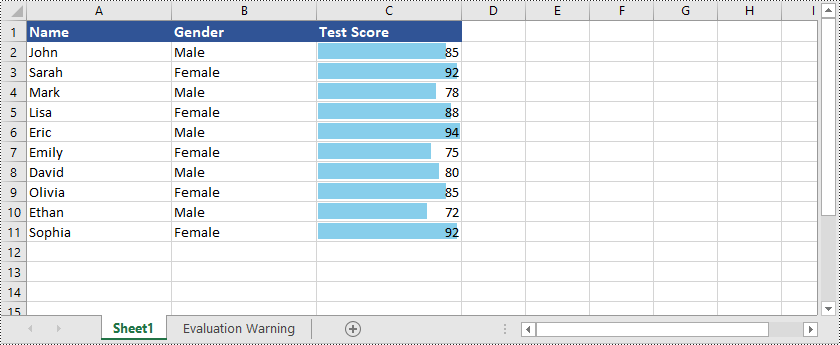
Datenbalken sind eine visuelle Darstellung der bedingten Formatierung in Excel. Sie erstellen horizontale Balken innerhalb von Zellen, die die relativen Werte der Daten visuell darstellen. Die Länge des Balkens entspricht dem Wert in der Zelle und ermöglicht so einen einfachen Vergleich von Datenpunkten.
Hier ist ein Beispiel, das zeigt, wie es geht Erstellen Sie Datenbalken in Excel mit Python und Spire.XLS for Python:
- Python
from spire.xls import *
from spire.xls.common import *

# Create an object of the Workbook class
workbook = Workbook()
# Load an Excel file
workbook.LoadFromFile("Example1.xlsx")
# Get the first worksheet
sheet = workbook.Worksheets[0]

# Add a conditional format to the worksheet
conditionalFormat = sheet.ConditionalFormats.Add()
# Specify the cell range to apply the conditional format
conditionalFormat.AddRange(sheet.Range["C2:C11"])

# Add a condition and set its format type to DataBar
condition = conditionalFormat.AddCondition()
condition.FormatType = ConditionalFormatType.DataBar
# Set fill effect for data bars
# condition.DataBar.BarFillType = DataBarFillType.DataBarFillGradient
# Set bar color
condition.DataBar.BarColor = Color.get_SkyBlue()

# Save the result file
workbook.SaveToFile("DataBars.xlsx", ExcelVersion.Version2016)
workbook.Dispose()
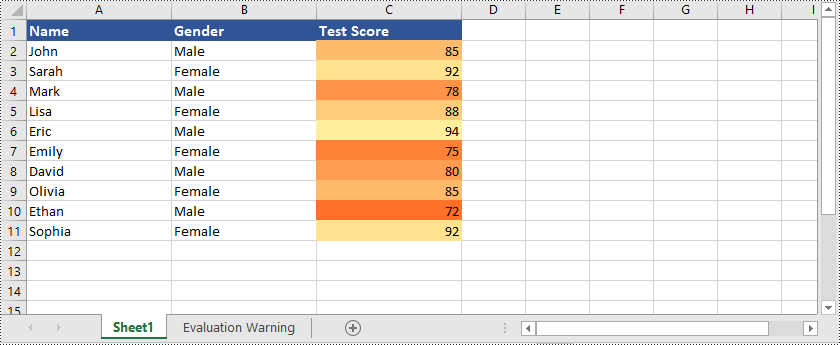
Farbskalen
Farbskalen sind eine Art bedingte Formatierung, die Farbverläufe auf Zellen basierend auf ihren Werten anwendet. Excel verwendet eine Reihe von Farben, um die Verteilung von Werten innerhalb eines ausgewählten Zellbereichs darzustellen. Höheren Werten wird eine Farbe zugewiesen, während niedrigeren Werten eine andere Farbe zugewiesen wird, mit Schattierungen dazwischen für Zwischenwerte. Farbskalen bieten eine visuelle Darstellung der Datenverteilung und ermöglichen Ihnen die einfache Identifizierung hoher und niedriger Werte sowie der relativen Positionierung von Werten innerhalb des Datensatzes.
Hier ist ein Beispiel, das zeigt, wie es geht Erstellen Sie Farbskalen in Excel mit Python und Spire.XLS for Python:
- Python
from spire.xls import *
from spire.xls.common import *

# Create an object of the Workbook class
workbook = Workbook()
# Load an Excel file
workbook.LoadFromFile("Example1.xlsx")
# Get the first worksheet
sheet = workbook.Worksheets[0]

# Add a conditional format to the worksheet
conditionalFormat = sheet.ConditionalFormats.Add()
# Specify the cell range to apply the conditional format
conditionalFormat.AddRange(sheet.Range["C2:C11"])

# Add a condition and set its format type to ColorScale
condition = conditionalFormat.AddCondition()
condition.FormatType = ConditionalFormatType.ColorScale

# Save the result file
workbook.SaveToFile("ColorScales.xlsx", ExcelVersion.Version2016)
workbook.Dispose()
Symbolsätze
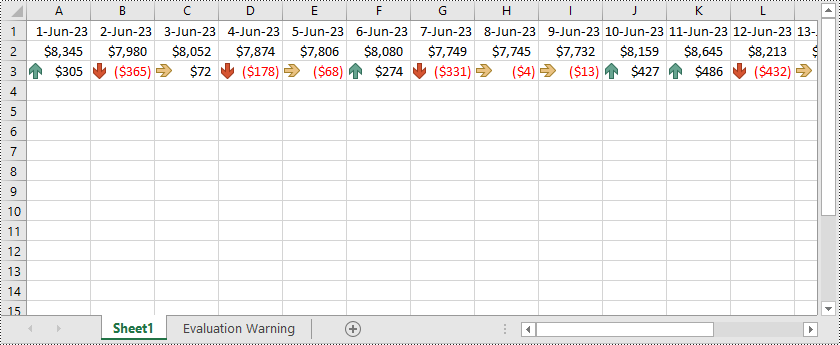
Symbolsätze sind eine Art bedingter Formatierung, die visuelle Symbole wie Pfeile, Symbole oder Ampeln verwendet, um verschiedene Bedingungen oder Werte innerhalb von Zellen darzustellen. Excel bietet vordefinierte Symbolsätze, die Sie basierend auf bestimmten Kriterien oder Wertebereichen anwenden können. Sie können beispielsweise Pfeilsymbole verwenden, um anzuzeigen, ob Werte steigen oder fallen, oder Ampelsymbole verwenden, um den Status bestimmter Metriken darzustellen. Symbolsätze bieten eine visuell intuitive Möglichkeit, Daten basierend auf den zugewiesenen Symbolen zu interpretieren und zu vergleichen.
Hier ist ein Beispiel, das zeigt, wie es geht Erstellen Sie Icon-Sets in Excel mit Python und Spire.XLS for Python:
- Python
from spire.xls import *
from spire.xls.common import *

# Create an object of the Workbook class
workbook = Workbook()
# Load an Excel file
workbook.LoadFromFile("Example3.xlsx")
# Get the first worksheet
sheet = workbook.Worksheets[0]

# Add a conditional format to the worksheet
conditionalFormat = sheet.ConditionalFormats.Add()
# Specify the cell range to apply the conditional format
conditionalFormat.AddRange(sheet.Range["A3:R3"])

# Add a condition and set its format type to IconSet
condition = conditionalFormat.AddCondition()
condition.FormatType = ConditionalFormatType.IconSet
# Set the type of icon sets to ThreeArrows
condition.IconSet.IconSetType = IconSetType.ThreeArrows

# Save the result file
workbook.SaveToFile("IconSets.xlsx", ExcelVersion.Version2013)
workbook.Dispose()
Formelbasierte Regeln
Die formelbasierte bedingte Formatierung gibt Ihnen die Flexibilität, mithilfe von Formeln benutzerdefinierte Regeln zu erstellen. Sie können komplexe Bedingungen definieren, indem Sie Funktionen, Operatoren und Zellbezüge verwenden. Dies ermöglicht eine hochgradig maßgeschneiderte Formatierung basierend auf spezifischen Berechnungen oder Vergleichen.
Hier ist ein Beispiel, das zeigt, wie es geht Wenden Sie formelbasierte bedingte Formatierung auf Excel mit Python und Spire.XLS for Python:
- Python
from spire.xls import *
from spire.xls.common import *

# Create an object of the Workbook class
workbook = Workbook()
# Load an Excel file
workbook.LoadFromFile("Example1.xlsx")
# Get the first worksheet
sheet = workbook.Worksheets[0]

# Add a conditional format to the worksheet
conditionalFormat = sheet.ConditionalFormats.Add()
# Specify the cell range to apply the conditional format
conditionalFormat.AddRange(sheet.Range["A2:C11"])

# Add a condition and set its format type to Formula
condition = conditionalFormat.AddCondition()
condition.FormatType = ConditionalFormatType.Formula
condition.FirstFormula = "=MOD(ROW(),2)=1"
condition.BackColor = Color.get_LightGray()

# Save the result file
workbook.SaveToFile("FormulaBasedRules.xlsx", ExcelVersion.Version2016)
workbook.Dispose()

Holen Sie sich eine kostenlose Lizenz
Um die Funktionen von Spire.XLS for Python ohne jegliche Evaluierungseinschränkungen voll auszuschöpfen, können Sie eine Anfrage stellen eine kostenlose 30-Tage-Testlizenz.
Abschluss
In diesem Blog wurde erläutert, wie Sie mit Spire.XLS for Python verschiedene Arten der bedingten Formatierung auf Excel anwenden. Wenn Sie Fragen haben, können Sie diese gerne in unserem Forum posten oder per E-Mail an unser Support-Team senden.