
Working with tabular data is a common task for Python developers, and Pandas is the go-to library for data manipulation and analysis. Often, developers need to export Pandas DataFrames to Excel for reporting, team collaboration, or further data analysis. While Pandas provides the to_excel function for basic exports, creating professional Excel reports with formatted headers, styled cells, multiple sheets, and charts can be challenging.
This tutorial demonstrates how to write a single DataFrame or multiple DataFrames to Excel using Spire.XLS for Python, a multi-functional Excel library that enables full customization of Excel files directly from Python-without needing Microsoft Excel to be installed.
Table of Contents
- Why Use Spire.XLS for Pandas DataFrame to Excel
- Prerequisites for Pandas DataFrame to Excel
- Export a Single Pandas DataFrame to Excel with Formatting
- Convert Multiple Pandas DataFrames to One Excel File
- Write Pandas DataFrames to Existing Excel File
- Advanced Customization for Exporting Pandas DataFrames to Excel
- Conclusion
- FAQs
Why Use Spire.XLS for Pandas DataFrame to Excel
While Pandas provides basic Excel export functionality, Spire.XLS extends this by giving full control over Excel file creation. Instead of just writing raw data, developers can:
- Organize multiple DataFrames into separate sheets within a single workbook.
- Customize headers, fonts, colors, and cell formatting to produce professional layouts.
- Auto-fit columns and adjust row heights for improved readability.
- Add charts, formulas, and other Excel features directly from Python
Prerequisites for Pandas DataFrame to Excel
Before exporting a Pandas DataFrame to Excel, ensure you have the following required libraries installed. You can do this by running the following command in your project's terminal:
pip install pandas spire.xls
These libraries allow you to write DataFrames to Excel with multiple sheets, custom formatting, attractive charts, and structured layouts.
Export a Single Pandas DataFrame to Excel with Formatting
Exporting a single DataFrame to an Excel file is the most common scenario. Using Spire.XLS, you can not only export your DataFrame but also format headers, style cells, and add charts to make your report look professional.
Let's go through this process step by step.
Step 1: Create a Sample DataFrame
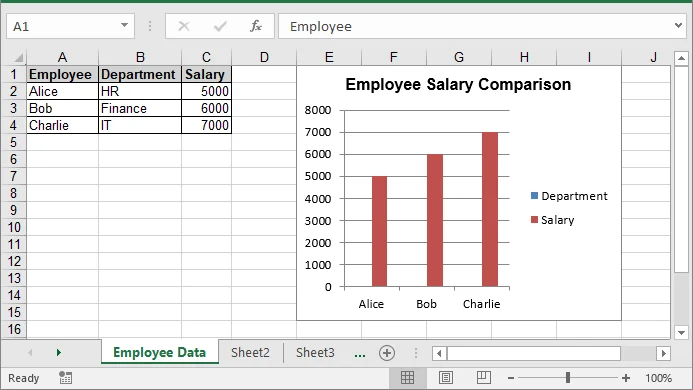
First, we need to create a DataFrame. Here, we have employee names, departments, and salaries. You can, of course, replace this with your own dataset.
import pandas as pd
from spire.xls import *

# Create a simple DataFrame
df = pd.DataFrame({
    'Employee': ['Alice', 'Bob', 'Charlie'],
    'Department': ['HR', 'Finance', 'IT'],
    'Salary': [5000, 6000, 7000]
})
Step 2: Create a Workbook and Access the First Sheet
Now we'll create a new Excel workbook and get the first worksheet ready. Let's give it a meaningful name so it's easy to understand.
# Create a new workbook
workbook = Workbook()
sheet = workbook.Worksheets[0]
sheet.Name = "Employee Data"
Step 3: Write Column Headers
We'll write the headers to the first row, make them bold and add a light gray background, so everything looks neat.
# Write column headers
for colIndex, colName in enumerate(df.columns, start=1):
    cell = sheet.Range[1, colIndex]
    cell.Text = colName
    cell.Style.Font.IsBold = True                # Make headers bold
    cell.Style.Color = Color.get_LightGray()     # Light gray background
Step 4: Write the Data Rows
Next, we write each row from the DataFrame. For numbers, we use the NumberValue property so Excel can recognize them for calculations and charts.
# Write data rows
for rowIndex, row in enumerate(df.values, start=2):
    for colIndex, value in enumerate(row, start=1):
        cell = sheet.Range[rowIndex, colIndex]
        if isinstance(value, (int, float)):
            cell.NumberValue = value
        else:
            cell.Text = str(value)
Step 5: Apply Borders and Auto-Fit Columns
To give your Excel sheet a polished, table-like appearance, let's add borders and automatically adjust the column widths.
# Apply borders and auto-fit columns
usedRange = sheet.AllocatedRange
usedRange.BorderAround(LineStyleType.Thin, Color.get_Black()) # Outside borders
usedRange.BorderInside(LineStyleType.Thin, Color.get_Black()) # Inside borders
usedRange.AutoFitColumns()
Step 6: Add a Chart to Visualize Data
Charts help you quickly understand trends. Here, we'll create a column chart comparing salaries.
# Add a chart
chart = sheet.Charts.Add()
chart.ChartType = ExcelChartType.ColumnClustered
chart.DataRange = sheet.Range["A1:C4"]        # Data range for chart
chart.SeriesDataFromRange = False
chart.LeftColumn = 5                          # Chart position
chart.TopRow = 1
chart.RightColumn = 10
chart.BottomRow = 16
chart.ChartTitle = "Employee Salary Comparison"
chart.ChartTitleArea.Font.Size = 12
chart.ChartTitleArea.Font.IsBold = True
Step 7: Save the Workbook
Finally, save the workbook to your desired location.
# Save the Excel file
workbook.SaveToFile("DataFrameWithChart.xlsx", ExcelVersion.Version2016)
workbook.Dispose()
Result:
The Excel XLSX File generated from Pandas DataFrame looks like this:
Once the Excel file is generated, it can be further processed, such as being converted to PDF for easy sharing:
workbook.SaveToFile("ToPdf.pdf", FileFormat.PDF)
For more details, see the guide on converting Excel to PDF in Python.
Convert Multiple Pandas DataFrames to One Excel File
When creating Excel reports, multiple datasets often need to be placed on separate sheets. Using Spire.XLS, each Pandas DataFrame can be written to its own worksheet, ensuring related data is organized clearly and easy to analyze. The following steps demonstrate this workflow.
Step 1: Create Multiple Sample DataFrames
Before exporting, we create two separate DataFrames - one for employee information and another for products. Each DataFrame will go into its own Excel sheet.
import pandas as pd
from spire.xls import *

# Sample DataFrames
df1 = pd.DataFrame({'Name': ['Alice', 'Bob'], 'Age': [25, 30]})
df2 = pd.DataFrame({'Product': ['Laptop', 'Phone'], 'Price': [1000, 500]})

# List of DataFrames with corresponding sheet names
dataframes = [
    (df1, "Employees"),
    (df2, "Products")
]
Here, dataframes is a list of tuples that pairs each DataFrame with the name of the sheet it should appear in.
Step 2: Create a New Workbook
Next, we create a new Excel workbook to store all the DataFrames.
# Create a new workbook
workbook = Workbook()
This initializes a blank workbook with three default sheets. We'll rename and populate them in the next step.
Step 3: Loop Through Each DataFrame and Write to Its Own Sheet
Instead of writing each DataFrame individually, we can loop through our list and process them in the same way. This reduces duplicate code and makes it easier to handle more datasets.
for i, (df, sheet_name) in enumerate(dataframes):
    # Get or create a sheet
    if i < workbook.Worksheets.Count:
        sheet = workbook.Worksheets[i]
    else:
        sheet = workbook.Worksheets.Add()

    sheet.Name = sheet_name

    # Write headers with bold font and background color
    for colIndex, colName in enumerate(df.columns, start=1):
        cell = sheet.Range[1, colIndex]
        cell.Text = colName
        cell.Style.Font.IsBold = True
        cell.Style.Color = Color.get_LightGray()
        sheet.Columns[colIndex - 1].ColumnWidth = 15  # Set fixed column width

    # Write rows of data
    for rowIndex, row in enumerate(df.values, start=2):
        for colIndex, value in enumerate(row, start=1):
            cell = sheet.Range[rowIndex, colIndex]
            if isinstance(value, (int, float)):
                cell.NumberValue = value
            else:
                cell.Text = str(value)

    # Apply thin borders around the used range
    usedRange = sheet.AllocatedRange
    usedRange.BorderAround(LineStyleType.Thin, Color.get_Black()) # Outside borders
    usedRange.BorderInside(LineStyleType.Thin, Color.get_Black()) # Inside borders
Using this loop, we can easily add more DataFrames in the future without rewriting the same code.
Step 4: Save the Workbook
Finally, we save the Excel file. Both datasets are now neatly organized in one file with separate sheets, formatted headers, and proper borders.
# Save the workbook
workbook.SaveToFile("MultipleDataFrames.xlsx", ExcelVersion.Version2016)
workbook.Dispose()
Now your Excel file is ready to be shared or analyzed further.
Result:

The file MultipleDataFrames.xlsx contains two sheets:
- Employees (with names and ages)
- Products (with product details and prices)
This organization makes multi-report Excel files clean and easy to navigate.
Write Pandas DataFrames to Existing Excel File
In some cases, instead of creating a new Excel file, you may need to write DataFrames to an existing workbook. This can be easily achieved by loading the existing workbook, adding a new sheet or accessing the desired sheet, and writing the DataFrame data using the same logic.
The following code shows how to write a Pandas DataFrame to an Existing Excel file:
import pandas as pd
from spire.xls import *
# Load an existing Excel file
workbook = Workbook()
workbook.LoadFromFile("MultipleDataFrames.xlsx")
# Create a new DataFrame to add
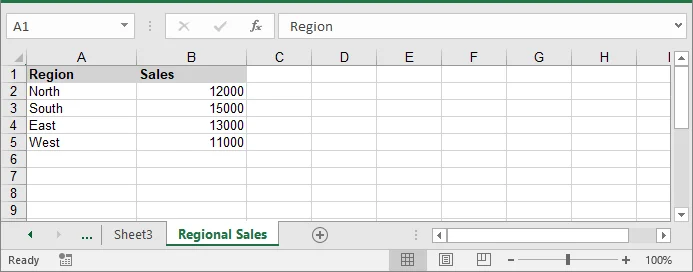
new_df = pd.DataFrame({
'Region': ['North', 'South', 'East', 'West'],
'Sales': [12000, 15000, 13000, 11000]
})
# Add a new worksheet for the new DataFrame
new_sheet = workbook.Worksheets.Add("Regional Sales")
# Write headers
for colIndex, colName in enumerate(new_df.columns, start=1):
cell = new_sheet.Range[1, colIndex]
cell.Text = colName
cell.Style.Font.IsBold = True
cell.Style.Color = Color.get_LightGray()
new_sheet.Columns[colIndex - 1].ColumnWidth = 15
# Write data rows
for rowIndex, row in enumerate(new_df.values, start=2):
for colIndex, value in enumerate(row, start=1):
cell = new_sheet.Range[rowIndex, colIndex]
if isinstance(value, (int, float)):
cell.NumberValue = value
else:
cell.Text = str(value)
# Save the changes
workbook.SaveToFile("DataFrameToExistingWorkbook.xlsx", ExcelVersion.Version2016)
workbook.Dispose()
Advanced Customization for Exporting Pandas DataFrames to Excel
Beyond basic exports, Pandas DataFrames can be customized in Excel to meet specific reporting requirements. Advanced options-such as selecting specific columns, and including or excluding the index-allow you to create cleaner, more readable, and professional Excel files. The following examples demonstrate how to apply these customizations.
1. Select Specific Columns
Sometimes you may not need to export all columns from a DataFrame. By selecting only the relevant columns, you can keep your Excel reports concise and focused. The following code demonstrates how to loop through chosen columns when writing headers and rows:
import pandas as pd
from spire.xls import *

# Create a DataFrame
df = pd.DataFrame({
    'Employee': ['Alice', 'Bob', 'Charlie'],
    'Department': ['HR', 'Finance', 'IT'],
    'Salary': [5000, 6000, 7000]
})

# Set the columns to export
columns_to_export = ['Employee', 'Department']

# Create a new workbook and access the first sheet
workbook = Workbook()
sheet = workbook.Worksheets[0]

# Write headers
for colIndex, colName in enumerate(columns_to_export, start=1):
    sheet.Range[1, colIndex].Text = colName

# Write rows
for rowIndex, row in enumerate(df[columns_to_export].values, start=2):
    for colIndex, value in enumerate(row, start=1):
        sheet.Range[rowIndex, colIndex].Text = value

# Save the Excel file
workbook.SaveToFile("select_columns.xlsx")
workbook.Dispose()
2. Include or Exclude Index
By default, the DataFrame index is not included in the export. If your report requires row identifiers or numeric indices, you can add them manually. This code snippet shows how to include the index alongside selected columns:
# Write header for index
sheet.Range[1, 1].Text = "Index"

# Write index values (numeric)
for rowIndex, idx in enumerate(df.index, start=2):
    sheet.Range[rowIndex, 1].NumberValue = idx  # Use NumberValue for numeric

# Write headers for other columns
for colIndex, colName in enumerate(columns_to_export, start=2):
    sheet.Range[1, colIndex].Text = colName

# Write the data rows
for rowIndex, row in enumerate(df[columns_to_export].values, start=2):
    for colIndex, value in enumerate(row, start=2):
        if isinstance(value, (int, float)):
            sheet.Range[rowIndex, colIndex].NumberValue = value
        else:
            sheet.Range[rowIndex, colIndex].Text = str(value)

# Save the workbook
workbook.SaveToFile("include_index.xlsx", ExcelVersion.Version2016)
workbook.Dispose()
Conclusion
Exporting a Pandas DataFrame to Excel is simple, but producing professional, well-formatted reports requires additional control. By using Pandas for data preparation and Spire.XLS for Python to create and format Excel files, you can generate structured, readable, and visually organized workbooks. This approach works for both single DataFrames and multiple datasets, making it easy to create Excel reports that are ready for analysis, sharing, or further manipulation.
FAQs
Q1: How can I export a Pandas DataFrame to Excel in Python?
A1: You can use libraries like Spire.XLS to write a DataFrame to an Excel file. This allows you to transfer tabular data from Python into Excel while keeping control over formatting and layout.
Q2: Can I export more than one DataFrame to a single Excel file?
A2: Yes. Multiple DataFrames can be written to separate sheets within the same workbook. This helps keep related datasets organized in one file.
Q3: How do I add headers and format cells in Excel from a DataFrame?
A3: Headers can be made bold, colored, or have fixed widths. Numeric values can be stored as numbers and text as strings. Formatting improves readability for reports.
Q4: Is it possible to include charts in the exported Excel file?
A4: Yes. Charts such as column or line charts can be added based on your DataFrame data to help visualize trends or comparisons.
Q5: Do I need Microsoft Excel installed to export DataFrames?
A5: Not necessarily. Some libraries, including Spire.XLS, can create and format Excel files entirely within Python without relying on Excel being installed.