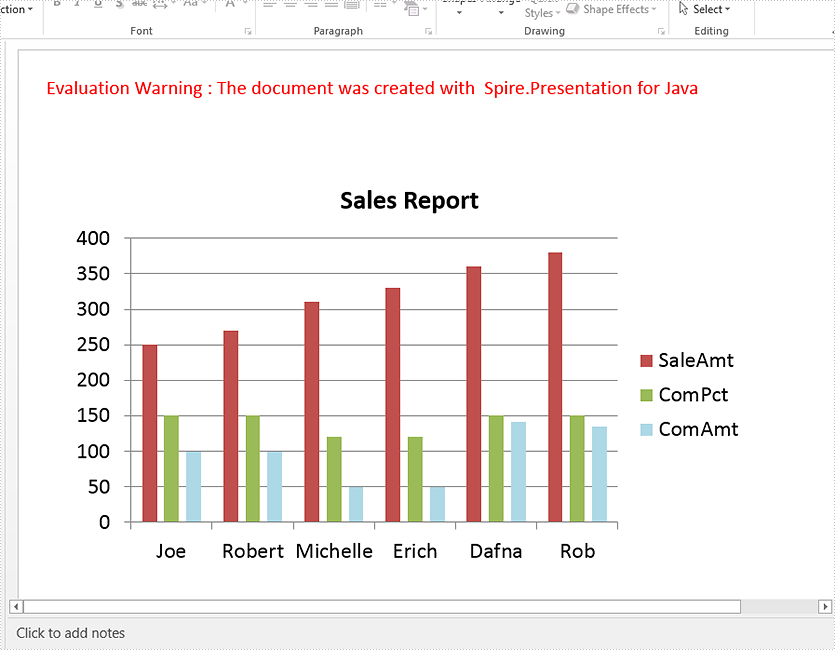
This article demonstrates how to create a chart in a PowerPoint document using Spire.Presentation for Java.
import com.spire.presentation.*;
import com.spire.pdf.tables.table.*;
import com.spire.presentation.charts.*;
import com.spire.presentation.drawing.FillFormatType;
import java.awt.geom.Rectangle2D;
import java.lang.Object;


public class CreateChart {
    public static void main(String[] args) throws Exception {

        //Create a presentation instance
        Presentation presentation = new Presentation();

        //Add a column clustered chart
        Rectangle2D.Double rect = new Rectangle2D.Double(40, 100, 550, 320);
        IChart chart = null;
        chart = presentation.getSlides().get(0).getShapes().appendChart(ChartType.COLUMN_CLUSTERED, rect);

        //Set chart title
        chart.getChartTitle().getTextProperties().setText("Sales Report");
        chart.getChartTitle().getTextProperties().isCentered(true);
        chart.getChartTitle().setHeight(30);
        chart.hasTitle(true);

        //Create a dataTable
        DataTable dataTable = new DataTable();
        dataTable.getColumns().add(new DataColumn("SalesPers", DataTypes.DATATABLE_STRING));
        dataTable.getColumns().add(new DataColumn("SaleAmt", DataTypes.DATATABLE_INT));
        dataTable.getColumns().add(new DataColumn("ComPct", DataTypes.DATATABLE_INT));
        dataTable.getColumns().add(new DataColumn("ComAmt", DataTypes.DATATABLE_INT));
        DataRow row1 = dataTable.newRow();
        row1.setString("SalesPers", "Joe");
        row1.setInt("SaleAmt", 250);
        row1.setInt("ComPct", 150);
        row1.setInt("ComAmt", 99);
        DataRow row2 = dataTable.newRow();
        row2.setString("SalesPers", "Robert");
        row2.setInt("SaleAmt", 270);
        row2.setInt("ComPct", 150);
        row2.setInt("ComAmt", 99);
        DataRow row3 = dataTable.newRow();
        row3.setString("SalesPers", "Michelle");
        row3.setInt("SaleAmt", 310);
        row3.setInt("ComPct", 120);
        row3.setInt("ComAmt", 49);
        DataRow row4 = dataTable.newRow();
        row4.setString("SalesPers", "Erich");
        row4.setInt("SaleAmt", 330);
        row4.setInt("ComPct", 120);
        row4.setInt("ComAmt", 49);
        DataRow row5 = dataTable.newRow();
        row5.setString("SalesPers", "Dafna");
        row5.setInt("SaleAmt", 360);
        row5.setInt("ComPct", 150);
        row5.setInt("ComAmt", 141);
        DataRow row6 = dataTable.newRow();
        row6.setString("SalesPers", "Rob");
        row6.setInt("SaleAmt", 380);
        row6.setInt("ComPct", 150);
        row6.setInt("ComAmt", 135);
        dataTable.getRows().add(row1);
        dataTable.getRows().add(row2);
        dataTable.getRows().add(row3);
        dataTable.getRows().add(row4);
        dataTable.getRows().add(row5);
        dataTable.getRows().add(row6);

        //Import data from dataTable to chart data
        for (int c = 0; c < dataTable.getColumns().size(); c++) {
            chart.getChartData().get(0, c).setText(dataTable.getColumns().get(c).getColumnName());
        }
        for (int r = 0; r < dataTable.getRows().size(); r++) {
            Object[] datas = dataTable.getRows().get(r).getArrayList();
            for (int c = 0; c < datas.length; c++) {
                chart.getChartData().get(r + 1, c).setValue(datas[c]);

            }
        }

        chart.getSeries().setSeriesLabel(chart.getChartData().get("B1", "D1"));
        chart.getCategories().setCategoryLabels(chart.getChartData().get("A2", "A7"));
        chart.getSeries().get(0).setValues(chart.getChartData().get("B2", "B7"));

        chart.getSeries().get(1).setValues(chart.getChartData().get("C2", "C7"));

        chart.getSeries().get(2).setValues(chart.getChartData().get("D2", "D7"));
        chart.getSeries().get(2).getFill().setFillType(FillFormatType.SOLID);
      chart.getSeries().get(2).getFill().getSolidColor().setKnownColor(KnownColors.LIGHT_BLUE);

        //Set overlap
        chart.setOverLap(-50);

        //Set gap width
        chart.setGapDepth(200);

        //Save the document
        presentation.saveToFile("output/CreateChart.pptx", FileFormat.PPTX_2010);
    }
}