Conditional formatting in Microsoft Excel has a number of presets that enables users to apply predefined formatting such as colors, icons and data bars, to a range of cells based on the value of the cell or the value of a formula. Conditional formatting usually reveals the data trends or highlights the data that meets one or more formulas.
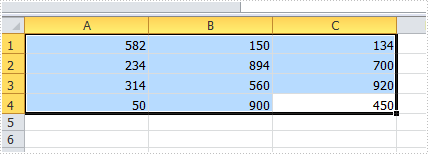
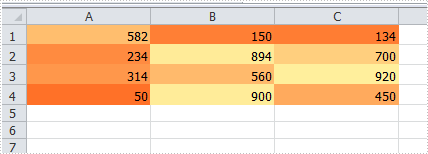
In this article, I made an example to explain how these conditional formatting types can be achieved programmatically using Spire.XLS in C#. First of all, let's see the worksheet that contains a group of data in selected range as below, we’d like see which cells’ value is bigger than 800. In order to quickly figure out similar things like this, we can create a conditional formatting rule by formula: “If the value is bigger than 800, color the cell with Red” to highlight the qualified cells.
Code Snippet for Creating Conditional Formatting Rules:
Step 1: Create a worksheet and insert data to cell range from A1 to C4.
Workbook workbook = new Workbook();
Worksheet sheet = workbook.Worksheets[0];

sheet.Range["A1"].NumberValue = 582;
sheet.Range["A2"].NumberValue = 234;
sheet.Range["A3"].NumberValue = 314;
sheet.Range["A4"].NumberValue = 50;
sheet.Range["B1"].NumberValue = 150;
sheet.Range["B2"].NumberValue = 894;
sheet.Range["B3"].NumberValue = 560;
sheet.Range["B4"].NumberValue = 900;
sheet.Range["C1"].NumberValue = 134;
sheet.Range["C2"].NumberValue = 700;
sheet.Range["C3"].NumberValue = 920;
sheet.Range["C4"].NumberValue = 450;
sheet.AllocatedRange.RowHeight = 15;
sheet.AllocatedRange.ColumnWidth = 17;
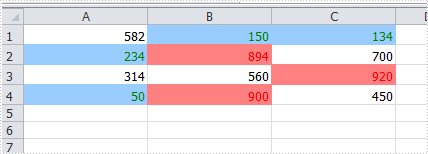
Step 2: To highlight cells based on their values, we create two conditional formatting rules: one for cells greater than 800, and another for cells less than 300.
XlsConditionalFormats xcfs1 = sheet.ConditionalFormats.Add();
xcfs1.AddRange(sheet.AllocatedRange);

IConditionalFormat cf1 = xcfs1.AddCondition();
cf1.FormatType = ConditionalFormatType.CellValue;
cf1.FirstFormula = "800";
cf1.Operator = ComparisonOperatorType.Greater;
cf1.FontColor = Color.Red;
cf1.BackColor = Color.LightSalmon;

Apply Data Bars:
IConditionalFormat cf3 = xcfs1.AddCondition();
cf3.FormatType = ConditionalFormatType.DataBar;
cf3.DataBar.BarColor = Color.CadetBlue;

Apply Icon Sets:
IConditionalFormat cf4 = xcfs1.AddCondition();
cf4.FormatType = ConditionalFormatType.IconSet;

Apply Color Scales:
IConditionalFormat cf5 = xcfs1.AddCondition();
cf5.FormatType = ConditionalFormatType.ColorScale;
Step 3: Save and launch the file
workbook.SaveToFile("sample.xlsx", ExcelVersion.Version2010);
System.Diagnostics.Process.Start("sample.xlsx");
Result:
The cells with value bigger than 800 and smaller than 300, have been highlighted with defined text color and background color.
Apply the Other Three Conditional Formatting Types:
Spire.XLS also supports applying some other conditional formatting types which were predefined in MS Excel. Use the following code snippets to get more formatting effects.
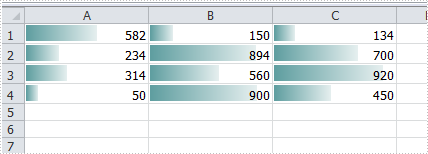
Apply Data Bars:
ConditionalFormatWrapper format = sheet.AllocatedRange.ConditionalFormats.AddCondition();
format.FormatType = ConditionalFormatType.DataBar;
format.DataBar.BarColor = Color.CadetBlue;
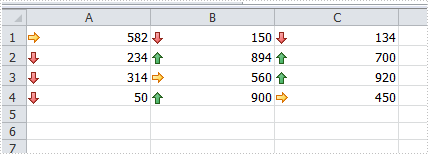
Apply Icon Sets:
ConditionalFormatWrapper format = sheet.AllocatedRange.ConditionalFormats.AddCondition();
format.FormatType = ConditionalFormatType.IconSet;
Apply Color Scales:
ConditionalFormatWrapper format = sheet.AllocatedRange.ConditionalFormats.AddCondition();
format.FormatType = ConditionalFormatType.ColorScale;
Full Code:
using Spire.Xls;
using Spire.Xls.Core;
using Spire.Xls.Core.Spreadsheet.Collections;
using System.Drawing;

namespace ApplyConditionalFormatting
{
    class Program
    {
        static void Main(string[] args)
        {
            // Create a new workbook and get the first worksheet
            Workbook workbook = new Workbook();
            Worksheet sheet = workbook.Worksheets[0];

            // Populate sample data in cells A1:C4
            sheet.Range["A1"].NumberValue = 582;
            sheet.Range["A2"].NumberValue = 234;
            sheet.Range["A3"].NumberValue = 314;
            sheet.Range["A4"].NumberValue = 50;
            sheet.Range["B1"].NumberValue = 150;
            sheet.Range["B2"].NumberValue = 894;
            sheet.Range["B3"].NumberValue = 560;
            sheet.Range["B4"].NumberValue = 900;
            sheet.Range["C1"].NumberValue = 134;
            sheet.Range["C2"].NumberValue = 700;
            sheet.Range["C3"].NumberValue = 920;
            sheet.Range["C4"].NumberValue = 450;
            sheet.AllocatedRange.RowHeight = 15;
            sheet.AllocatedRange.ColumnWidth = 17;

            // Create a conditional formatting rule set applied to the entire used range
            XlsConditionalFormats xcfs1 = sheet.ConditionalFormats.Add();
            xcfs1.AddRange(sheet.AllocatedRange);

            // Rule 1: Highlight cells with values greater than 800 in red text and light salmon background
            IConditionalFormat cf1 = xcfs1.AddCondition();
            cf1.FormatType = ConditionalFormatType.CellValue;
            cf1.FirstFormula = "800";
            cf1.Operator = ComparisonOperatorType.Greater;
            cf1.FontColor = Color.Red;
            cf1.BackColor = Color.LightSalmon;

            // Rule 2: Highlight cells with values less than 300 in green text and light blue background
            IConditionalFormat cf2 = xcfs1.AddCondition();
            cf2.FormatType = ConditionalFormatType.CellValue;
            cf2.FirstFormula = "300";
            cf2.Operator = ComparisonOperatorType.Less;
            cf2.FontColor = Color.Green;
            cf2.BackColor = Color.LightBlue;

            //// Rule 3: Add data bars
            //IConditionalFormat cf3 = xcfs1.AddCondition();
            //cf3.FormatType = ConditionalFormatType.DataBar;
            //cf3.DataBar.BarColor = Color.CadetBlue;

            //// Rule 4: Apply icon set
            //IConditionalFormat cf4 = xcfs1.AddCondition();
            //cf4.FormatType = ConditionalFormatType.IconSet;

            //// Rule 5: Apply color scale
            //IConditionalFormat cf5 = xcfs1.AddCondition();
            //cf5.FormatType = ConditionalFormatType.ColorScale;

            workbook.SaveToFile("sample.xlsx", ExcelVersion.Version2010);
            System.Diagnostics.Process.Start("sample.xlsx");
        }
    }
}
