 Pandas�?데이�?조작 �?분석�?위한 기본 라이브러리입니다. 종종 개발자는 보고, 팀 공동 작업 또는 추가 데이�?분석�?위해 Pandas DataFrame�?Excel�?내보내야 합니�? Pandas�?기본 내보내기�?위한 to_excel 함수�?제공하지�?서식�?지정된 헤더, 스타일이 지정된 셀, 여러 시트 �?차트가 포함�?전문적인 Excel 보고서를 만드�?것은 어려�?�?있습니다.
�?자습서에서는 Microsoft Excel�?설치�?필요 없이 Python에서 직접 Excel 파일�?완벽하게 사용�?정의�?�?있는 다기�?Excel 라이브러리인 Spire.XLS for Python�?사용하여 단일 DataFrame 또는 여러 DataFrame�?Excel�?쓰는 방법�?보여줍니�?
목차
- Pandas DataFrame�?Excel�?변환하�?�?Spire.XLS�?사용하는 이유
- Pandas DataFrame�?Excel�?변환하�?위한 전제 조건
- 서식�?있는 단일 Pandas DataFrame�?Excel�?내보내기
- 여러 Pandas DataFrame�?하나�?Excel 파일�?변�?/a>
- 기존 Excel 파일�?Pandas DataFrame 쓰기
- Pandas DataFrame�?Excel�?내보내기 위한 고급 사용�?정의
- 결론
- 자주 묻는 질문
Pandas DataFrame�?Excel�?변환하�?�?Spire.XLS�?사용하는 이유
Pandas�?기본 Excel 내보내기 기능�?제공하지�?Spire.XLS�?Excel 파일 생성�?완벽하게 제어하여 이를 확장합니�? 개발자는 원시 데이터를 쓰는 대�?다음�?수행�?�?있습니다.
- 여러 DataFrame�?단일 통합 문서 내의 별도 시트�?구성합니�?
- 헤더, 글�? 색상 �?셀 서식�?사용�?정의하여 전문적인 레이아웃�?만듭니다.
- 가독성�?높이�?위해 열을 자동 맞춤하고 �?높이�?조정합니�?
- Python에서 직접 차트, 수식 �?기타 Excel 기능�?추가합니�?
Pandas DataFrame�?Excel�?변환하�?위한 전제 조건
Pandas DataFrame�?Excel�?내보내기 전에 다음 필수 라이브러리가 설치되어 있는지 확인하십시오. 프로젝트 터미널에�?다음 명령�?실행하여 �?작업�?수행�?�?있습니다.
pip install pandas spire.xls
이러�?라이브러리를 사용하면 여러 시트, 사용�?정의 서식, 매력적인 차트 �?구조화된 레이아웃으로 DataFrame�?Excel�?�?�?있습니다.
서식�?있는 단일 Pandas DataFrame�?Excel�?내보내기
단일 DataFrame�?Excel 파일�?내보내는 것이 가�?일반적인 시나리오입니�? Spire.XLS�?사용하면 DataFrame�?내보�?�?있을 뿐만 아니�?헤더 서식�?지정하�?셀 스타일을 지정하�?차트�?추가하여 보고서를 전문가처럼 보이�?만들 �?있습니다.
�?과정�?단계별로 살펴보겠습니�?
1단계: 샘플 DataFrame 만들�?/h3>
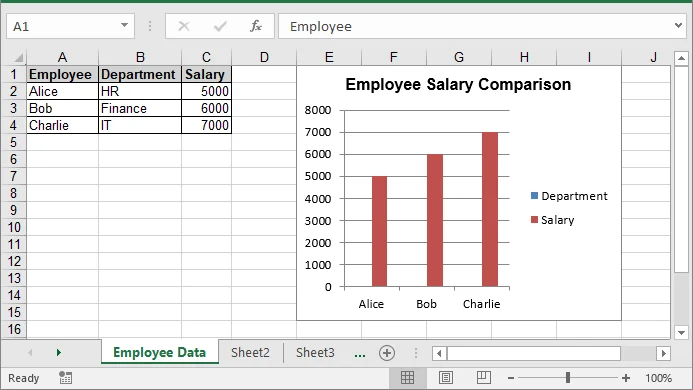
먼저 DataFrame�?만들어야 합니�? 여기에는 직원 이름, 부�?�?급여가 있습니다. 물론 이것�?자신�?데이�?세트�?바꿀 �?있습니다.
import pandas as pd
from spire.xls import *

# Create a simple DataFrame
df = pd.DataFrame({
    'Employee': ['Alice', 'Bob', 'Charlie'],
    'Department': ['HR', 'Finance', 'IT'],
    'Salary': [5000, 6000, 7000]
})
2단계: 통합 문서 만들�?�?�?번째 시트 액세�?/h3>
이제 �?Excel 통합 문서�?만들�?�?번째 워크시트�?준비합니다. 이해하기 쉽도�?의미 있는 이름�?지정해 보겠습니�?
# Create a new workbook
workbook = Workbook()
sheet = workbook.Worksheets[0]
sheet.Name = "Employee Data"
3단계: �?헤더 쓰기
헤더�?�?번째 행에 쓰고 굵게 표시하고 밝은 회색 배경�?추가하여 모든 것이 깔끔하게 보이도록 합니�?
# Write column headers
for colIndex, colName in enumerate(df.columns, start=1):
    cell = sheet.Range[1, colIndex]
    cell.Text = colName
    cell.Style.Font.IsBold = True                # Make headers bold
    cell.Style.Color = Color.get_LightGray()     # Light gray background
4단계: 데이�?�?쓰기
다음으로 DataFrame�?�?행을 씁니�? 숫자�?경우 NumberValue 속성�?사용하여 Excel�?계산 �?차트�?대�?인식�?�?있도�?합니�?
# Write data rows
for rowIndex, row in enumerate(df.values, start=2):
    for colIndex, value in enumerate(row, start=1):
        cell = sheet.Range[rowIndex, colIndex]
        if isinstance(value, (int, float)):
            cell.NumberValue = value
        else:
            cell.Text = str(value)
5단계: 테두�?적용 �?�?자동 맞춤
Excel 시트�?세련�?테이�?모양�?부여하�?위해 테두리를 추가하고 �?너비�?자동으로 조정�?보겠습니�?
# Apply borders and auto-fit columns
usedRange = sheet.AllocatedRange
usedRange.BorderAround(LineStyleType.Thin, Color.get_Black()) # Outside borders
usedRange.BorderInside(LineStyleType.Thin, Color.get_Black()) # Inside borders
usedRange.AutoFitColumns()
6단계: 데이�?시각화를 위한 차트 추가
차트�?추세�?빠르�?이해하는 �?도움�?됩니�? 여기서는 급여�?비교하는 세로 막대�?차트�?만들 것입니다.
# Add a chart
chart = sheet.Charts.Add()
chart.ChartType = ExcelChartType.ColumnClustered
chart.DataRange = sheet.Range["A1:C4"]        # Data range for chart
chart.SeriesDataFromRange = False
chart.LeftColumn = 5                          # Chart position
chart.TopRow = 1
chart.RightColumn = 10
chart.BottomRow = 16
chart.ChartTitle = "Employee Salary Comparison"
chart.ChartTitleArea.Font.Size = 12
chart.ChartTitleArea.Font.IsBold = True
7단계: 통합 문서 저�?/h3>
마지막으�?통합 문서�?원하�?위치�?저장합니다.
# Save the Excel file
workbook.SaveToFile("DataFrameWithChart.xlsx", ExcelVersion.Version2016)
workbook.Dispose()
결과:
Pandas DataFrame에서 생성�?Excel XLSX 파일은 다음�?같습니다.
 workbook.SaveToFile("ToPdf.pdf", FileFormat.PDF)
자세�?내용은 Python에서 Excel�?PDF�?변�?/a>하는 가이드�?참조하십시오.
여러 Pandas DataFrame�?하나�?Excel 파일�?변�?/h2>
Excel 보고서를 만들 �?여러 데이�?세트�?별도�?시트�?배치해야 하는 경우가 많습니다. Spire.XLS�?사용하면 �?Pandas DataFrame�?자체 워크시트�?�?�?있으므�?관�?데이터가 명확하게 구성되고 분석하기 쉽습니다. 다음 단계�?�?워크플로�?보여줍니�?
1단계: 여러 샘플 DataFrame 만들�?/h3>
내보내기 전에 직원 정보용과 제품용으�?�?개의 개별 DataFrame�?만듭니다. �?DataFrame은 자체 Excel 시트�?들어갑니�?
import pandas as pd
from spire.xls import *

# Sample DataFrames
df1 = pd.DataFrame({'Name': ['Alice', 'Bob'], 'Age': [25, 30]})
df2 = pd.DataFrame({'Product': ['Laptop', 'Phone'], 'Price': [1000, 500]})

# List of DataFrames with corresponding sheet names
dataframes = [
    (df1, "Employees"),
    (df2, "Products")
]
여기�?dataframes�?�?DataFrame�?표시되어�?하는 시트 이름�?쌍으�?연결하는 튜플 목록입니�?
2단계: �?통합 문서 만들�?/h3>
다음으로 모든 DataFrame�?저장할 �?Excel 통합 문서�?만듭니다.
# Create a new workbook
workbook = Workbook()
이렇�?하면 �?개의 기본 시트가 있는 �?통합 문서가 초기화됩니다. 다음 단계에서 이름�?바꾸�?채울 것입니다.
3단계: �?DataFrame�?반복하고 자체 시트�?쓰기
�?DataFrame�?개별적으�?작성하는 대�?목록�?반복하고 동일�?방식으로 처리�?�?있습니다. 이렇�?하면 중복 코드가 줄어들고 �?많은 데이�?세트�?�?쉽게 처리�?�?있습니다.
for i, (df, sheet_name) in enumerate(dataframes):
    # Get or create a sheet
    if i < workbook.Worksheets.Count:
        sheet = workbook.Worksheets[i]
    else:
        sheet = workbook.Worksheets.Add()

    sheet.Name = sheet_name

    # Write headers with bold font and background color
    for colIndex, colName in enumerate(df.columns, start=1):
        cell = sheet.Range[1, colIndex]
        cell.Text = colName
        cell.Style.Font.IsBold = True
        cell.Style.Color = Color.get_LightGray()
        sheet.Columns[colIndex - 1].ColumnWidth = 15  # Set fixed column width

    # Write rows of data
    for rowIndex, row in enumerate(df.values, start=2):
        for colIndex, value in enumerate(row, start=1):
            cell = sheet.Range[rowIndex, colIndex]
            if isinstance(value, (int, float)):
                cell.NumberValue = value
            else:
                cell.Text = str(value)

    # Apply thin borders around the used range
    usedRange = sheet.AllocatedRange
    usedRange.BorderAround(LineStyleType.Thin, Color.get_Black()) # Outside borders
    usedRange.BorderInside(LineStyleType.Thin, Color.get_Black()) # Inside borders
�?루프�?사용하면 나중�?동일�?코드�?다시 작성하지 않고�?�?많은 DataFrame�?쉽게 추가�?�?있습니다.
4단계: 통합 문서 저�?/h3>
마지막으�?Excel 파일�?저장합니다. 이제 �?데이�?세트가 모두 별도�?시트, 서식�?지정된 헤더 �?적절�?테두리가 있는 하나�?파일�?깔끔하게 정리되었습니�?
# Save the workbook
workbook.SaveToFile("MultipleDataFrames.xlsx", ExcelVersion.Version2016)
workbook.Dispose()
이제 Excel 파일�?공유하거�?추가�?분석�?준비가 되었습니�?
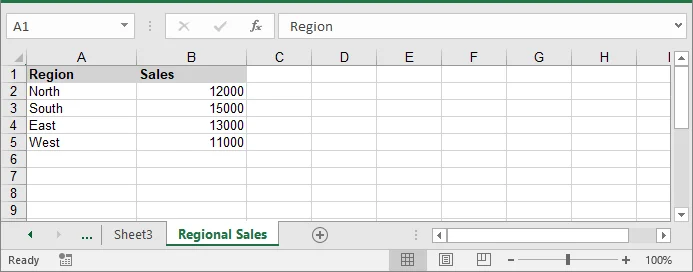
결과:

기존 Excel 파일�?Pandas DataFrame 쓰기
경우�?따라 �?Excel 파일�?만드�?대�?기존 통합 문서�?DataFrame�?써야 �?수도 있습니다. 기존 통합 문서�?로드하고 �?시트�?추가하거�?원하�?시트�?액세스한 다음 동일�?논리�?사용하여 DataFrame 데이터를 작성하면 �?작업�?쉽게 수행�?�?있습니다.
다음 코드�?Pandas DataFrame�?기존 Excel 파일�?쓰는 방법�?보여줍니�?
import pandas as pd
from spire.xls import *

# Load an existing Excel file
workbook = Workbook()
workbook.LoadFromFile("MultipleDataFrames.xlsx")

# Create a new DataFrame to add
new_df = pd.DataFrame({
    'Region': ['North', 'South', 'East', 'West'],
    'Sales': [12000, 15000, 13000, 11000]
})

# Add a new worksheet for the new DataFrame
new_sheet = workbook.Worksheets.Add("Regional Sales")

# Write headers
for colIndex, colName in enumerate(new_df.columns, start=1):
    cell = new_sheet.Range[1, colIndex]
    cell.Text = colName
    cell.Style.Font.IsBold = True
    cell.Style.Color = Color.get_LightGray()
    new_sheet.Columns[colIndex - 1].ColumnWidth = 15

# Write data rows
for rowIndex, row in enumerate(new_df.values, start=2):
    for colIndex, value in enumerate(row, start=1):
        cell = new_sheet.Range[rowIndex, colIndex]
        if isinstance(value, (int, float)):
            cell.NumberValue = value
        else:
            cell.Text = str(value)

# Save the changes
workbook.SaveToFile("DataFrameToExistingWorkbook.xlsx", ExcelVersion.Version2016)
workbook.Dispose()
Pandas DataFrame�?Excel�?내보내기 위한 고급 사용�?정의
기본 내보내기 외에�?특정 보고 요구 사항�?충족하도�?Excel에서 Pandas DataFrame�?사용�?정의�?�?있습니다. 특정 �?선택, 인덱�?포함 또는 제외와 같은 고급 옵션�?사용하면 �?깨끗하고 읽기 쉬우�?전문적인 Excel 파일�?만들 �?있습니다. 다음 예에서는 이러�?사용�?정의�?적용하는 방법�?보여줍니�?
1. 특정 �?선택
경우�?따라 DataFrame�?모든 열을 내보�?필요가 없을 수도 있습니다. 관�?열만 선택하여 Excel 보고서를 간결하고 집중적으�?유지�?�?있습니다. 다음 코드�?헤더와 행을 작성�?�?선택�?열을 반복하는 방법�?보여줍니�?
import pandas as pd
from spire.xls import *

# Create a DataFrame
df = pd.DataFrame({
    'Employee': ['Alice', 'Bob', 'Charlie'],
    'Department': ['HR', 'Finance', 'IT'],
    'Salary': [5000, 6000, 7000]
})

# Set the columns to export
columns_to_export = ['Employee', 'Department']

# Create a new workbook and access the first sheet
workbook = Workbook()
sheet = workbook.Worksheets[0]

# Write headers
for colIndex, colName in enumerate(columns_to_export, start=1):
    sheet.Range[1, colIndex].Text = colName

# Write rows
for rowIndex, row in enumerate(df[columns_to_export].values, start=2):
    for colIndex, value in enumerate(row, start=1):
        sheet.Range[rowIndex, colIndex].Text = value

# Save the Excel file
workbook.SaveToFile("select_columns.xlsx")
workbook.Dispose()
2. 인덱�?포함 또는 제외
기본적으�?DataFrame 인덱스는 내보내기�?포함되지 않습니다. 보고서에 �?식별자나 숫자 인덱스가 필요�?경우 수동으로 추가�?�?있습니다. �?코드 조각은 선택�?열과 함께 인덱스를 포함하는 방법�?보여줍니�?
# Write header for index
sheet.Range[1, 1].Text = "Index"

# Write index values (numeric)
for rowIndex, idx in enumerate(df.index, start=2):
    sheet.Range[rowIndex, 1].NumberValue = idx  # Use NumberValue for numeric

# Write headers for other columns
for colIndex, colName in enumerate(columns_to_export, start=2):
    sheet.Range[1, colIndex].Text = colName

# Write the data rows
for rowIndex, row in enumerate(df[columns_to_export].values, start=2):
    for colIndex, value in enumerate(row, start=2):
        if isinstance(value, (int, float)):
            sheet.Range[rowIndex, colIndex].NumberValue = value
        else:
            sheet.Range[rowIndex, colIndex].Text = str(value)

# Save the workbook
workbook.SaveToFile("include_index.xlsx", ExcelVersion.Version2016)
workbook.Dispose()
결론
Pandas DataFrame�?Excel�?내보내는 것은 간단하지�?전문적이�?�?서식�?보고서를 작성하려�?추가 제어가 필요합니�? 데이�?준비를 위해 Pandas�?사용하고 Excel 파일�?만들�?서식�?지정하�?위해 Spire.XLS for Python�?사용하면 구조화되�?읽기 쉬우�?시각적으�?구성�?통합 문서�?생성�?�?있습니다. �?접근 방식은 단일 DataFrame�?여러 데이�?세트 모두�?적용되므�?분석, 공유 또는 추가 조작�?위해 준비된 Excel 보고서를 쉽게 만들 �?있습니다.
자주 묻는 질문
Q1: Python에서 Pandas DataFrame�?Excel�?어떻�?내보�?�?있나�?
A1: Spire.XLS와 같은 라이브러리를 사용하여 DataFrame�?Excel 파일�?�?�?있습니다. 이를 통해 서식 �?레이아웃�?대�?제어�?유지하면�?테이�?형식 데이터를 Python에서 Excel�?전송�?�?있습니다.
Q2: �?이상�?DataFrame�?단일 Excel 파일�?내보�?�?있나�?
A2: �? 여러 DataFrame�?동일�?통합 문서 내의 별도 시트�?�?�?있습니다. 이렇�?하면 관�?데이�?세트�?하나�?파일�?정리하는 �?도움�?됩니�?
Q3: DataFrame에서 Excel�?헤더�?추가하고 셀 서식�?어떻�?지정하나요?
A3: 헤더�?굵게 표시하거�?색상�?지정하거나 고정 너비�?가�?�?있습니다. 숫자 값은 숫자�? 텍스트는 문자열로 저장할 �?있습니다. 서식�?지정하�?보고서의 가독성�?향상됩니�?
Q4: 내보�?Excel 파일�?차트�?포함�?�?있나�?
A4: �? DataFrame 데이터를 기반으로 세로 막대�?또는 꺾은선형 차트와 같은 차트�?추가하여 추세�?비교�?시각화하�?�?도움�?�?�?있습니다.
Q5: DataFrame�?내보내려�?Microsoft Excel�?설치되어 있어�?하나�?
A5: 반드�?그렇지�?않습니다. Spire.XLS�?포함�?일부 라이브러리는 Excel 설치�?의존하지 않고 Python 내에�?전적으로 Excel 파일�?만들�?서식�?지정할 �?있습니다.
참고 항목
- Python에서 CSV�?JSON으로 변환하�?방법
- Python에서 JSON�?CSV�?- 전체 가이드
- Python에서 XML�?CSV�?변환하�?방법
- Python에서 CSV�?XML�?변�?/a>