
JavaScript (76)
Transforming PowerPoint presentations into image formats such as JPG or PNG is an effective method for enhancing the way you share visual content. By converting slides into images, you maintain the integrity of the design and layout, making it suitable for a wide range of uses, from online sharing to embedding in documents.
In this article, you will discover how to convert PowerPoint slides to images in React using Spire.Presentation for JavaScript. We will guide you through the process step-by-step, ensuring you can effortlessly create high-quality images from your presentations.
Install Spire.Presentation for JavaScript
To get started with converting PowerPoint to images in a React application, you can either download Spire.Presentation for JavaScript from the official website or install it via npm with the following command:
npm i spire.office
The downloaded product package integrates Spire.Doc for JavaScript, Spire.XLS for JavaScript, Spire.PDF for JavaScript, and Spire.Presentation for JavaScript. To use Spire.Presentation for JavaScript functionality, you need to copy the corresponding files (spire.presentation.js, Spire.Presentation.Wasm.zip, spire.common.js, Spire.Common.Wasm.zip, and the _framework folder) to the public folder of your project. Additionally, to ensure proper text rendering, font files can be added to a custom path of your choice. In the following example, the font addition path is: public\static\font.
For more details, refer to the documentation: How to Integrate Spire.Presentation for JavaScript in a React Project.
Convert PowerPoint to PNG or JPG with JavaScript
Using Spire.Presentation for JavaScript, you can access a specific slide with the Presentation.Slides.get_Item() method. Once you have the slide, convert it to image data using ISlide.SaveAsImage(). You can then save the image in PNG or JPG format. To convert each slide into a separate image file, simply iterate through the slides and perform the conversion for each one.
The steps to convert PowerPoint to PNG or JPG using JavaScript are as follows:
- Load required font files into the virtual file system (VFS).
- Instantiate a new document using the wasmModule.Presentation() method
- Load the PowerPoint document using the Presentation.LoadFromFile() method.
- Loop through the slides in the document:
- Get a specific slide using the Presentation.Slides.get_Item() method.
- Convert the slide into image data using the ISlide.SaveAsImage() method.
- Save the image data to a PNG or JPG file using the Save() method of the image data object.
- Create a Blob object from the generated image file.
- Trigger the download of the image file.
- JavaScript
import React, { useState, useEffect } from 'react';

function App() {
   const [wasmModule, setWasmModule] = useState(null);
   useEffect(() => {
    (async () => {
      try {
        const publicUrl = process.env.PUBLIC_URL || '';
        const spireModule = await import(/* webpackIgnore: true */ `${publicUrl}/spire.presentation.js`);
        const rawModule = spireModule.default || spireModule;
        window.wasmModule = typeof rawModule === 'function'
          ? await rawModule({ locateFile: p => p.endsWith('.wasm') ? `${publicUrl}/${p}` : p })
          : rawModule;
        setWasmModule(window.wasmModule);
      } catch (error) {
        console.error('Failed to load spire.presentation.js:', error);
      }
    })();
  }, []);

  const PowerPointToPNG = async () => {
    const wasmModule = window.wasmModule.spirepresentation;

    if (wasmModule) {
      // Specify the input file paths
      let inputFileName  = "Sample.pptx";
      await window.spire.FetchFileToVFS(inputFileName , '',  `${process.env.PUBLIC_URL}static/data/`);
      await window.spire.FetchFileToVFS("arial.ttf","/Library/Fonts/",`${process.env.PUBLIC_URL}static/font/`);

      // Create a Presentation instance and load the PowerPoint file from the virtual file system
      const presentation =new wasmModule.Presentation();
      presentation.LoadFromFile(inputFileName);

      // Iterate through the slides
      for (let i = 0; i < presentation.Slides.Count; i++) {

        // Convert a specific slide into image data
        let image = presentation.Slides.get_Item(i).SaveAsImage();

        // Specify the output file name
        let outputFileName = `ToImage_img_${i}.png`;

        // Save each image in virtual storage
        image.Save(outputFileName);

        // Read the generated image file from VFS
        const imageFileArray =  window.dotnetRuntime.Module.FS.readFile(outputFileName);

        // Create a Blog object from the image file
        const imageBlob = new Blob([imageFileArray], { type: "image/png" });

        // Create a URL for the Blob
        const url = URL.createObjectURL(imageBlob);

        // Create an anchor element to trigger the download
        const a = document.createElement('a');
        a.href = url;
        a.download = outputFileName;
        document.body.appendChild(a);
        a.click();
        document.body.removeChild(a);
        URL.revokeObjectURL(url);
      };

      // Clean up resources
      presentation.Dispose();
    }
  };

  return (
    <div style={{ textAlign: 'center', height: '300px' }}>
      <h1>Convert PowerPoint to PNG in React</h1>
      <button onClick={PowerPointToPNG} disabled={!wasmModule}>
        Generate
      </button>
    </div>
  );
}

export default App;
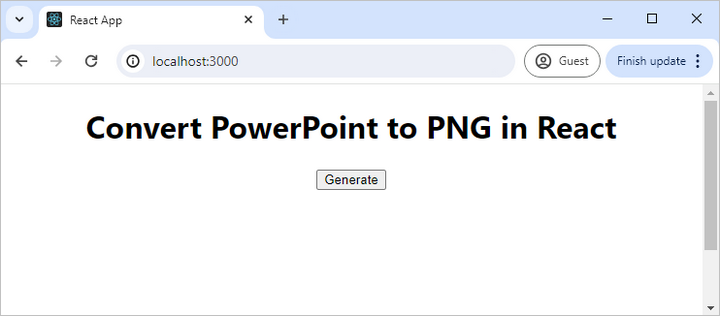
Run the code to launch the React app at localhost:3000. Click "Generate", and a "Save As" window will appear, prompting you to save the output file in your chosen folder.
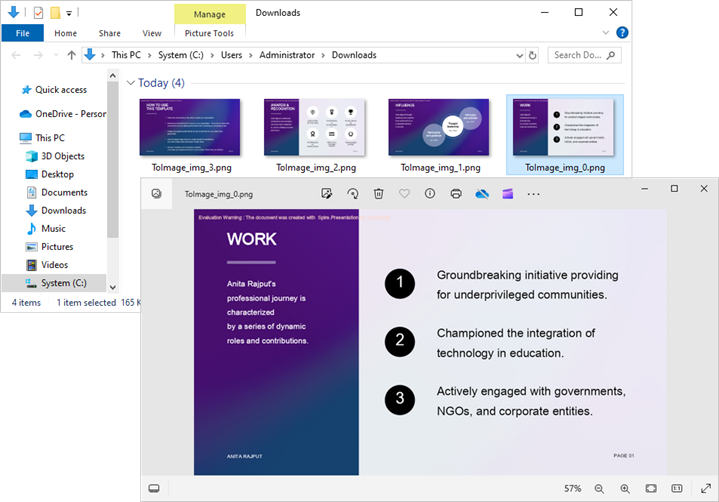
Below is a screenshot of the generated PNG image files:
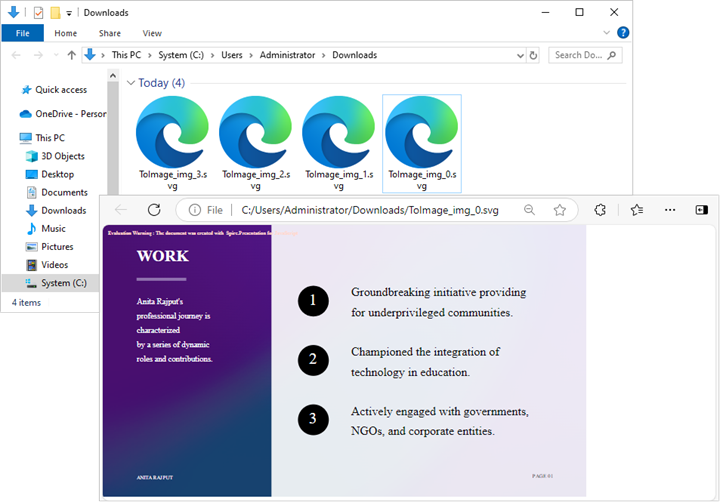
Convert PowerPoint to SVG with JavaScript
Spire.Presentation for JavaScript provides the ISlide.SaveToSVG() method, allowing you to convert a slide into SVG byte data. This byte data can then be saved as an SVG file using the Save() method.
The following are the steps to convert PowerPoint to SVG using JavaScript:
- Load required font files into the virtual file system (VFS).
- Instantiate a new document using the wasmModule.Presentation() method
- Load the PowerPoint document using the Presentation.LoadFromFile() method.
- Loop through the slides in the document:
- Get a specific slide using the Presentation.Slides.get_Item() method.
- Convert the slide into SVG byte data using the ISlide.SaveToSVG() method.
- Save the byte data to an SVG file using the Save() method.
- Create a Blob object from the generated image file.
- Trigger the download of the image file.
- JavaScript
import React, { useState, useEffect } from 'react';

function App() {
   const [wasmModule, setWasmModule] = useState(null);
   useEffect(() => {
    (async () => {
      try {
        const publicUrl = process.env.PUBLIC_URL || '';
        const spireModule = await import(/* webpackIgnore: true */ `${publicUrl}/spire.presentation.js`);
        const rawModule = spireModule.default || spireModule;
        window.wasmModule = typeof rawModule === 'function'
          ? await rawModule({ locateFile: p => p.endsWith('.wasm') ? `${publicUrl}/${p}` : p })
          : rawModule;
        setWasmModule(window.wasmModule);
      } catch (error) {
        console.error('Failed to load spire.presentation.js:', error);
      }
    })();
  }, []);


  const PowerPointToSVG = async () => {
    const wasmModule = window.wasmModule.spirepresentation;

    if (wasmModule) {
      // Specify the input file paths
      let inputFileName  = "Sample.pptx";
      await window.spire.FetchFileToVFS(inputFileName , '',  `${process.env.PUBLIC_URL}static/data/`);
      await window.spire.FetchFileToVFS("arial.ttf","/Library/Fonts/",`${process.env.PUBLIC_URL}static/font/`);

      // Create a Presentation instance and load the PowerPoint file from the virtual file system
      const presentation =new wasmModule.Presentation();
      presentation.LoadFromFile(inputFileName);

      // Iterate through the slides
      for (let i = 0; i < presentation.Slides.Count; i++) {
        let svgBytes = presentation.Slides.get_Item(i).SaveToSVG();
        let outputFileName = `ToSVG-${i}.svg`;

        // Save each image in virtual storage
        let stream = new wasmModule.Stream(svgBytes);
        stream.Save(outputFileName);
        const imageFileArray = window.dotnetRuntime.Module.FS.readFile(outputFileName);
        const imageBlob = new Blob([imageFileArray], { type: "image/svg" });

        // Create a URL for the Blob
        const url = URL.createObjectURL(imageBlob);

        // Create an anchor element to trigger the download
        const a = document.createElement('a');
        a.href = url;
        a.download = outputFileName;
        document.body.appendChild(a);
        a.click();
        document.body.removeChild(a);
        URL.revokeObjectURL(url);
          stream.Dispose();
        }
      // Clean up resources
      presentation.Dispose();
    }
  };

  return (
    <div style={{ textAlign: 'center', height: '300px' }}>
      <h1>Convert PowerPoint to SVG in React</h1>
      <button onClick={PowerPointToSVG} disabled={!wasmModule}>
        Generate
      </button>
    </div>
  );
}


export default App;
Convert PowerPoint to TIFF with JavaScript
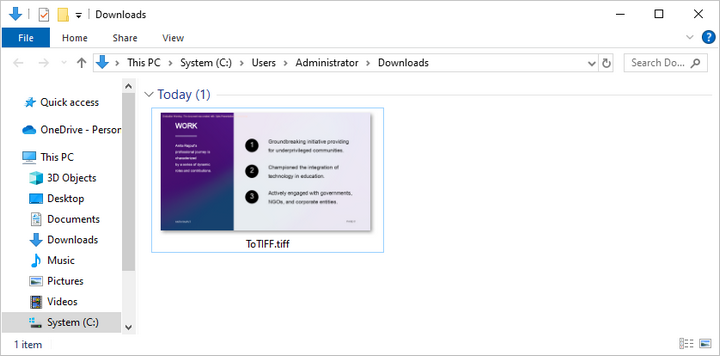
Spire.Presentation for JavaScript includes the Presentation.SaveToFile() method, which allows you to convert an entire PowerPoint document into a multi-frame TIFF image seamlessly.
The following are the steps to convert PowerPoint to TIFF using JavaScript:
- Load required font files into the virtual file system (VFS).
- Instantiate a new document using the wasmModule.Presentation() method
- Load the PowerPoint document using the Presentation.LoadFromFile() method.
- Convert the document to a TIFF image file using the Presenatation.SaveToFile() method.
- Create a Blob object from the generated image file.
- Trigger the download of the image file.
- JavaScript
import React, { useState, useEffect } from 'react';

function App() {
   const [wasmModule, setWasmModule] = useState(null);
   useEffect(() => {
    (async () => {
      try {
        const publicUrl = process.env.PUBLIC_URL || '';
        const spireModule = await import(/* webpackIgnore: true */ `${publicUrl}/spire.presentation.js`);
        const rawModule = spireModule.default || spireModule;
        window.wasmModule = typeof rawModule === 'function'
          ? await rawModule({ locateFile: p => p.endsWith('.wasm') ? `${publicUrl}/${p}` : p })
          : rawModule;
        setWasmModule(window.wasmModule);
      } catch (error) {
        console.error('Failed to load spire.presentation.js:', error);
      }
    })();
  }, []);


  const PowerPointToTIFF = async () => {
    const wasmModule = window.wasmModule.spirepresentation;

    if (wasmModule) {
      // Specify the input file paths
      let inputFileName  = "Sample.pptx";
      await window.spire.FetchFileToVFS(inputFileName , '',  `${process.env.PUBLIC_URL}static/data/`);
      await window.spire.FetchFileToVFS("arial.ttf","/Library/Fonts/",`${process.env.PUBLIC_URL}static/font/`);

      // Create a Presentation instance and load the PowerPoint file from the virtual file system
      const presentation =new wasmModule.Presentation();
      // Load the PowerPoint file
      presentation.LoadFromFile(inputFileName);

      // Specify the output file name
      const outputFileName = "ToTIFF.tiff"

      // Save the document to TIFF
      presentation.SaveToFile({ file: outputFileName, fileFormat: wasmModule.FileFormat.Tiff });

      // Read the generated image file from VFS
      const imageFileArray = window.dotnetRuntime.Module.FS.readFile(outputFileName);

      // Create a Blog object from the image file
      const imageBlob = new Blob([imageFileArray], { type: "image/tiff" });

      // Create a URL for the Blob
      const url = URL.createObjectURL(imageBlob);

      // Create an anchor element to trigger the download
      const a = document.createElement('a');
      a.href = url;
      a.download = outputFileName;
      document.body.appendChild(a);
      a.click();
      document.body.removeChild(a);
      URL.revokeObjectURL(url);

      // Clean up resources
      presentation.Dispose();
    }
  };

  return (
    <div style={{ textAlign: 'center', height: '300px' }}>
      <h1>Convert PowerPoint to TIFF in React</h1>
      <button onClick={PowerPointToTIFF} disabled={!wasmModule}>
        Generate
      </button>
    </div>
  );
}


export default App;
Get a Free License
To fully experience the capabilities of Spire.Presentation for JavaScript without any evaluation limitations, you can request a free 30-day trial license.
Converting PowerPoint presentations to PDF ensures that slide content remains intact while making the file easier to share and view across different devices. The PDF format preserves the original layout, text, and images, preventing unintended modifications and ensuring consistent formatting. This conversion is especially useful for professional and academic settings, where maintaining document integrity and accessibility is essential. Additionally, PDFs offer enhanced security features, such as restricted editing and password protection, making them a reliable choice for distributing important presentations. In this article, we will demonstrate how to convert PowerPoint presentations to PDF in React using Spire.Presentation for JavaScript.
- Convert a PowerPoint Presentation to PDF
- Convert a PowerPoint Presentation to PDF with a Custom Page Size
- Convert a PowerPoint Slide to PDF
Install Spire.Presentation for JavaScript
To get started with converting PowerPoint to PDF in a React application, you can either download Spire.Presentation for JavaScript from the official website or install it via npm with the following command:
npm i spire.office
The downloaded product package integrates Spire.Doc for JavaScript, Spire.XLS for JavaScript, Spire.PDF for JavaScript, and Spire.Presentation for JavaScript. To use Spire.Presentation for JavaScript functionality, you need to copy the corresponding files (spire.presentation.js, Spire.Presentation.Wasm.zip, spire.common.js, Spire.Common.Wasm.zip, and the _framework folder) to the public folder of your project. Additionally, to ensure proper text rendering, font files can be added to a custom path of your choice. In the following example, the font addition path is: public\static\font.
For more details, refer to the documentation: How to Integrate Spire.Presentation for JavaScript in a React Project.
Convert a PowerPoint Presentation to PDF
Converting a PowerPoint presentation to PDF allows you to share the entire document while preserving its original layout. Using the Presentation.SaveToFile() method, developers can export the full presentation to a PDF file. Below are the detailed steps to perform this operation.
- Create an object of Presentation class.
- Load a presentation file using Presentation.LoadFromFile() method.
- Save the presentation to a PDF document using Presentation.SaveToFile() method.
- JavaScript
import React, { useState, useEffect } from 'react';

function App() {
   const [wasmModule, setWasmModule] = useState(null);
   useEffect(() => {
    (async () => {
      try {
        const publicUrl = process.env.PUBLIC_URL || '';
        const spireModule = await import(/* webpackIgnore: true */ `${publicUrl}/spire.presentation.js`);
        const rawModule = spireModule.default || spireModule;
        window.wasmModule = typeof rawModule === 'function'
          ? await rawModule({ locateFile: p => p.endsWith('.wasm') ? `${publicUrl}/${p}` : p })
          : rawModule;
        setWasmModule(window.wasmModule);
      } catch (error) {
        console.error('Failed to load spire.presentation.js:', error);
      }
    })();
  }, []);

  const ConvertPowerPointToPDF = async () => {
    const wasmModule = window.wasmModule.spirepresentation;

    if (wasmModule) {
      // Specify the input file paths
      let inputFileName  = "Sample.pptx";
      await window.spire.FetchFileToVFS(inputFileName , '',  `${process.env.PUBLIC_URL}static/data/`);
      await window.spire.FetchFileToVFS("arial.ttf","/Library/Fonts/",`${process.env.PUBLIC_URL}static/font/`);

      // Create a Presentation instance and load the PowerPoint file from the virtual file system
      const ppt =new wasmModule.Presentation();
      ppt.LoadFromFile(inputFileName);

      // Define the output file name
      const outputFileName = "PowerPointToPDF.pdf";

      // Save the PowerPoint file to PDF format
      ppt.SaveToFile({ file: outputFileName, fileFormat: wasmModule.FileFormat.PDF });

      // Read the generated PDF file
      const modifiedFileArray = window.dotnetRuntime.Module.FS.readFile(outputFileName);

      // Create a Blob object from the PDF file
      const modifiedFile = new Blob([modifiedFileArray], { type: "application/pdf" });

      // Create a URL for the Blob
      const url = URL.createObjectURL(modifiedFile);

      // Create an anchor element to trigger the download
      const a = document.createElement('a');
      a.href = url;
      a.download = outputFileName;
      document.body.appendChild(a);
      a.click();
      document.body.removeChild(a);
      URL.revokeObjectURL(url);
    }
  };

  return (
    <div style={{ textAlign: 'center', height: '300px' }}>
      <h1>Convert a PowerPoint Presentation to PDF in React</h1>
      <button onClick={ConvertPowerPointToPDF} disabled={!wasmModule}>
        Convert
      </button>
    </div>
  );
}


export default App;
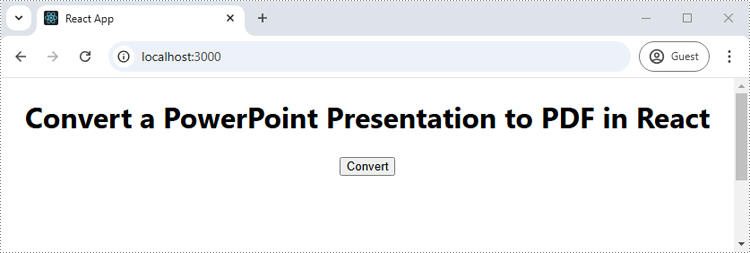
Run the code to launch the React app at localhost:3000. Once it's running, click on the "Convert" button to convert the PowerPoint presentation to PDF:
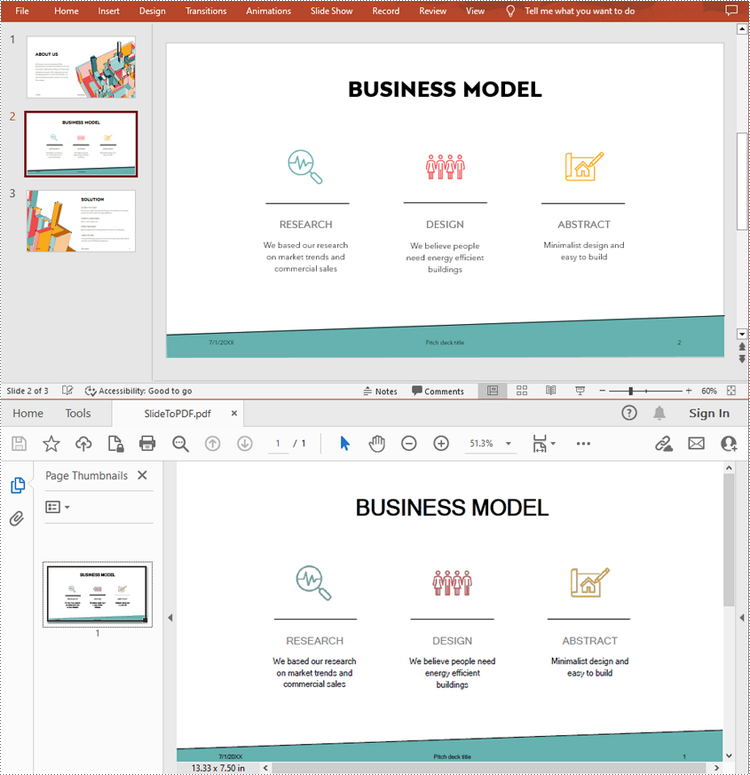
The below screenshot shows the input PowerPoint presentation and the converted PDF:

Convert a PowerPoint Presentation to PDF with a Custom Page Size
Developers can customize the page size of the resulting PDF by adjusting the slide size using the Presentation.SlideSize.Type property during conversion. This ensures that the converted PDF meets specific formatting or printing needs. Here are the detailed steps for this operation.
- Create an object of Presentation class.
- Load a presentation file using Presentation.LoadFromFile() method.
- Set the slide size to A4 using Presentation.SlideSize.Type property.
- Save the presentation to a PDF document using Presentation.SaveToFile() method.
- JavaScript
import React, { useState, useEffect } from 'react';

function App() {
   const [wasmModule, setWasmModule] = useState(null);
   useEffect(() => {
    (async () => {
      try {
        const publicUrl = process.env.PUBLIC_URL || '';
        const spireModule = await import(/* webpackIgnore: true */ `${publicUrl}/spire.presentation.js`);
        const rawModule = spireModule.default || spireModule;
        window.wasmModule = typeof rawModule === 'function'
          ? await rawModule({ locateFile: p => p.endsWith('.wasm') ? `${publicUrl}/${p}` : p })
          : rawModule;
        setWasmModule(window.wasmModule);
      } catch (error) {
        console.error('Failed to load spire.presentation.js:', error);
      }
    })();
  }, []);

  const ConvertPowerPointToPDF = async () => {
    const wasmModule = window.wasmModule.spirepresentation;

    if (wasmModule) {
      // Specify the input file paths
      let inputFileName  = "Sample.pptx";
      await window.spire.FetchFileToVFS(inputFileName , '',  `${process.env.PUBLIC_URL}static/data/`);
      await window.spire.FetchFileToVFS("arial.ttf","/Library/Fonts/",`${process.env.PUBLIC_URL}static/font/`);

      // Create a Presentation instance and load the PowerPoint file from the virtual file system
      const ppt =new wasmModule.Presentation();
      ppt.LoadFromFile(inputFileName);

      //Set A4 page size
      ppt.SlideSize.Type = wasmModule.SlideSizeType.A4;

      // Define the output file name
      const outputFileName = "ToPdfWithSpecificPageSize.pdf";

      // Save the PowerPoint file to PDF format
      ppt.SaveToFile({ file: outputFileName, fileFormat: wasmModule.FileFormat.PDF });

      // Read the generated PDF file
      const modifiedFileArray = window.dotnetRuntime.Module.FS.readFile(outputFileName);

      // Create a Blob object from the PDF file
      const modifiedFile = new Blob([modifiedFileArray], { type: "application/pdf" });

      // Create a URL for the Blob
      const url = URL.createObjectURL(modifiedFile);

      // Create an anchor element to trigger the download
      const a = document.createElement('a');
      a.href = url;
      a.download = outputFileName;
      document.body.appendChild(a);
      a.click();
      document.body.removeChild(a);
      URL.revokeObjectURL(url);
    }
  };

  return (
    <div style={{ textAlign: 'center', height: '300px' }}>
      <h1>Convert a PowerPoint Presentation to PDF with a Custom Page Size in React</h1>
      <button onClick={ConvertPowerPointToPDF} disabled={!wasmModule}>
        Convert
      </button>
    </div>
  );
}


export default App;

Convert a PowerPoint Slide to PDF
Converting a single PowerPoint slide to PDF allows for easy extraction and sharing of individual slides without exporting the entire presentation. Using the ISlide.SaveToFile() method, developers can convert individual slides to PDF with ease. The detailed steps for this operation are as follows.
- Create an object of the Presentation class.
- Load a presentation file using Presentation.LoadFromFile() method.
- Get a slide using Presentation.Slides.get_Item() method.
- Save the slide as a PDF document using ISlide.SaveToFile() method.
- JavaScript
import React, { useState, useEffect } from 'react';

function App() {
   const [wasmModule, setWasmModule] = useState(null);
   useEffect(() => {
    (async () => {
      try {
        const publicUrl = process.env.PUBLIC_URL || '';
        const spireModule = await import(/* webpackIgnore: true */ `${publicUrl}/spire.presentation.js`);
        const rawModule = spireModule.default || spireModule;
        window.wasmModule = typeof rawModule === 'function'
          ? await rawModule({ locateFile: p => p.endsWith('.wasm') ? `${publicUrl}/${p}` : p })
          : rawModule;
        setWasmModule(window.wasmModule);
      } catch (error) {
        console.error('Failed to load spire.presentation.js:', error);
      }
    })();
  }, []);

  const ConvertPowerPointSlideToPDF = async () => {
    const wasmModule = window.wasmModule.spirepresentation;

    if (wasmModule) {
      // Specify the input file paths
      let inputFileName  = "Sample.pptx";
      await window.spire.FetchFileToVFS(inputFileName , '',  `${process.env.PUBLIC_URL}static/data/`);
      await window.spire.FetchFileToVFS("arial.ttf","/Library/Fonts/",`${process.env.PUBLIC_URL}static/font/`);

      // Create a Presentation instance and load the PowerPoint file from the virtual file system
      const ppt =new wasmModule.Presentation();
      ppt.LoadFromFile(inputFileName);

      // Get the second slide
      let slide = ppt.Slides.get_Item(1);

      // Define the output file name
      const outputFileName = "SlideToPdf.pdf";

      // Save the slide to PDF format
      slide.SaveToFile( outputFileName, wasmModule.FileFormat.PDF);

      // Read the generated PDF file
      const modifiedFileArray = window.dotnetRuntime.Module.FS.readFile(outputFileName);

      // Create a Blob object from the PDF file
      const modifiedFile = new Blob([modifiedFileArray], { type: "application/pdf" });

      // Create a URL for the Blob
      const url = URL.createObjectURL(modifiedFile);

      // Create an anchor element to trigger the download
      const a = document.createElement('a');
      a.href = url;
      a.download = outputFileName;
      document.body.appendChild(a);
      a.click();
      document.body.removeChild(a);
      URL.revokeObjectURL(url);
    }
  };

  return (
    <div style={{ textAlign: 'center', height: '300px' }}>
      <h1>Convert a PowerPoint Slide to PDF in React</h1>
      <button onClick={ConvertPowerPointSlideToPDF} disabled={!wasmModule}>
        Convert
      </button>
    </div>
  );
}


export default App;
Get a Free License
To fully experience the capabilities of Spire.Presentation for JavaScript without any evaluation limitations, you can request a free 30-day trial license.

Spire.PDF for JavaScript is a leading PDF API that allows developers to easily create, read, edit, and convert PDFs. Using this JavaScript PDF component, developers can easily implement advanced features to create PDF files from scratch or fully process existing PDF documents within their JavaScript applications.
This versatile JavaScript library offers a wide range of features, including security settings, text/image extraction, PDF merging/splitting, drawing text/image/shape/barcodes, creating and filling in form fields, adding and deleting layers, overlaying PDFs, inserting watermarks (text/image), managing bookmarks, adding tables, adding annotations, and compressing PDF documents, among others.


Spire.Presentation for JavaScript Program Guide Content - React
2025-02-17 01:22:00 Written by Koohji
Spire.Presentation for JavaScript is a powerful presentation processing library designed for developers in JavaScript applications. It is fully compatible with popular JavaScript frameworks like Vue, React, and Angular. This compatibility allows developers to effortlessly integrate Spire.Presentation into their applications, enabling seamless creation, editing, conversion, and distribution of PowerPoint presentations directly within web-based projects.
As a standalone API, Spire.Presentation for JavaScript eliminates the need for Microsoft PowerPoint, making it highly efficient and flexible. Spire.Presentation for JavaScript supports Microsoft PowerPoint 97-2003 and Microsoft PowerPoint 2007, 2010, 2016, and 2019 (PPTX, PPSX).
How to Integrate Spire.Presentation for JavaScript in a React Project
2025-02-21 00:55:01 Written by AdministratorIn the ever-evolving world of web development, React continues to be the preferred framework for creating engaging and responsive user interfaces. For developers looking to enhance their applications with robust presentation capabilities, Spire.Presentation for JavaScript emerges as an invaluable resource.
In this guide, we'll explore the steps to effectively integrate Spire.Presentation for JavaScript into your React application, ensuring you can leverage its robust features for tasks such as generating slides, editing content, and exporting presentations in various formats.
- Benefits of Using Spire.Presentation for JavaScript in React
- Set Up Your Environment
- Integrate Spire.Presentation for JavaScript in Your Project
- Create and Save PowerPoint Files Using JavaScript
Benefits of Using Spire.Presentation for JavaScript in React
React, a powerful JavaScript library for building interactive user interfaces, has become a cornerstone in modern web development. Complementing this is Spire.Presentation for JavaScript, a specialized library designed to enhance PowerPoint presentation management within web applications.
By integrating Spire.Presentation for JavaScript into your React project, you can unlock advanced features for creating and manipulating presentations easily. Here are some of the key benefits:
- Rich Functionality: Spire.Presentation for JavaScript offers a comprehensive range of features for managing PowerPoint files, including creating slides, adding text, images, charts, and shapes. This rich functionality allows developers to build robust presentation applications without needing to rely on external tools.
- Seamless Integration: Designed to work harmoniously with various JavaScript frameworks, including React, Spire.Presentation for JavaScript integrates smoothly into existing projects, facilitating an efficient and enjoyable development experience.
- Cross-Platform Compatibility: Spire.Presentation for JavaScript is designed to work across different platforms and devices. Whether your application is run on desktop, tablet, or mobile devices, you can expect consistent performance and functionality.
- High-Quality Output: Spire.Presentation for JavaScript ensures that the presentations you create are of high quality, maintaining the integrity of fonts, images, and layouts. This quality is crucial for professional presentations and business-related use cases.
Set Up Your Environment
Step 1. Install React and npm
Download and install Node.js from the official website. Make sure to choose the version that matches your operating system.
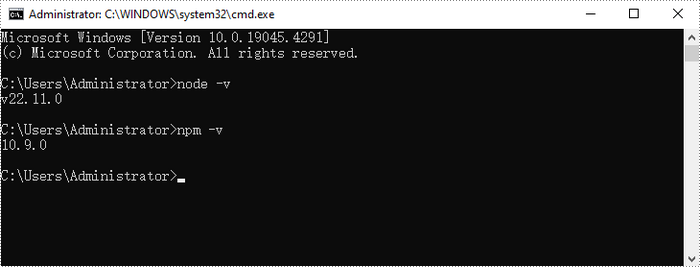
After the installation is complete, you can verify that Node.js and npm are working correctly by running the following commands in your terminal:
Step 2. Create a New React Project
Create a new React project named my-app using Create React App from terminal:
npx create-react-app my-app
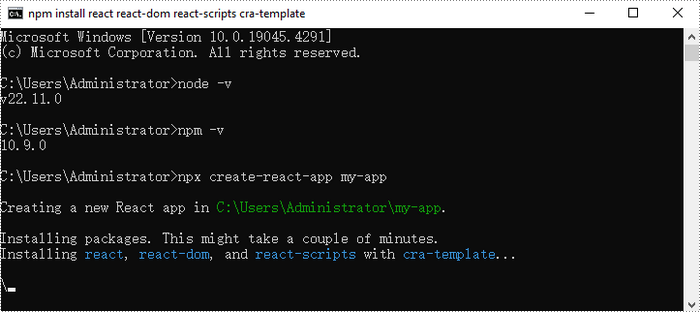
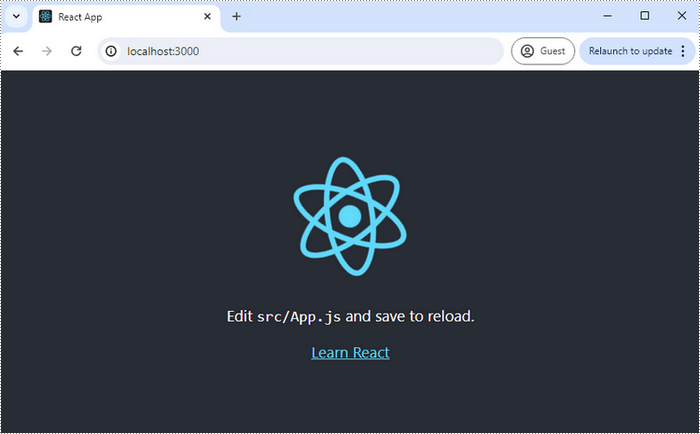
If your React project is compiled successfully, the app will be served at http://localhost:3000, allowing you to view and test your application in a browser.
To visually browse and manage the files in your project, you can open the project using VS Code.

Integrate Spire.Presentation for JavaScript in Your Project
Download Spire.Presentation for JavaScript from our website and unzip it to a location on your disk. The downloaded product package integrates Spire.Doc for JavaScript, Spire.XLS for JavaScript, Spire.PDF for JavaScript, and Spire.Presentation for JavaScript. When using the features of Spire.Presentation for JavaScript, the required files are: spire.presentation.js, Spire.Presentation.Wasm.zip, spire.common.js, Spire.Common.Wasm.zip, and the _framework folder.
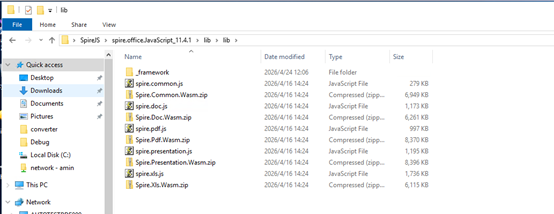
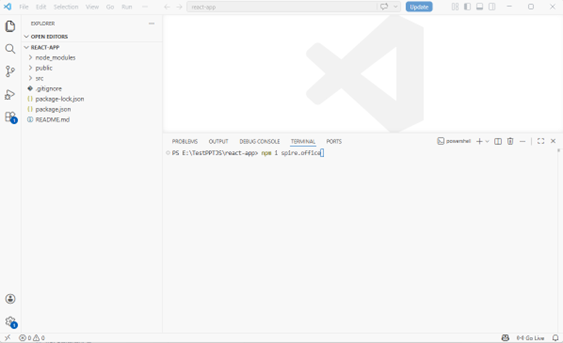
Alternatively, you can download Spire.Presentation for JavaScript using npm. In the terminal within VS Code, run the following command:
npm i spire.office
Once the installation is complete, the product packages will be saved in the node_modules/spire.office path of your project.
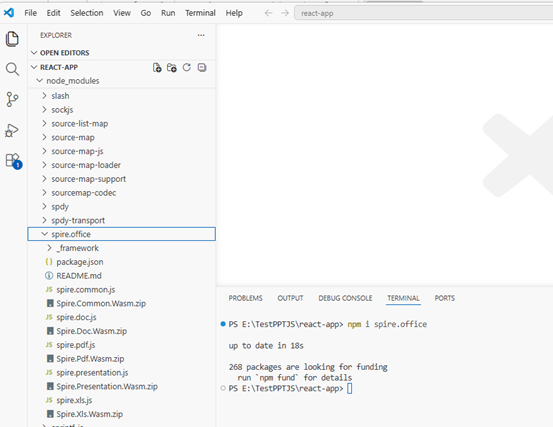
Copy the spire.presentation.js, Spire.Presentation.Wasm.zip, spire.common.js, Spire.Common.Wasm.zip, and the _framework folder five files into the "public" folder in your React project.
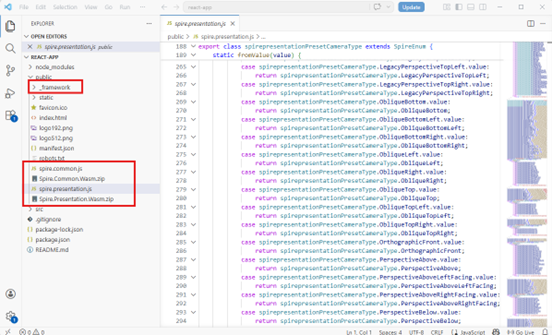
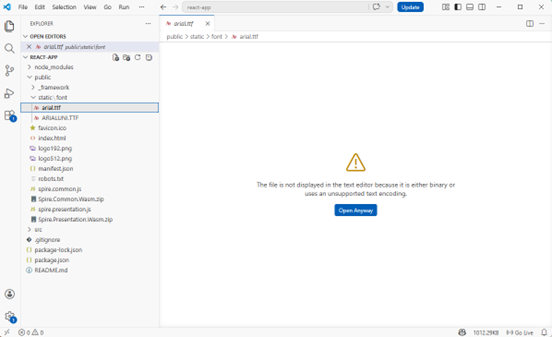
Add font files you plan to use to the "public/static/font" folder in your project. (Not always necessary)
Create and Save Presentation Files Using JavaScript
Modify the code in the "App.js" file to generate a PowerPoint file using the WebAssembly (WASM) module.
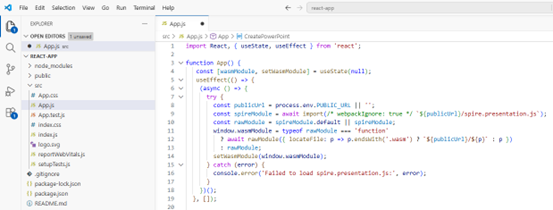
Here is the entire code:
- JavaScript
import React, { useState, useEffect } from 'react';

function App() {
   const [wasmModule, setWasmModule] = useState(null);
   useEffect(() => {
    (async () => {
      try {
        const publicUrl = process.env.PUBLIC_URL || '';
        const spireModule = await import(/* webpackIgnore: true */ `${publicUrl}/spire.presentation.js`);
        const rawModule = spireModule.default || spireModule;
        window.wasmModule = typeof rawModule === 'function'
          ? await rawModule({ locateFile: p => p.endsWith('.wasm') ? `${publicUrl}/${p}` : p })
          : rawModule;
        setWasmModule(window.wasmModule);
      } catch (error) {
        console.error('Failed to load spire.presentation.js:', error);
      }
    })();
  }, []);


  const CreatePowerPoint = async () => {
    const wasmModule = window.wasmModule.spirepresentation;

    if (wasmModule) {
       // Load the ARIALUNI.TTF font file into the virtual file system (VFS)
        await window.spire.FetchFileToVFS("ARIALUNI.TTF", "/Library/Fonts/", `${import.meta.env.BASE_URL}static/font/`);

        // Create a PPT document
        const ppt = new wasmModule.Presentation();

        // Add a new shape to the PPT document
        let rec = wasmModule.RectangleF.FromLTRB(ppt.SlideSize.Size.Width / 2 - 250,80,(500 + ppt.SlideSize.Size.Width / 2 - 250),230);
        let shape = ppt.Slides.get_Item(0).Shapes.AppendShape({shapeType:wasmModule.ShapeType.Rectangle,rectangle:rec});

        shape.ShapeStyle.LineColor.Color = wasmModule.Color.get_White();
        shape.Fill.FillType = wasmModule.FillFormatType.None;

        // Add text to the shape
        shape.AppendTextFrame("Hello World!");

        // Set the font and fill style of the text
        let textRange = shape.TextFrame.TextRange;
        textRange.Fill.FillType = wasmModule.FillFormatType.Solid;
        textRange.Fill.SolidColor.Color = wasmModule.Color.get_CadetBlue();
        textRange.FontHeight = 66;
        textRange.LatinFont = wasmModule.TextFont;

        // Define the output file name
        const outputFileName = "HelloWorld.pptx";

        // Save to file
        ppt.SaveToFile({file:outputFileName,fileFormat:wasmModule.FileFormat.Pptx2013});

        // Read the saved file and convert to a Blob object
        const modifiedFileArray = window.dotnetRuntime.Module.FS.readFile(outputFileName);
        const modifiedFile = new Blob([modifiedFileArray], { type: "application/vnd.openxmlformats-officedocument.presentationml.presentation" });

        // Clean up resources
        ppt.Dispose();

      // Create a URL for the Blob
      const url = URL.createObjectURL(modifiedFile);

      // Create an anchor element to trigger the download
      const a = document.createElement('a');
      a.href = url;
      a.download = outputFileName;
      document.body.appendChild(a);
      a.click();
      document.body.removeChild(a);
      URL.revokeObjectURL(url);
    }
  };

  return (
    <div style={{ textAlign: 'center', height: '300px' }}>
      <h1>Create a PowerPoint Document in React</h1>
      <button onClick={CreatePowerPoint} disabled={!wasmModule}>
        Generate
      </button>
    </div>
  );
}

export default App;
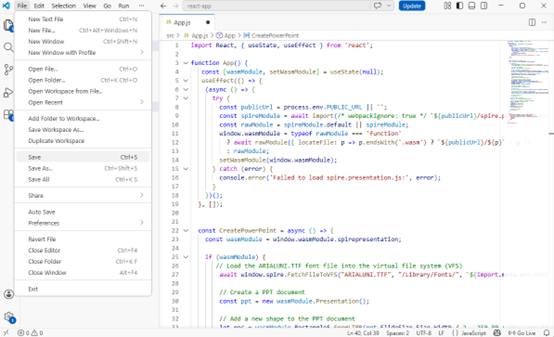
Save the changes by clicking "File" - "Save".
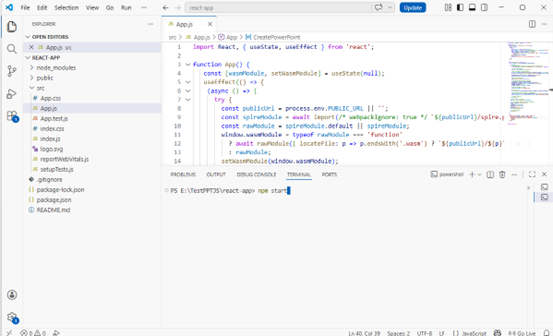
Start the development server by entering the following command in the terminal within VS
npm start
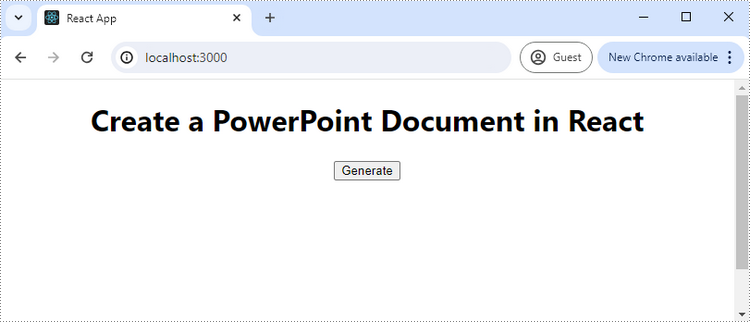
Once the React app is successfully compiled, it will open in your default web browser, typically at http://localhost:3000.
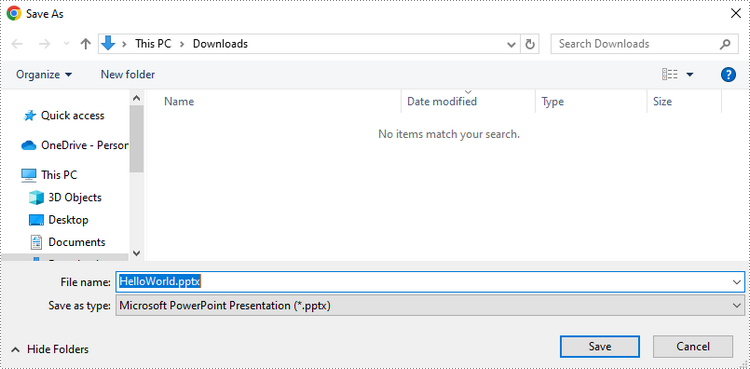
Click "Generate," and a "Save As" window will prompt you to save the output file in the designated folder.
Apply for a Temporary License
If you'd like to remove the evaluation message from the generated documents, or to get rid of the function limitations, please request a 30-day trial license for yourself.
Create a Table of Contents in a Word Document Using JavaScript in React
2025-02-20 07:02:53 Written by AdministratorAutomatically generating a table of contents (TOC) in a Word document using JavaScript within a React application streamlines document creation by eliminating manual updates and ensuring dynamic consistency. This approach is particularly valuable in scenarios where content length, structure, or headings frequently change, such as in report-generation tools, academic platforms, or documentation systems. By leveraging Spire.Doc for JavaScript's WebAssembly module and React’s reactive state management, developers can programmatically detect headings, organize hierarchical sections, and insert hyperlinked TOC entries directly into Word files. In this article, we will explore how to use Spire.Doc for JavaScript to insert tables of contents into Word documents with JavaScript in React applications.
- Insert a Default TOC into a Word Document Using JavaScript
- Insert a Custom TOC into a Word Document Using JavaScript
- Remove the Table of Contents from a Word Document
Install Spire.Doc for JavaScript
To get started with inserting tables of contents into Word documents in a React application, you can either download Spire.Doc for JavaScript from our website or install it via npm with the following command:
npm i spire.officeThe downloaded product package integrates Spire.Doc for JavaScript, Spire.XLS for JavaScript, Spire.PDF for JavaScript, and Spire.Presentation for JavaScript. To use the features of Spire.Doc for JavaScript, you need to copy the corresponding files (spire.doc.js, Spire.Doc.Wasm.zip, spire.common.js, Spire.Common.Wasm.zip, and the _framework folder) to the public folder of your project. To ensure proper text rendering, you can add relevant font files with a custom path. In the following example, the font is added to the path: public\static\font.
For more details, refer to the documentation: How to Integrate Spire.Doc for JavaScript in a React Project
Insert a Default TOC into a Word Document Using JavaScript
Spire.Doc for JavaScript offers a WebAssembly module for processing Word documents in JavaScript environments. You can load a Word document from the virtual file system using the Document.LoadFromFile() method and insert a table of contents (TOC) via the Paragraph.AppendTOC() method, which auto-generates based on the document’s titles. Finally, update the TOC with the Document.UpdateTableOfContents() method.
The detailed steps are as follows:
- Load the spire.doc.js file to initialize the WebAssembly module.
- Fetch the Word file to the virtual file system (VFS) using the window.spire.FetchFileToVFS() method.
- Create an instance of the Document class in the VFS using the new wasmModule.Document() method.
- Load the Word document from the VFS using the Document.LoadFromFile() method.
- Add a new section to the document using the Document.AddSection() method, and add a paragraph using the Section.AddParagraph() method.
- Insert the section after the cover section using the Document.Sections.Insert() method.
- Insert a TOC into the paragraph using the Paragraph.AppendTOC() method.
- Update the TOC using the Document.UpdateTableOfContents() method.
- Save the document to the VFS using the Document.SaveToFile() method.
- Read the document from the VFS and download it.
- JavaScript
import React, { useState, useEffect } from 'react';

function App() {
  const [wasmModule, setWasmModule] = useState(null);
  // Load Spire.Doc
  useEffect(() => {
    (async () => {
      try {
        const publicUrl = process.env.PUBLIC_URL || '';
        const spireModule = await import(/* webpackIgnore: true */ `${publicUrl}/spire.doc.js`);
        const rawModule = spireModule.default || spireModule;
        window.wasmModule = typeof rawModule === 'function'
          ? await rawModule({ locateFile: p => p.endsWith('.wasm') ? `${publicUrl}/${p}` : p })
          : rawModule;
        setWasmModule(window.wasmModule);
      } catch (error) {
        console.error('Failed to load spire.doc.js WASM module:', error);
      }
    })();
  }, []);

  // Function to insert a default table of contents into a Word document
  const InsertTOCWord = async () => {
    const wasmModule = window.wasmModule.spiredoc;

    if (wasmModule) {
      // Load the font files into the virtual file system (VFS)
      await window.spire.FetchFileToVFS('CALIBRI.ttf', '/Library/Fonts/', `${process.env.PUBLIC_URL}/static/font/`);

      // Specify the input and output file names
      const inputFileName = 'sample.docx';
      const outputFileName = 'DefaultTOC.docx';

      // Fetch the input file and add it to the VFS
      await window.spire.FetchFileToVFS(inputFileName, '', `${process.env.PUBLIC_URL}/static/data/`);

      // Create an instance of the Document class
      const doc = new wasmModule.Document();

      // Load the Word document
      doc.LoadFromFile({ fileName: inputFileName });

      // Create a new section
      const section = doc.AddSection();
      // Create a new paragraph
      const paragraph = section.AddParagraph();

      // Add a table of contents to the paragraph
      paragraph.AppendTOC(1, 2);

      // Insert the section after the cover section
      doc.Sections.Insert(1, section);

      // Update the table of contents
      doc.UpdateTableOfContents();

      // Save the document to the VFS
      doc.SaveToFile({ fileName: outputFileName, fileFormat: wasmModule.FileFormat.Docx2019 })

      // Read the document from the VFS and create a Blob to trigger the download
      const wordArray = await window.dotnetRuntime.Module.FS.readFile(outputFileName);
      const blob = new Blob([wordArray], { type: 'application/vnd.openxmlformats-officedocument.wordprocessingml.document' });
      const url = URL.createObjectURL(blob);
      const a = document.createElement('a');
      a.href = url;
      a.download = `${outputFileName}`;
      document.body.appendChild(a);
      a.click();
      document.body.removeChild(a);
      URL.revokeObjectURL(url);
    }
  };

  return (
    <div style={{ textAlign: 'center', height: '300px' }}>
      <h1>Insert Default Table of Contents Using JavaScript in React</h1>
      <button onClick={InsertTOCWord} disabled={!wasmModule}>
        Insert and Download
      </button>
    </div>
  );
}

export default App;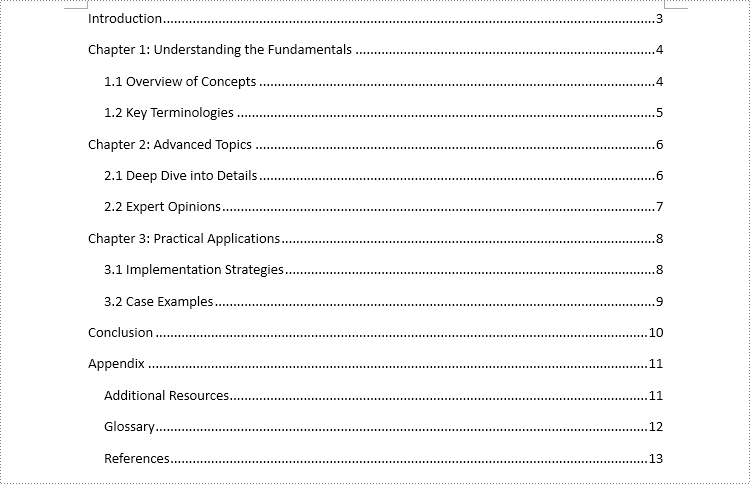
Insert a Custom TOC into a Word Document Using JavaScript
Spire.Doc for JavaScript also enables users to create a custom table of contents. By creating an instance of the TableOfContent class, you can customize title and page number display using switches. For instance, the switch "{\o "1-3" \n 1-1}" configures the TOC to display titles from level 1 to 3 while omitting page numbers for level 1 titles. After creating the instance, insert it into the document and assign it as the TOC of the document using the Document.TOC property.
The detailed steps are as follows:
- Load the spire.doc.js file to initialize the WebAssembly module.
- Fetch the Word file to the virtual file system (VFS) using the window.spire.FetchFileToVFS() method.
- Create an instance of the Document class in the VFS using the new wasmModule.Document() method.
- Load the Word document from the VFS using the Document.LoadFromFile() method.
- Add a new section to the document using the Document.AddSection() method, and add a paragraph using the Section.AddParagraph() method.
- Insert the section after the cover section using the Document.Sections.Insert() method.
- Create an instance of the TableOfContent class in the VFS using the new wasmModule.TableOfContent() method and specify the switch.
- Insert the TOC into the new paragraph using the Paragraph.Items.Add() method.
- Append the field separator and field end marks to complete the TOC field using the Paragraph.AppendFieldMark() method.
- Set the new TOC as the document’s TOC through the Document.TOC property.
- Update the TOC using the Document.UpdateTableOfContents() method.
- Save the document to the VFS using the Document.SaveToFile() method.
- Read the document from the VFS and download it.
- JavaScript
import React, { useState, useEffect } from 'react';

function App() {
  const [wasmModule, setWasmModule] = useState(null);
  // Load Spire.Doc
  useEffect(() => {
    (async () => {
      try {
        const publicUrl = process.env.PUBLIC_URL || '';
        const spireModule = await import(/* webpackIgnore: true */ `${publicUrl}/spire.doc.js`);
        const rawModule = spireModule.default || spireModule;
        window.wasmModule = typeof rawModule === 'function'
          ? await rawModule({ locateFile: p => p.endsWith('.wasm') ? `${publicUrl}/${p}` : p })
          : rawModule;
        setWasmModule(window.wasmModule);
      } catch (error) {
        console.error('Failed to load spire.doc.js WASM module:', error);
      }
    })();
  }, []);

  // Function to insert a default table of contents into a Word document
  const InsertTOCWord = async () => {
    const wasmModule = window.wasmModule.spiredoc;

    if (wasmModule) {
      // Load the font files into the virtual file system (VFS)
      await window.spire.FetchFileToVFS('CALIBRI.ttf', '/Library/Fonts/', `${process.env.PUBLIC_URL}/static/font/`);

      // Specify the input and output file names
      const inputFileName = 'sample.docx';
      const outputFileName = 'CustomTOC.docx';

      // Fetch the input file and add it to the VFS
      await window.spire.FetchFileToVFS(inputFileName, '', `${process.env.PUBLIC_URL}/static/data/`);

      // Create an instance of the Document class
      const doc = new wasmModule.Document();

      // Load the Word document
      doc.LoadFromFile({ fileName: inputFileName });

      // Add a new section and paragraph
      const section = doc.AddSection();
      const para = section.AddParagraph();

      // Insert the section after the cover section
      doc.Sections.Insert(1, section)

      // Create an instance of the TableOfContent class and specify the switch
      const toc = new wasmModule.TableOfContent(doc, '{\\o \”1-3\” \\n 1-1}');

      // Add the table of contents to the new paragraph
      para.Items.Add(toc);

      // Insert a field separator mark to the paragraph
      para.AppendFieldMark(wasmModule.FieldMarkType.FieldSeparator);

      // Insert a field end mark to the paragraph
      para.AppendFieldMark(wasmModule.FieldMarkType.FieldEnd);

      // Set the new TOC as the TOC of the document
      doc.TOC = toc;

      // Update the TOC
      doc.UpdateTableOfContents();

      // Save the document to the VFS
      doc.SaveToFile({ fileName: outputFileName, fileFormat: wasmModule.FileFormat.Docx2019});

      // Read the document from the VFS and create a Blob to trigger the download
      const wordArray = await window.dotnetRuntime.Module.FS.readFile(outputFileName);
      const blob = new Blob([wordArray], { type: 'application/vnd.openxmlformats-officedocument.wordprocessingml.document' });
      const url = URL.createObjectURL(blob);
      const a = document.createElement('a');
      a.href = url;
      a.download = `${outputFileName}`;
      document.body.appendChild(a);
      a.click();
      document.body.removeChild(a);
      URL.revokeObjectURL(url);
    }
  };

  return (
      <div style={{ textAlign: 'center', height: '300px' }}>
        <h1>Insert a Custom Table of Contents Using JavaScript in React</h1>
        <button onClick={InsertTOCWord} disabled={!wasmModule}>
          Insert and Download
        </button>
      </div>
  );
}

export default App;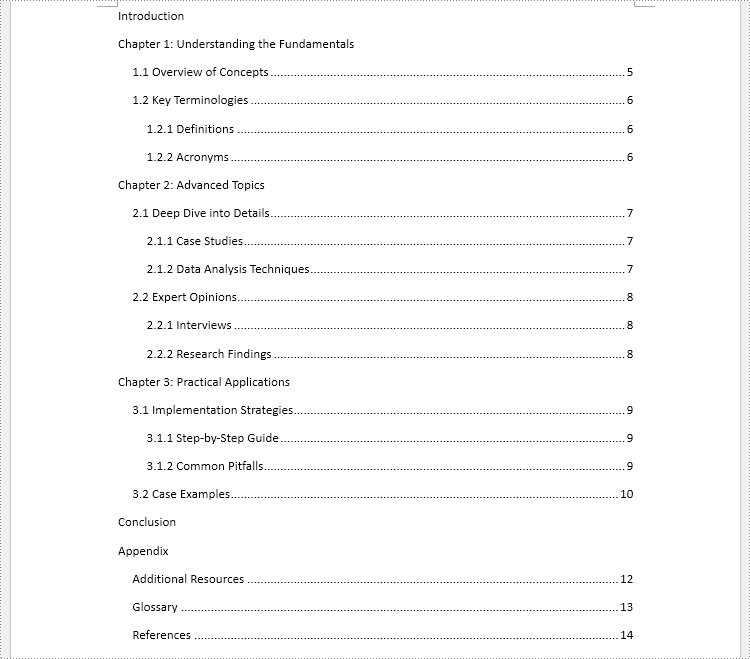
Remove the Table of Contents from a Word Document
Since TOC paragraphs have style names that start with "TOC", you can locate them by matching a regular expression on the paragraph style and then remove those paragraphs.
The detailed steps are as follows:
- Load the spire.doc.js file to initialize the WebAssembly module.
- Fetch the Word file to the virtual file system (VFS) using the window.spire.FetchFileToVFS() method.
- Create an instance of the Document class in the VFS using the new wasmModule.Document() method.
- Load the Word document from the VFS using the Document.LoadFromFile() method.
- Create an instance of the Regex class with the pattern "TOC\w+".
- Iterate through each section in the document and access its body using the Document.Sections.get_Item().Body property.
- Loop through the paragraphs in each section body and retrieve each paragraph's style via the Paragraph.StyleName property.
- Identify paragraphs whose style matches the regex using the Regex.IsMatch() method and remove them using the Section.Body.Paragraphs.RemoveAt() method.
- Save the document to the VFS using the Document.SaveToFile() method.
- Read the document from the VFS and download it.
- JavaScript
import React, { useState, useEffect } from 'react';

function App() {
  const [wasmModule, setWasmModule] = useState(null);
  // Load Spire.Doc
  useEffect(() => {
    (async () => {
      try {
        const publicUrl = process.env.PUBLIC_URL || '';
        const spireModule = await import(/* webpackIgnore: true */ `${publicUrl}/spire.doc.js`);
        const rawModule = spireModule.default || spireModule;
        window.wasmModule = typeof rawModule === 'function'
          ? await rawModule({ locateFile: p => p.endsWith('.wasm') ? `${publicUrl}/${p}` : p })
          : rawModule;
        setWasmModule(window.wasmModule);
      } catch (error) {
        console.error('Failed to load spire.doc.js WASM module:', error);
      }
    })();
  }, []);

  // Function to remove the table of contents from a Word document
  const RemoveTOC = async () => {
    const wasmModule = window.wasmModule.spiredoc;

    if (wasmModule) {
      // Load the font files into the virtual file system (VFS)
      await window.spire.FetchFileToVFS('CALIBRI.ttf', '/Library/Fonts/', `${process.env.PUBLIC_URL}/static/font/`);

      // Specify the input and output file names
      const inputFileName = 'sample.docx';
      const outputFileName = 'RemoveTOC.docx';

      // Fetch the input file and add it to the VFS
      await window.spire.FetchFileToVFS(inputFileName, '', `${process.env.PUBLIC_URL}/static/data/`);

      // Create an instance of the Document class
      const doc = new wasmModule.Document();

      // Load the Word document
      doc.LoadFromFile({ fileName: inputFileName });

      // Create a regex pattern to match the style name of TOC
      const regex = new wasmModule.Regex("TOC\\w+", wasmModule.RegexOptions.None);

      // Iterate through each section
      for (let i = 0; i < doc.Sections.Count; i++) {
        // Iterate through each paragraph in the section body
        const sectionBody = doc.Sections.get_Item(i).Body;
        for (let j = 0; j < sectionBody.Paragraphs.Count; j++) {
          // Check if the style name matches the regex pattern
          const paragraph = sectionBody.Paragraphs.get_Item(j);
          if (regex.IsMatch(paragraph.StyleName)) {
            // Remove the paragraph
            sectionBody.Paragraphs.RemoveAt(j)
            // Or remove the section
            //doc.Sections.RemoveAt(i)
            //i--
            j--
          }
        }
      }

      // Save the document to the VFS
      doc.SaveToFile({ fileName: outputFileName, fileFormat: wasmModule.FileFormat.Docx2019});

      // Read the document from the VFS and create a Blob to trigger the download
      const wordArray = await window.dotnetRuntime.Module.FS.readFile(outputFileName);
      const blob = new Blob([wordArray], { type: 'application/vnd.openxmlformats-officedocument.wordprocessingml.document' });
      const url = URL.createObjectURL(blob);
      const a = document.createElement('a');
      a.href = url;
      a.download = `${outputFileName}`;
      document.body.appendChild(a);
      a.click();
      document.body.removeChild(a);
      URL.revokeObjectURL(url);
    }
  };

  return (
      <div style={{ textAlign: 'center', height: '300px' }}>
        <h1>Remove TOC Using JavaScript in React</h1>
        <button onClick={RemoveTOC} disabled={!wasmModule}>
          Insert and Download
        </button>
      </div>
  );
}

export default App;
Get a Free License
To fully experience the capabilities of Spire.Doc for JavaScript without any evaluation limitations, you can request a free 30-day trial license.
Convert Text to Numbers or Numbers to Text in Excel with JavaScript in React
2025-02-17 03:12:47 Written by AdministratorProper data formatting is essential for accurate calculations, sorting, and analysis. In Excel, numbers are sometimes mistakenly stored as text, which prevents them from being used in mathematical calculations. On the other hand, certain values like ZIP codes, phone numbers, and product IDs should be stored as text to preserve leading zeros and ensure consistency. Knowing how to convert between text and numeric formats is essential for maintaining data integrity, preventing errors, and improving usability. In this article, you will learn how to convert text to numbers and numbers to text in Excel in React using Spire.XLS for JavaScript.
Install Spire.XLS for JavaScript
To get started with converting text to numbers and numbers to text in Excel in a React application, you can either download Spire.XLS for JavaScript from our website or install it via npm with the following command:
npm i spire.office
The downloaded product package has been integrated Spire.Doc for JavaScript,Spire.XLS for JavaScript,Spire.PDF for JavaScript,Spire.Presentation for JavaScript. To use the functionality of Spire.XLS for JavaScript, you need to copy the corresponding files (spire.xls.js, Spire.Xls.Wasm.zip, spire.common.js, Spire.Common.Wasm.zip, and _framework) to the project's "public" folder. At the same time, in order to ensure text rendering, the related font files can be added with custom paths. In the following example, the font addition path is: public\static\font.
For more details, refer to the documentation: How to Integrate Spire.XLS for JavaScript in a React Project
Convert Text to Numbers in Excel
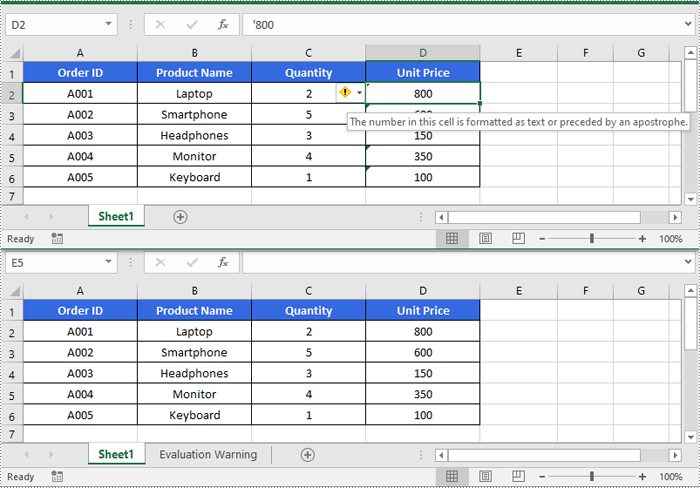
With Spire.XLS for JavaScript, developers can format the text in individual cells or a range of cells as numbers using the CellRange.ConvertToNumber() method. The detailed steps are as follows.
- Create a Workbook object using the new wasmModule.Workbook() method.
- Load the Excel file using the Workbook.LoadFromFile() method.
- Get a specific worksheet using the Workbook.Worksheets.get(index) method.
- Get the desired cell or range of cells using the Worksheet.Range.get() method.
- Format the text in the cell or range of cells as numbers using the CellRange.ConvertToNumber() method.
- Save the resulting workbook using the Workbook.SaveToFile() method.
- JavaScript
import React, { useState, useEffect } from 'react';
function App() {
  const [wasmModule, setWasmModule] = useState(null);
  // Load Spire.XLS
  useEffect(() => {
    (async () => {
      try {
        const publicUrl = process.env.PUBLIC_URL || '';
        const spireModule = await import(/* webpackIgnore: true */ `${publicUrl}/spire.xls.js`);
        const rawModule = spireModule.default || spireModule;
        window.wasmModule = typeof rawModule === 'function'
          ? await rawModule({ locateFile: p => p.endsWith('.wasm') ? `${publicUrl}/${p}` : p })
          : rawModule;
        setWasmModule(window.wasmModule);
      } catch (error) {
        console.error('Failed to load spire.xls.js WASM module:', error);
      }
    })();
  }, []);

  // Function to convert text to numbers in an Excel worksheet
  const ConvertTextToNumbers = async () => {
    const wasmModule = window.wasmModule.spirexls;

    if (wasmModule) {
      // Load font into Virtual File System (VFS)
      await window.spire.FetchFileToVFS('Arial.ttf', '/Library/Fonts/', `${process.env.PUBLIC_URL}/static/font/`);

      // Load input file into Virtual File System (VFS)
      const inputFileName = 'sample.xlsx';
      await window.spire.FetchFileToVFS(inputFileName, '', `${process.env.PUBLIC_URL}/static/data/`);

      // Create a new workbook
      const workbook = new wasmModule.Workbook();

      // Load the Excel file from the virtual file system
      workbook.LoadFromFile(inputFileName);

      // Get the first worksheet
      let sheet = workbook.Worksheets.get(0);

      // Get the desired cell range
      let range = sheet.Range.get("D2:D6");

      // Convert the text in the cell range as numbers
      range.ConvertToNumber();

      // Define the output file name
      const outputFileName = "TextToNumbers_output.xlsx";

      // Save the workbook to the specified path
      workbook.SaveToFile({ fileName: outputFileName, version: wasmModule.ExcelVersion.Version2010 });

      // Read the saved file and convert to Blob object
      const modifiedFileArray = window.dotnetRuntime.Module.FS.readFile(outputFileName);
      const modifiedFile = new Blob([modifiedFileArray], { type: 'application/vnd.openxmlformats-officedocument.spreadsheetml.sheet' });

      // Create a URL for the Blob and initiate download
      const url = URL.createObjectURL(modifiedFile);
      const a = document.createElement('a');
      a.href = url;
      a.download = outputFileName;
      document.body.appendChild(a);
      a.click();
      document.body.removeChild(a);
      URL.revokeObjectURL(url);

      // Clean up resources used by the workbook
      workbook.Dispose();
    }
  };

  return (
    <div style={{ textAlign: 'center', height: '300px' }}>
      <h1>Convert Text to Numbers in Excel Using JavaScript in React</h1>
      <button onClick={ConvertTextToNumbers} disabled={!wasmModule}>
        Convert
      </button>
    </div>
  );
}

export default App;
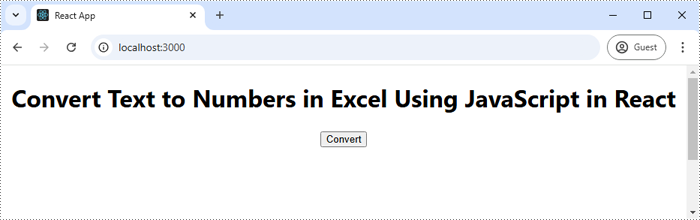
Run the code to launch the React app at localhost:3000. Once it's running, click on the "Convert" button to format text stored in specific cells of an Excel worksheet as numbers:
The screenshot below shows the input Excel worksheet and the output Excel worksheet:
Convert Numbers to Text in Excel
To convert numbers stored in specific cells or a range of cells as text, developers can use the CellRange.NumberFormat property. The detailed steps are as follows.
- Create a Workbook object using the new wasmModule.Workbook() method.
- Load the Excel file using the Workbook.LoadFromFile() method.
- Get a specific worksheet using the Workbook.Worksheets.get(index) method.
- Get the desired cell or range of cells using the Worksheet.Range.get() method.
- Format the numbers in the cell or range of cells as text by setting the CellRange.NumberFormat property to "@".
- Save the resulting workbook using the Workbook.SaveToFile() method.
- JavaScript
import React, { useState, useEffect } from 'react';
function App() {
  const [wasmModule, setWasmModule] = useState(null);
  // Load Spire.XLS
  useEffect(() => {
    (async () => {
      try {
        const publicUrl = process.env.PUBLIC_URL || '';
        const spireModule = await import(/* webpackIgnore: true */ `${publicUrl}/spire.xls.js`);
        const rawModule = spireModule.default || spireModule;
        window.wasmModule = typeof rawModule === 'function'
          ? await rawModule({ locateFile: p => p.endsWith('.wasm') ? `${publicUrl}/${p}` : p })
          : rawModule;
        setWasmModule(window.wasmModule);
      } catch (error) {
        console.error('Failed to load spire.xls.js WASM module:', error);
      }
    })();
  }, []);

  // Function to convert numbers to text in an Excel worksheet
  const ConvertNumbersToText = async () => {
    const wasmModule = window.wasmModule.spirexls;

    if (wasmModule) {
      // Load font into Virtual File System (VFS)
      await window.spire.FetchFileToVFS('Arial.ttf', '/Library/Fonts/', `${process.env.PUBLIC_URL}/static/font/`);

      // Load input file into Virtual File System (VFS)
      const inputFileName = 'sample.xlsx';
      await window.spire.FetchFileToVFS(inputFileName, '', `${process.env.PUBLIC_URL}/static/data/`);

      // Create a new workbook
      const workbook = new wasmModule.Workbook();

      // Load the Excel file from the virtual file system
      workbook.LoadFromFile(inputFileName);

      // Get the first worksheet
      let sheet = workbook.Worksheets.get(0);

      // Get the desired cell range
      let range = sheet.Range.get("F2:F9");

      // Convert the numbers in the cell range as text
      range.NumberFormat = "@"

      // Define the output file name
      const outputFileName = "NumbersToText_output.xlsx";

      // Save the workbook to the specified path
      workbook.SaveToFile({ fileName: outputFileName, version: wasmModule.ExcelVersion.Version2010 });

      // Read the saved file and convert to Blob object
      const modifiedFileArray = window.dotnetRuntime.Module.FS.readFile(outputFileName);
      const modifiedFile = new Blob([modifiedFileArray], { type: 'application/vnd.openxmlformats-officedocument.spreadsheetml.sheet' });

      // Create a URL for the Blob and initiate download
      const url = URL.createObjectURL(modifiedFile);
      const a = document.createElement('a');
      a.href = url;
      a.download = outputFileName;
      document.body.appendChild(a);
      a.click();
      document.body.removeChild(a);
      URL.revokeObjectURL(url);

      // Clean up resources used by the workbook
      workbook.Dispose();
    }
  };

  return (
    <div style={{ textAlign: 'center', height: '300px' }}>
      <h1>Convert Numbers To Text in Excel Using JavaScript in React</h1>
      <button onClick={ConvertNumbersToText} disabled={!wasmModule}>
        Convert
      </button>
    </div>
  );
}

export default App;

Get a Free License
To fully experience the capabilities of Spire.XLS for JavaScript without any evaluation limitations, you can request a free 30-day trial license.
Set Row Height and Column Width in Excel with JavaScript in React
2025-02-17 01:01:16 Written by AdministratorWhen working with Excel files, setting the proper row height and column width is crucial for data presentation and readability. For example, if there are long text entries in a column, increasing the column width ensures that the entire text is clearly visible without truncation. Similarly, for rows that contain large fonts or multiple lines of text, adjusting the row height is necessary. In this article, you will learn how to set row height and column width in Excel in React using Spire.XLS for JavaScript.
Install Spire.XLS for JavaScript
To get started with setting row height or column width in a React application, you can either download Spire.XLS for JavaScript from our website or install it via npm with the following command:
npm i spire.office
The downloaded product package has been integrated Spire.Doc for JavaScript,Spire.XLS for JavaScript,Spire.PDF for JavaScript,Spire.Presentation for JavaScript. To use the functionality of Spire.XLS for JavaScript, you need to copy the corresponding files (spire.xls.js, Spire.Xls.Wasm.zip, spire.common.js, Spire.Common.Wasm.zip, and _framework) to the project's "public" folder. At the same time, in order to ensure text rendering, the related font files can be added with custom paths. In the following example, the font addition path is: public\static\font.
For more details, refer to the documentation: How to Integrate Spire.XLS for JavaScript in a React Project
Set Row Height in Excel with JavaScript
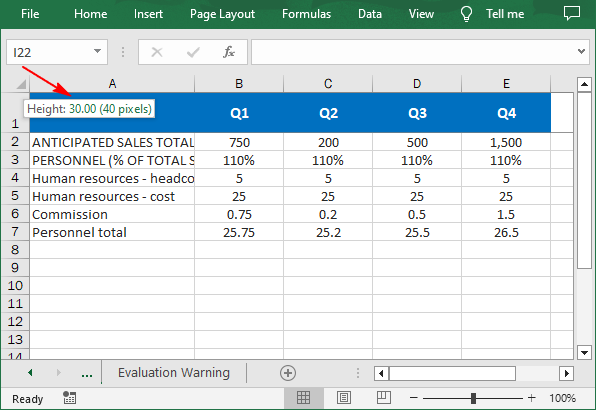
Spire.XLS for JavaScript provides the Worksheet.SetRowHeight() method to set the height of a specified row in an Excel worksheet. The following are the main steps.
- Create a Workbook object using the new wasmModule.Workbook() method.
- Load an Excel file using the Workbook.LoadFromFile() method.
- Get a specific worksheet using the Workbook.Worksheets.get() method.
- Set the height of a specified row using the Worksheet. SetRowHeight() method.
- Save the result file using the Workbook.SaveToFile() method.
- JavaScript
import React, { useState, useEffect } from 'react';
function App() {
  const [wasmModule, setWasmModule] = useState(null);
  // Load Spire.XLS
  useEffect(() => {
    (async () => {
      try {
        const publicUrl = process.env.PUBLIC_URL || '';
        const spireModule = await import(/* webpackIgnore: true */ `${publicUrl}/spire.xls.js`);
        const rawModule = spireModule.default || spireModule;
        window.wasmModule = typeof rawModule === 'function'
          ? await rawModule({ locateFile: p => p.endsWith('.wasm') ? `${publicUrl}/${p}` : p })
          : rawModule;
        setWasmModule(window.wasmModule);
      } catch (error) {
        console.error('Failed to load spire.xls.js WASM module:', error);
      }
    })();
  }, []);

  // Function to delete a specified row and column
  const SetRowHeight  = async () => {
    const wasmModule = window.wasmModule.spirexls;

    if (wasmModule) {
      // Load font into Virtual File System (VFS)
      await window.spire.FetchFileToVFS('Arial.ttf', '/Library/Fonts/', `${process.env.PUBLIC_URL}/static/font/`);


      // Load the Excel files into the virtual file system (VFS)
      let inputFileName = 'merged.xlsx';
      await window.spire.FetchFileToVFS(inputFileName, '', `${process.env.PUBLIC_URL}/static/data/`);


      // Create a new workbook
      let workbook = new wasmModule.Workbook();


      // Load an Excel document
      workbook.LoadFromFile({ fileName: inputFileName });

      // Get the first worksheet
      let sheet = workbook.Worksheets.get(0);

      // Set the height of the first row to 30
      sheet.SetRowHeight(1, 30)

      //Save result file
      const outputFileName = 'SetRowHeight.xlsx';
      workbook.SaveToFile({fileName: outputFileName, version:wasmModule.ExcelVersion.Version2016});

      // Read the saved file and convert to Blob object
      const modifiedFileArray = window.dotnetRuntime.Module.FS.readFile(outputFileName);
      const modifiedFile = new Blob([modifiedFileArray], { type: 'application/vnd.openxmlformats-officedocument.spreadsheetml.sheet' });

      // Create a URL for the Blob and initiate download
      const url = URL.createObjectURL(modifiedFile);
      const a = document.createElement('a');
      a.href = url;
      a.download = outputFileName;
      document.body.appendChild(a);
      a.click();
      document.body.removeChild(a);
      URL.revokeObjectURL(url);

      // Clean up resources used by the workbook
      workbook.Dispose();
    }
  };

  return (
    <div style={{ textAlign: 'center', height: '300px' }}>
      <h1>Set Row Height in Excel Using JavaScript in React</h1>
      <button onClick={SetRowHeight} disabled={!wasmModule}>
        Process
      </button>
    </div>
  );
}

export default App;
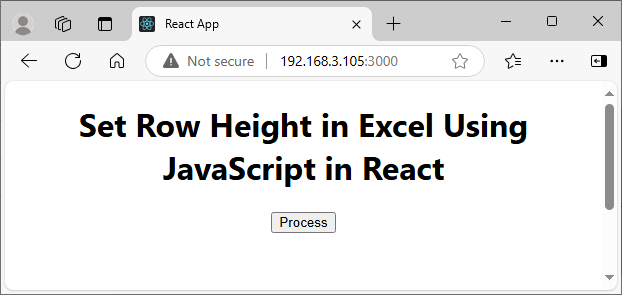
Run the code to launch the React app at localhost:3000. Once it's running, click the "Process" button to set the row height in Excel:
Below is the result file:
Set Column Width in Excel with JavaScript
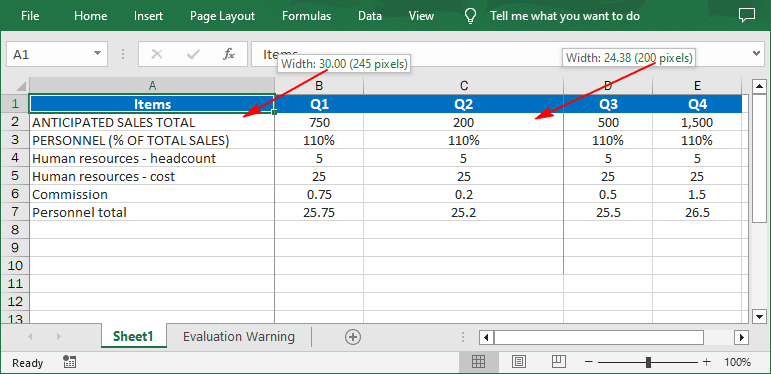
Worksheet.SetColumnWidth() method can be used to set the width of a specified column. The default unit of measure is points, and if you want to set column width in pixels, you can use the Worksheet.SetColumnWidthInPixels() method. The following are the main steps.
- Create a Workbook object using the new wasmModule.Workbook() method.
- Load an Excel file using the Workbook.LoadFromFile() method.
- Get a specific worksheet using the Workbook.Worksheets.get() method.
- Set the width of a specified column in points using the Worksheet.SetColumnWidth() method.
- Set the width of a specified column in pixels using the Worksheet.SetColumnWidthInPixels() method.
- Save the result file using the Workbook.SaveToFile() method.
- JavaScript
import React, { useState, useEffect } from 'react';
function App() {
  const [wasmModule, setWasmModule] = useState(null);
  // Load Spire.XLS
  useEffect(() => {
    (async () => {
      try {
        const publicUrl = process.env.PUBLIC_URL || '';
        const spireModule = await import(/* webpackIgnore: true */ `${publicUrl}/spire.xls.js`);
        const rawModule = spireModule.default || spireModule;
        window.wasmModule = typeof rawModule === 'function'
          ? await rawModule({ locateFile: p => p.endsWith('.wasm') ? `${publicUrl}/${p}` : p })
          : rawModule;
        setWasmModule(window.wasmModule);
      } catch (error) {
        console.error('Failed to load spire.xls.js WASM module:', error);
      }
    })();
  }, []);

  //  Function to delete a specified row and column
  const SetColumnWidth = async () => {
    const wasmModule = window.wasmModule.spirexls;

    if (wasmModule) {
      // Load font into Virtual File System (VFS)
      await window.spire.FetchFileToVFS('Arial.ttf', '/Library/Fonts/', `${process.env.PUBLIC_URL}/static/font/`);


      // Load the Excel files into the virtual file system (VFS)
      let inputFileName = 'merged.xlsx';
      await window.spire.FetchFileToVFS(inputFileName, '', `${process.env.PUBLIC_URL}/static/data/`);


      // Create a new workbook
      let workbook = new wasmModule.Workbook();


      // Load an Excel document
      workbook.LoadFromFile({ fileName: inputFileName });

      // Get the first worksheet
      let sheet = workbook.Worksheets.get(0);

      // Set the width of the first colum to 30 points
      sheet.SetColumnWidth(1, 30);

      // Set the width of the third column to 200 pixels
      sheet.SetColumnWidthInPixels(3, 200);

      //Save result file
      const outputFileName = 'SetColumnWidth.xlsx';
      workbook.SaveToFile({ fileName: outputFileName, version: wasmModule.ExcelVersion.Version2016 });

      // Read the saved file and convert to Blob object
      const modifiedFileArray = window.dotnetRuntime.Module.FS.readFile(outputFileName);
      const modifiedFile = new Blob([modifiedFileArray], { type: 'application/vnd.openxmlformats-officedocument.spreadsheetml.sheet' });

      // Create a URL for the Blob and initiate download
      const url = URL.createObjectURL(modifiedFile);
      const a = document.createElement('a');
      a.href = url;
      a.download = outputFileName;
      document.body.appendChild(a);
      a.click();
      document.body.removeChild(a);
      URL.revokeObjectURL(url);

      // Clean up resources used by the workbook
      workbook.Dispose();
    }
  };

  return (
    <div style={{ textAlign: 'center', height: '300px' }}>
      <h1>Set Column Width in Excel Using JavaScript in React</h1>
      <button onClick={SetColumnWidth} disabled={!wasmModule}>
        Process
      </button>
    </div>
  );
}

export default App;
Get a Free License
To fully experience the capabilities of Spire.XLS for JavaScript without any evaluation limitations, you can request a free 30-day trial license.
Merge or Unmerge Cells in Excel with JavaScript in React
2025-02-13 08:57:13 Written by AdministratorMerging and unmerging cells in Excel is a useful feature that enhances the organization and presentation of data in worksheets. By combining multiple cells into a single cell or separating a merged cell back into its original state, you can better format your data for readability and aesthetic appeal. In this article, we will demonstrate how to merge and unmerge cells in Excel in React using Spire.XLS for JavaScript.
Install Spire.XLS for JavaScript
To get started with merging and unmerging cells in Excel in a React application, you can either download Spire.XLS for JavaScript from our website or install it via npm with the following command:
npm i spire.office
The downloaded product package has been integrated Spire.Doc for JavaScript,Spire.XLS for JavaScript,Spire.PDF for JavaScript,Spire.Presentation for JavaScript. To use the functionality of Spire.XLS for JavaScript, you need to copy the corresponding files (spire.xls.js, Spire.Xls.Wasm.zip, spire.common.js, Spire.Common.Wasm.zip, and _framework) to the project's "public" folder. At the same time, in order to ensure text rendering, the related font files can be added with custom paths. In the following example, the font addition path is: public\static\font.
For more details, refer to the documentation: How to Integrate Spire.XLS for JavaScript in a React Project
Merge Specific Cells in Excel
Merging cells allows users to create a header that spans multiple columns or rows, making the data more visually structured and easier to read. With Spire.XLS for JavaScript, developers are able to merge specific adjacent cells into a single cell by using the CellRange.Merge() method. The detailed steps are as follows.
- Create a Workbook object using the new wasmModule.Workbook() method.
- Load the Excel file using the Workbook.LoadFromFile() method.
- Get a specific worksheet using the Workbook.Worksheets.get(index) method.
- Get the range of cells that need to be merged using the Worksheet.Range.get() method.
- Merge the cells into one using the CellRange.Merge() method.
- Save the resulting workbook using the Workbook.SaveToFile() method.
- JavaScript
import React, { useState, useEffect } from 'react';
function App() {
  const [wasmModule, setWasmModule] = useState(null);
  // Load Spire.XLS
  useEffect(() => {
    (async () => {
      try {
        const publicUrl = process.env.PUBLIC_URL || '';
        const spireModule = await import(/* webpackIgnore: true */ `${publicUrl}/spire.xls.js`);
        const rawModule = spireModule.default || spireModule;
        window.wasmModule = typeof rawModule === 'function'
          ? await rawModule({ locateFile: p => p.endsWith('.wasm') ? `${publicUrl}/${p}` : p })
          : rawModule;
        setWasmModule(window.wasmModule);
      } catch (error) {
        console.error('Failed to load spire.xls.js WASM module:', error);
      }
    })();
  }, []);

  // Function to merge cells in an Excel worksheet
  const MergeCells = async () => {
    const wasmModule = window.wasmModule.spirexls;

    if (wasmModule) {
      // Load font into Virtual File System (VFS)
      await window.spire.FetchFileToVFS('Arial.ttf', '/Library/Fonts/', `${process.env.PUBLIC_URL}/static/font/`);


      // Load the Excel files into the virtual file system (VFS)
      let inputFileName = 'sample.xlsx';
      await window.spire.FetchFileToVFS(inputFileName, '', `${process.env.PUBLIC_URL}/static/data/`);


      // Create a new workbook
      let workbook = new wasmModule.Workbook();


      // Load an Excel document
      workbook.LoadFromFile({ fileName: inputFileName });

      // Get the first worksheet
      let sheet = workbook.Worksheets.get(0);

      // Merge the particular cells in the worksheet
      sheet.Range.get("A1:D1").Merge();

      // Define the output file name
      const outputFileName = "MergeCells_output.xlsx";

      // Save the workbook to the specified path
      workbook.SaveToFile({ fileName: outputFileName, version: wasmModule.ExcelVersion.Version2013 });

      // Read the saved file and convert to Blob object
      const modifiedFileArray = window.dotnetRuntime.Module.FS.readFile(outputFileName);
      const modifiedFile = new Blob([modifiedFileArray], { type: 'application/vnd.openxmlformats-officedocument.spreadsheetml.sheet' });

      // Create a URL for the Blob and initiate download
      const url = URL.createObjectURL(modifiedFile);
      const a = document.createElement('a');
      a.href = url;
      a.download = outputFileName;
      document.body.appendChild(a);
      a.click();
      document.body.removeChild(a);
      URL.revokeObjectURL(url);

      // Clean up resources used by the workbook
      workbook.Dispose();
    }
  };

  return (
    <div style={{ textAlign: 'center', height: '300px' }}>
      <h1>Merge Cells in an Excel Worksheet into One Using JavaScript in React</h1>
      <button onClick={MergeCells} disabled={!wasmModule}>
        Merge
      </button>
    </div>
  );
}

export default App;
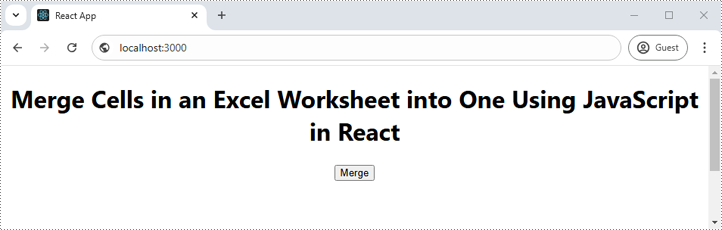
Run the code to launch the React app at localhost:3000. Once it's running, click on the "Merge" button to merge specific cells in an Excel worksheet into one:
The output Excel worksheet appears as follows:

Unmerge Specific Cells in Excel
Unmerging cells allows users to restore previously merged cells to their original individual state, enabling better data manipulation and formatting flexibility. With Spire.XLS for JavaScript, developers can unmerge specific merged cells using the CellRange.UnMerge() method. The detailed steps are as follows.
- Create a Workbook object using the new wasmModule.Workbook() method.
- Load the Excel file using the Workbook.LoadFromFile() method.
- Get a specific worksheet using the Workbook.Worksheets.get(index) method.
- Get the cell that needs to be unmerged using the Worksheet.Range.get() method.
- Unmerge the cell using the CellRange.UnMerge() method.
- Save the resulting workbook using the Workbook.SaveToFile() method.
- JavaScript
import React, { useState, useEffect } from 'react';
function App() {
  const [wasmModule, setWasmModule] = useState(null);
  // Load Spire.XLS
  useEffect(() => {
    (async () => {
      try {
        const publicUrl = process.env.PUBLIC_URL || '';
        const spireModule = await import(/* webpackIgnore: true */ `${publicUrl}/spire.xls.js`);
        const rawModule = spireModule.default || spireModule;
        window.wasmModule = typeof rawModule === 'function'
          ? await rawModule({ locateFile: p => p.endsWith('.wasm') ? `${publicUrl}/${p}` : p })
          : rawModule;
        setWasmModule(window.wasmModule);
      } catch (error) {
        console.error('Failed to load spire.xls.js WASM module:', error);
      }
    })();
  }, []);

  // Function to unmerge cells in an Excel worksheet
  const UnmergeCells = async () => {
    const wasmModule = window.wasmModule.spirexls;

    if (wasmModule) {
      // Load font into Virtual File System (VFS)
      await window.spire.FetchFileToVFS('Arial.ttf', '/Library/Fonts/', `${process.env.PUBLIC_URL}/static/font/`);


      // Load the Excel files into the virtual file system (VFS)
      let inputFileName = 'merged.xlsx';
      await window.spire.FetchFileToVFS(inputFileName, '', `${process.env.PUBLIC_URL}/static/data/`);


      // Create a new workbook
      let workbook = new wasmModule.Workbook();


      // Load an Excel document
      workbook.LoadFromFile({ fileName: inputFileName });

      // Get the first worksheet
      let sheet = workbook.Worksheets.get(0);

      // Unmerge the particular cell in the worksheet
      sheet.Range.get("A1").UnMerge();

      // Define the output file name
      const outputFileName = "UnmergeCells.xlsx";

      // Save the workbook to the specified path
      workbook.SaveToFile({ fileName: outputFileName, version: wasmModule.ExcelVersion.Version2010 });

      // Read the saved file and convert to Blob object
      const modifiedFileArray = window.dotnetRuntime.Module.FS.readFile(outputFileName);
      const modifiedFile = new Blob([modifiedFileArray], { type: 'application/vnd.openxmlformats-officedocument.spreadsheetml.sheet' });

      // Create a URL for the Blob and initiate download
      const url = URL.createObjectURL(modifiedFile);
      const a = document.createElement('a');
      a.href = url;
      a.download = outputFileName;
      document.body.appendChild(a);
      a.click();
      document.body.removeChild(a);
      URL.revokeObjectURL(url);

      // Clean up resources used by the workbook
      workbook.Dispose();
    }
  };

  return (
    <div style={{ textAlign: 'center', height: '300px' }}>
      <h1>Unmerge Cells in an Excel Worksheet Using JavaScript in React</h1>
      <button onClick={UnmergeCells} disabled={!wasmModule}>
        Unmerge
      </button>
    </div>
  );
}

export default App;
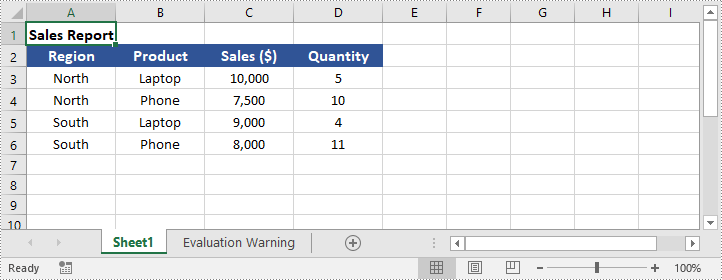
Unmerge All Merged Cells in Excel
When dealing with spreadsheets containing multiple merged cells, unmerging them all at once can help restore the original cell structure. With Spire.XLS for JavaScript, developers can easily find all merged cells in a worksheet using the Worksheet.MergedCells property and unmerge them with the CellRange.UnMerge() method. The detailed steps are as follows.
- Create a Workbook object using the new wasmModule.Workbook() method.
- Load the Excel file using the Workbook.LoadFromFile() method.
- Get a specific worksheet using the Workbook.Worksheets.get(index) method.
- Get all merged cell ranges in the worksheet using the Worksheet.MergedCells property.
- Loop through the merged cell ranges and unmerge them using the CellRange.UnMerge() method.
- Save the resulting workbook using the Workbook.SaveToFile() method.
- JavaScript
import React, { useState, useEffect } from 'react';
function App() {
  const [wasmModule, setWasmModule] = useState(null);
  // Load Spire.XLS
  useEffect(() => {
    (async () => {
      try {
        const publicUrl = process.env.PUBLIC_URL || '';
        const spireModule = await import(/* webpackIgnore: true */ `${publicUrl}/spire.xls.js`);
        const rawModule = spireModule.default || spireModule;
        window.wasmModule = typeof rawModule === 'function'
          ? await rawModule({ locateFile: p => p.endsWith('.wasm') ? `${publicUrl}/${p}` : p })
          : rawModule;
        setWasmModule(window.wasmModule);
      } catch (error) {
        console.error('Failed to load spire.xls.js WASM module:', error);
      }
    })();
  }, []);

  // Function to unmerge cells in an Excel worksheet
  const UnmergeCells = async () => {
    const wasmModule = window.wasmModule.spirexls;

    if (wasmModule) {
      // Load font into Virtual File System (VFS)
      await window.spire.FetchFileToVFS('Arial.ttf', '/Library/Fonts/', `${process.env.PUBLIC_URL}/static/font/`);


      // Load the Excel files into the virtual file system (VFS)
      let inputFileName = 'merged.xlsx';
      await window.spire.FetchFileToVFS(inputFileName, '', `${process.env.PUBLIC_URL}/static/data/`);


      // Create a new workbook
      let workbook = new wasmModule.Workbook();


      // Load an Excel document
      workbook.LoadFromFile({ fileName: inputFileName });

      // Get the first worksheet
      let sheet = workbook.Worksheets.get(0);

      // Get all merged cell ranges in the worksheet and put them into a CellRange array
      let range = sheet.MergedCells;

      // Loop through the array and unmerge all merged cell ranges
      for (let cell of range) {
        cell.UnMerge();
      }

      // Define the output file name
      const outputFileName = "UnmergeAllMergedCells.xlsx";

      // Save the workbook to the specified path
      workbook.SaveToFile({ fileName: outputFileName, version: wasmModule.ExcelVersion.Version2010 });

      // Read the saved file and convert to Blob object
      const modifiedFileArray = window.dotnetRuntime.Module.FS.readFile(outputFileName);
      const modifiedFile = new Blob([modifiedFileArray], { type: 'application/vnd.openxmlformats-officedocument.spreadsheetml.sheet' });

      // Create a URL for the Blob and initiate download
      const url = URL.createObjectURL(modifiedFile);
      const a = document.createElement('a');
      a.href = url;
      a.download = outputFileName;
      document.body.appendChild(a);
      a.click();
      document.body.removeChild(a);
      URL.revokeObjectURL(url);

      // Clean up resources used by the workbook
      workbook.Dispose();
    }
  };

  return (
    <div style={{ textAlign: 'center', height: '300px' }}>
      <h1>Unmerge Cells in an Excel Worksheet Using JavaScript in React</h1>
      <button onClick={UnmergeCells} disabled={!wasmModule}>
        Unmerge
      </button>
    </div>
  );
}

export default App;
Get a Free License
To fully experience the capabilities of Spire.XLS for JavaScript without any evaluation limitations, you can request a free 30-day trial license.
Convert Word to Markdown and Markdown to Word with JavaScript in React
2025-02-12 08:00:00 Written by AdministratorSeamless conversion between Word documents and Markdown files is increasingly essential in web development for boosting productivity and interoperability. Word documents dominate in complex formatting, while Markdown offers a simple, universal approach to content creation. Enabling conversion between the two within a React application allows users to work in their preferred format while ensuring compatibility across different platforms, streamlining workflows without relying on external tools. In this article, we will explore how to use Spire.Doc for JavaScript to convert Word to Markdown and Markdown to Word with JavaScript in React applications.
Install Spire.Doc for JavaScript
To get started with conversion between Word and Markdown in a React application, you can either download Spire.Doc for JavaScript from our website or install it via npm with the following command:
npm i spire.officeThe downloaded product package integrates Spire.Doc for JavaScript, Spire.XLS for JavaScript, Spire.PDF for JavaScript, and Spire.Presentation for JavaScript. To use the features of Spire.Doc for JavaScript, you need to copy the corresponding files (spire.doc.js, Spire.Doc.Wasm.zip, spire.common.js, Spire.Common.Wasm.zip, and the _framework folder) to the public folder of your project. To ensure proper text rendering, you can add relevant font files with a custom path. In the following example, the font is added to the path: public\static\font.
For more details, refer to the documentation: How to Integrate Spire.Doc for JavaScript in a React Project
Convert Word to Markdown with JavaScript
The Spire.Doc for JavaScript provides a WebAssembly module that enables loading Word documents from the VFS and converting them to Markdown. Developers can achieve this conversion by fetching the documents to the VFS, loading them using the Document.LoadFromFile() method, and saving them as Markdown with the Document.SaveToFile() method. The process involves the following steps:
- Load the spire.doc.js file to initialize the WebAssembly module.
- Fetch the Word document into the virtual file system using the window.spire.FetchFileToVFS() method.
- Create a Document instance in the WebAssembly module using the new wasmModule.Document() method.
- Load the Word document into the Document instance with the Document.LoadFromFile() method.
- Convert the document to Markdown format and save it to the VFS using the Document.SaveToFile() method.
- Read and download the file, or use it as needed.
- JavaScript
import React, { useState, useEffect } from 'react';

function App() {
  const [wasmModule, setWasmModule] = useState(null);
  // Load Spire.Doc
  useEffect(() => {
    (async () => {
      try {
        const publicUrl = process.env.PUBLIC_URL || '';
        const spireModule = await import(/* webpackIgnore: true */ `${publicUrl}/spire.doc.js`);
        const rawModule = spireModule.default || spireModule;
        window.wasmModule = typeof rawModule === 'function'
          ? await rawModule({ locateFile: p => p.endsWith('.wasm') ? `${publicUrl}/${p}` : p })
          : rawModule;
        setWasmModule(window.wasmModule);
      } catch (error) {
        console.error('Failed to load spire.doc.js WASM module:', error);
      }
    })();
  }, []);

  // Function to convert Word to Markdown
  const ConvertWordToMD = async () => {
    const wasmModule = window.wasmModule.spiredoc;

    if (wasmModule) {
      // Load the font files into the virtual file system (VFS)
      await window.spire.FetchFileToVFS('CALIBRI.ttf', '/Library/Fonts/', `${process.env.PUBLIC_URL}/static/font/`);

      // Specify the input file name and the output file name
      const inputFileName = 'sample.docx';
      const outputFileName = 'WordToMarkdown.md';

      // Fetch the input file and add it to the VFS
      await window.spire.FetchFileToVFS(inputFileName, '', `${process.env.PUBLIC_URL}/static/data/`);

      // Create an instance of the Document class
      const doc = new wasmModule.Document();

      // Load the Word document
      doc.LoadFromFile(inputFileName);

      // Save the document to a Markdown file
      doc.SaveToFile({ fileName: outputFileName, fileFormat: wasmModule.FileFormat.Markdown });

      // Release resources
      doc.Dispose();

      // Read the markdown file
      const mdContent = window.dotnetRuntime.Module.FS.readFile(outputFileName)

      // Generate a Blob from the markdown file and trigger a download
      const blob = new Blob([mdContent], { type: 'text/plain' });
      const url = URL.createObjectURL(blob);
      const a = document.createElement("a");
      a.href = url;
      a.download = outputFileName;
      document.body.appendChild(a);
      a.click();
      document.body.removeChild(a);
      URL.revokeObjectURL(url);
    }
  };

  return (
    <div style={{ textAlign: 'center', height: '300px' }}>
      <h1>Convert Word to Markdown Using JavaScript in React</h1>
      <button onClick={ConvertWordToMD} disabled={!wasmModule}>
        Convert and Download
      </button>
    </div>
  );
}

export default App;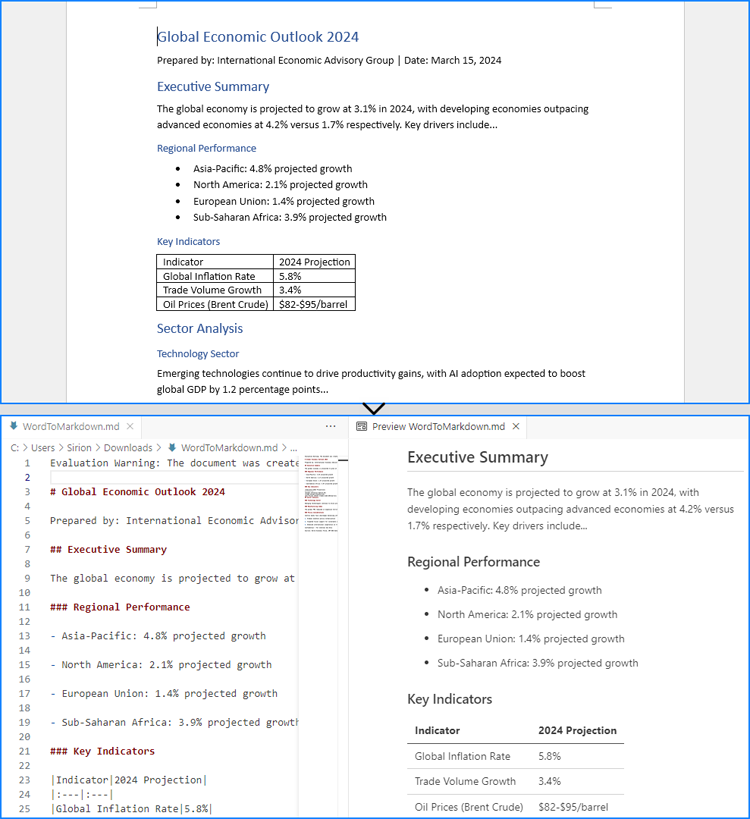
Convert Markdown to Word with JavaScript
The Document.LoadFromFile() method can also be used to load a Markdown file by specifying the file format parameter as wasmModule.FileFormat.Markdown. Then, the Markdown file can be exported as a Word document using the Document.SaveToFile() method.
For Markdown strings, developers can write them as Markdown files into the virtual file system using the window.dotnetRuntime.Module.FS.writeFile() method, and then convert them to Word documents.
The detailed steps for converting Markdown content to Word documents are as follows:
- Load the spire.doc.js file to initialize the WebAssembly module.
- Load required font files into the virtual file system using the window.spire.FetchFileToVFS() method.
- Import Markdown content:
- For files: Use the window.spire.FetchFileToVFS() method to load the Markdown file into the VFS.
- For strings: Write Markdown content to the VFS via the window.dotnetRuntime.Module.FS.writeFile() method.
- Instantiate a Document object via the new wasmModule.Document() method within the WebAssembly module.
- Load the Markdown file into the Document instance using the Document.LoadFromFile({ filename: string, fileFormat: wasmModule.FileFormat.Markdown }) method.
- Convert the Markdown file to a Word document and save it to the VFS using the Document.SaveToFile( { filename: string, fileFormat:wasmModule.FileFormat.Docx2019 }) method.
- Retrieve and download the generated Word file from the VFS, or process it further as required.
- JavaScript
import React, { useState, useEffect } from 'react';

function App() {
  const [wasmModule, setWasmModule] = useState(null);
  // Load Spire.Doc
  useEffect(() => {
    (async () => {
      try {
        const publicUrl = process.env.PUBLIC_URL || '';
        const spireModule = await import(/* webpackIgnore: true */ `${publicUrl}/spire.doc.js`);
        const rawModule = spireModule.default || spireModule;
        window.wasmModule = typeof rawModule === 'function'
          ? await rawModule({ locateFile: p => p.endsWith('.wasm') ? `${publicUrl}/${p}` : p })
          : rawModule;
        setWasmModule(window.wasmModule);
      } catch (error) {
        console.error('Failed to load spire.doc.js WASM module:', error);
      }
    })();
  }, []);

  // Function to convert Markdown to Word
  const ConvertMDToWord = async () => {
    const wasmModule = window.wasmModule.spiredoc;

    if (wasmModule) {
      // Load the font files into the virtual file system (VFS)
      await window.spire.FetchFileToVFS('CALIBRI.ttf', '/Library/Fonts/', `${process.env.PUBLIC_URL}/static/font/`);

      // Create an instance of the Document class
      const doc = new wasmModule.Document();

      // Specify the output file name
      const outputFileName = 'MarkdownStringToWord.docx';

      // Fetch the Markdown file to the VFS and load it into the Document instance
      // window.spire.FetchFileToVFS('MarkdownExample.md', '', `${process.env.PUBLIC_URL}/static/data/`);
      // doc.LoadFromFile({ fileName: 'MarkdownExample.md', fileFormat: wasmModule.FileFormat.Markdown });

      // Define the Markdown string
      const markdownString = '# Project Aurora: Next-Gen Climate Modeling System *\n' +
          '## Overview\n' +
          'A next-generation climate modeling platform leveraging AI to predict regional climate patterns with 90%+ accuracy. Built for researchers and policymakers.\n' +
          '### Key Features\n' +
          '- * Real-time atmospheric pattern recognition\n' +
          '- * Carbon sequestration impact modeling\n' +
          '- * Custom scenario simulation builder\n' +
          '- * Historical climate data cross-analysis\n' +
          '\n' +
          '## Sample Usage\n' +
          '| Command | Description | Example Output |\n' +
          '|---------|-------------|----------------|\n' +
          '| `region=asia` | Runs climate simulation for Asia | JSON with temperature/precipitation predictions |\n' +
          '| `model=co2` | Generates CO2 impact visualization | Interactive 3D heatmap |\n' +
          '| `year=2050` | Compares scenarios for 2050 | Tabular data with Δ values |\n' +
          '| `format=netcdf` | Exports data in NetCDF format | .nc file with metadata |'

      // Write the Markdown string to a file in the VFS
      await window.dotnetRuntime.Module.FS.writeFile('Markdown.md', markdownString, {encoding: 'utf8'})

      // Load the Markdown file from the VFS
      doc.LoadFromFile({ fileName: 'Markdown.md', fileFormat: wasmModule.FileFormat.Markdown });

      // Save the document to a Word file
      doc.SaveToFile({fileName: outputFileName, fileFormat: wasmModule.FileFormat.Docx2019});

      // Release resources
      doc.Dispose();

      // Read the Word file
      const outputWordFile = await window.dotnetRuntime.Module.FS.readFile(outputFileName)

      // Generate a Blob from the Word file and trigger a download
      const blob = new Blob([outputWordFile], { type: 'application/vnd.openxmlformats-officedocument.wordprocessingml.document' });
      const url = URL.createObjectURL(blob);
      const a = document.createElement("a");
      a.href = url;
      a.download = outputFileName;
      document.body.appendChild(a);
      a.click();
      document.body.removeChild(a);
      URL.revokeObjectURL(url);
    }
  };

  return (
      <div style={{ textAlign: 'center', height: '300px' }}>
        <h1>Convert Markdown to Word Using JavaScript in React</h1>
        <button onClick={ConvertMDToWord} disabled={!wasmModule}>
          Convert and Download
        </button>
      </div>
  );
}

export default App;
Get a Free License
To fully experience the capabilities of Spire.Doc for JavaScript without any evaluation limitations, you can request a free 30-day trial license.
