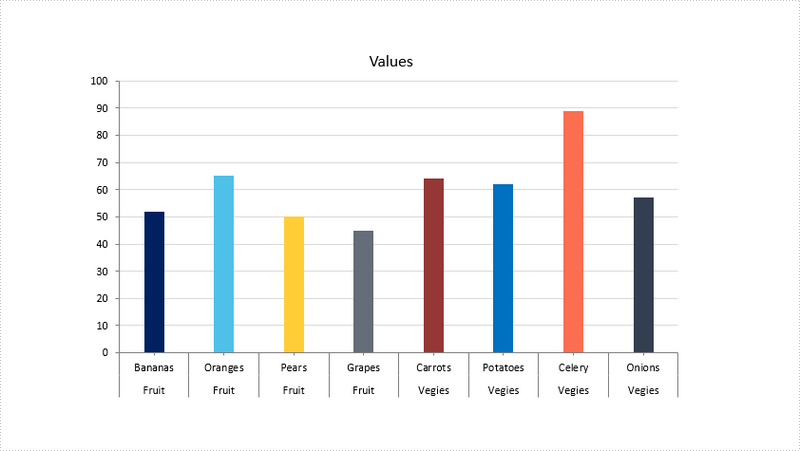
Sometimes, you may have a chart that contains two levels of horizontal axis labels, as shown in the following screenshot, and you need to group the labels by fruit and vegies. This article will show you how to group the category axis labels using Spire.Presentation.
Step 1: Create a Presentation instance and load the sample PowerPoint file.
Presentation ppt = new Presentation();
ppt.LoadFromFile("chart.pptx");
Step 2: Get the chart.
IChart chart = ppt.Slides[0].Shapes[0] as IChart;
Step 3: Get the category axis from the chart.
IChartAxis chartAxis = chart.PrimaryCategoryAxis;
Step 4: Determine if the axis has multilevel labels, if yes, group the axis labels that have the same first-level label.
if(chartAxis.HasMultiLvlLbl)
{
    chartAxis.IsMergeSameLabel = true;
}
Step 5: Save the file.
ppt.SaveToFile("result.pptx", FileFormat.Pptx2010);
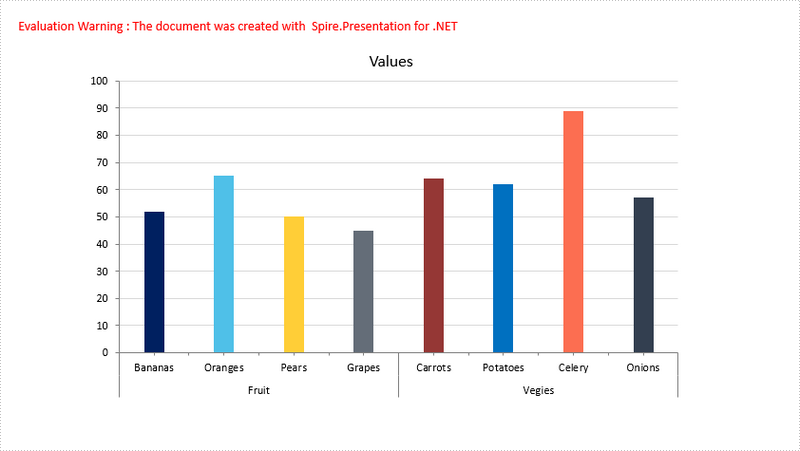
Output:
Full Code:
[C#]
using Spire.Presentation;
using Spire.Presentation.Charts;

namespace GroupLabel
{
    class Program
    {
        static void Main(string[] args)
        {
            Presentation ppt = new Presentation();
            ppt.LoadFromFile("chart.pptx");
            IChart chart = ppt.Slides[0].Shapes[0] as IChart;
            IChartAxis chartAxis = chart.PrimaryCategoryAxis;
            if (chartAxis.HasMultiLvlLbl)
            {
                //group labels
                chartAxis.IsMergeSameLabel = true;
            }
            ppt.SaveToFile("result.pptx", FileFormat.Pptx2010);
        }
    }
}
[VB.NET]
Imports Spire.Presentation
Imports Spire.Presentation.Charts

Namespace GroupLabel
	Class Program
		Private Shared Sub Main(args As String())
			Dim ppt As New Presentation()
			ppt.LoadFromFile("chart.pptx")
			Dim chart As IChart = TryCast(ppt.Slides(0).Shapes(0), IChart)
			Dim chartAxis As IChartAxis = chart.PrimaryCategoryAxis
			If chartAxis.HasMultiLvlLbl Then
				'group labels
				chartAxis.IsMergeSameLabel = True
			End If
			ppt.SaveToFile("result.pptx", FileFormat.Pptx2010)
		End Sub
	End Class
End Namespace
