A doughnut chart (also spelled donut) is a variant of the pie chart, with a blank center allowing for additional information about the data as a whole to be included. In this article, you will learn how to create a doughnut chart in PowerPoint using Spire.Presentation.
Step 1: Initialize an instance of Presentation class.
Presentation presentation = new Presentation();
Step 2: Insert a Doughnut chart in the first slide and set the chart title.
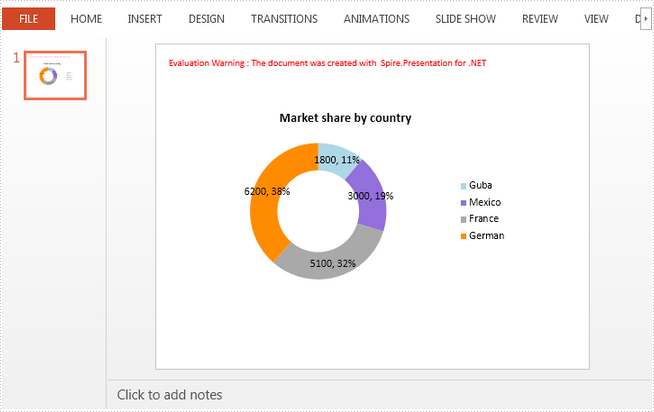
RectangleF rect = new RectangleF(40, 100, 550, 320);
IChart chart = presentation.Slides[0].Shapes.AppendChart(ChartType.Doughnut, rect, false);
chart.ChartTitle.TextProperties.Text = "Market share by country";
chart.ChartTitle.TextProperties.IsCentered = true;
chart.ChartTitle.Height = 30;
Step 3: Define the chart data.
string[] countries = new string[] { "Guba", "Mexico","France","German" };
int[] sales = new int[] { 1800, 3000, 5100, 6200 };
chart.ChartData[0, 0].Text = "Countries";
chart.ChartData[0, 1].Text = "Sales";
for (int i = 0; i < countries.Length; ++i)
{
    chart.ChartData[i + 1, 0].Value = countries[i];
    chart.ChartData[i + 1, 1].Value = sales[i];
}
Step 4: Set the data range of category labels, series label and series values.
chart.Series.SeriesLabel = chart.ChartData["B1", "B1"];
chart.Categories.CategoryLabels = chart.ChartData["A2", "A5"];
chart.Series[0].Values = chart.ChartData["B2", "B5"];
Step 5: Add data points to series and fill each data point with different color.
for (int i = 0; i < chart.Series[0].Values.Count; i++)
{
    ChartDataPoint cdp = new ChartDataPoint(chart.Series[0]);
    cdp.Index = i;
    chart.Series[0].DataPoints.Add(cdp);
}
chart.Series[0].DataPoints[0].Fill.FillType = FillFormatType.Solid;
chart.Series[0].DataPoints[0].Fill.SolidColor.Color = Color.LightBlue;
chart.Series[0].DataPoints[1].Fill.FillType = FillFormatType.Solid;
chart.Series[0].DataPoints[1].Fill.SolidColor.Color = Color.MediumPurple;
chart.Series[0].DataPoints[2].Fill.FillType = FillFormatType.Solid;
chart.Series[0].DataPoints[2].Fill.SolidColor.Color = Color.DarkGray;
chart.Series[0].DataPoints[3].Fill.FillType = FillFormatType.Solid;
chart.Series[0].DataPoints[3].Fill.SolidColor.Color = Color.DarkOrange;
Step 6: Display value and percentage in data labels.
chart.Series[0].DataLabels.LabelValueVisible = true;
chart.Series[0].DataLabels.PercentValueVisible = true;
Step 7: Adjust the hole size of doughnut chart.
chart.Series[0].DoughnutHoleSize = 60;
Step 8: Save the file.
presentation.SaveToFile("DoughnutChart.pptx", FileFormat.Pptx2013);
Output:
Full Code:
using Spire.Presentation;
using Spire.Presentation.Charts;
using Spire.Presentation.Drawing;
using System.Drawing;

namespace SetFont
{
    class Program
    {
        static void Main(string[] args)
        {
            Presentation presentation = new Presentation();
            RectangleF rect = new RectangleF(40, 100, 550, 320);
            IChart chart = presentation.Slides[0].Shapes.AppendChart(ChartType.Doughnut, rect, false);
            chart.ChartTitle.TextProperties.Text = "Market share by country";
            chart.ChartTitle.TextProperties.IsCentered = true;
            chart.ChartTitle.Height = 30;

            string[] countries = new string[] { "Guba", "Mexico", "France", "German" };
            int[] sales = new int[] { 1800, 3000, 5100, 6200 };
            chart.ChartData[0, 0].Text = "Countries";
            chart.ChartData[0, 1].Text = "Sales";
            for (int i = 0; i < countries.Length; ++i)
            {
                chart.ChartData[i + 1, 0].Value = countries[i];
                chart.ChartData[i + 1, 1].Value = sales[i];
            }
            chart.Series.SeriesLabel = chart.ChartData["B1", "B1"];
            chart.Categories.CategoryLabels = chart.ChartData["A2", "A5"];
            chart.Series[0].Values = chart.ChartData["B2", "B5"];

            for (int i = 0; i < chart.Series[0].Values.Count; i++)
            {
                ChartDataPoint cdp = new ChartDataPoint(chart.Series[0]);
                cdp.Index = i;
                chart.Series[0].DataPoints.Add(cdp);
            }
            chart.Series[0].DataPoints[0].Fill.FillType = FillFormatType.Solid;
            chart.Series[0].DataPoints[0].Fill.SolidColor.Color = Color.LightBlue;
            chart.Series[0].DataPoints[1].Fill.FillType = FillFormatType.Solid;
            chart.Series[0].DataPoints[1].Fill.SolidColor.Color = Color.MediumPurple;
            chart.Series[0].DataPoints[2].Fill.FillType = FillFormatType.Solid;
            chart.Series[0].DataPoints[2].Fill.SolidColor.Color = Color.DarkGray;
            chart.Series[0].DataPoints[3].Fill.FillType = FillFormatType.Solid;
            chart.Series[0].DataPoints[3].Fill.SolidColor.Color = Color.DarkOrange;

            chart.Series[0].DataLabels.LabelValueVisible = true;
            chart.Series[0].DataLabels.PercentValueVisible = true;
            chart.Series[0].DoughnutHoleSize = 60;

            presentation.SaveToFile("DoughnutChart.pptx", FileFormat.Pptx2013);
        }
    }
}
