Table of Contents
- Why Online JSON-to-PDF Converters Aren’t Enough
- Prerequisites & Architecture Overview
- Step 1 — Retrieve JSON Data from an API
- Step 2 — Parse and Structure the JSON Response
- Step 3 — Load Structured JSON Data into an Excel Worksheet
- Step 4 — Export the Worksheet as a PDF Report
- Complete Script — From API JSON to Structured PDF Report
- Practical Use Cases
- Final Thoughts
- JSON to PDF: FAQs
Modern applications rely heavily on APIs that return structured JSON data. While this data is ideal for software systems, stakeholders and business teams often need information presented in a readable, shareable format — and PDF reports remain one of the most widely accepted standards for documentation, auditing, and distribution.
Instead of manually converting JSON files using online tools, developers can automate the entire workflow — from retrieving live API data to generating structured PDF reports.
In this tutorial, you’ll learn how to build an end-to-end automation pipeline using Python:
- Retrieve JSON data from an API
- Parse and structure the response
- Load the data into an Excel worksheet
- Export the worksheet as a well-formatted PDF report
This approach is ideal for scheduled reporting, SaaS dashboards, analytics exports, and backend automation systems.
Why Online JSON-to-PDF Converters Aren’t Enough
Online converters can be useful for quick, one-time tasks. However, they often fall short when working with live APIs or automated workflows.
Common limitations include:
- No ability to pull data directly from APIs
- Lack of automation or scheduling support
- Limited formatting and report layout control
- Difficulty handling nested JSON structures
- Privacy concerns when uploading sensitive data
- No integration with backend pipelines or CI/CD systems
For developers building automated reporting systems, a programmatic workflow provides far more flexibility, scalability, and control. Using Python and Spire.XLS, you can generate structured reports directly from API responses without manual intervention.
Prerequisites & Architecture Overview: JSON API → Excel → PDF Pipeline
Before building the automation workflow, make sure your environment is prepared:
pip install spire.xls requests
Why Use Excel as an Intermediate Layer?
Instead of converting JSON directly to PDF, this tutorial uses Excel as a structured reporting layer. This approach provides several advantages:
- Converts unstructured JSON into clean tabular layouts
- Allows easy formatting and column control
- Ensures consistent PDF output
- Supports future enhancements like charts and summaries
Pipeline Architecture
The automation process follows a structured transformation pipeline:
- API Layer : Retrieves live JSON data from backend services
- Data Processing Layer : Normalizes and flattens JSON structures
- Report Layout Layer (Excel) : Organizes data into readable tables
- Export Layer (PDF) : Generates a shareable final report
This layered approach improves scalability and keeps the reporting logic flexible for future automation scenarios.
Step 1 — Retrieve JSON Data from an API
Most automated reporting workflows begin by collecting live data from an API. Instead of manually exporting files, your script directly pulls the latest records from backend services, analytics platforms, or SaaS applications. This ensures:
- Reports always contain up-to-date data
- No manual download or conversion steps
- Easy integration into scheduled automation pipelines
Below is an example showing how to retrieve JSON data using Python:
import requests

# Example API endpoint
url = "https://api.example.com/employees"

headers = {
    "Authorization": "Bearer YOUR_API_TOKEN"
}

response = requests.get(url, headers=headers, timeout=30)

if response.status_code != 200:
    raise Exception(f"API request failed: {response.status_code}")

api_data = response.json()

print("Records retrieved:", len(api_data))
Key Practices:
- Always validate the HTTP status code
- Include authentication headers when needed
- Handle rate limits and API throttling
- Prepare for pagination when datasets are large
The examples in this tutorial use the popular Python requests library for handling HTTP communication; refer to the official Requests documentation for advanced authentication and session management patterns.
Step 2 — Parse and Structure the JSON Response
Not all JSON files share the same structure. Some APIs return a simple list of records, while others wrap data inside objects or include nested arrays and subfields. Directly writing complex JSON into Excel often leads to errors or unreadable reports.
Understand Different JSON Structures
| JSON Type | Example Structure | Direct Excel Export |
|---|---|---|
| Simple List | [ {…}, {…} ] | Works directly |
| Wrapped List | { "employees": [ {…} ] } | ⚠ Extract list first |
| Nested Objects | { "address": { "city": "NY" } } | ⚠ Flatten fields |
| Nested Arrays | { "skills": ["Python", "SQL"] } | ⚠ Convert to string |
A normalized structure should look like:
[
   {"id":1,"name":"Alice","city":"NY","skills":"Python, SQL"}
]
This format can be written directly into Excel rows. If you’re unfamiliar with how nested objects and arrays are structured, reviewing the official JSON data format specification can help clarify how complex API responses are organized.
Normalize JSON Before Generating Reports
Instead of manually modifying JSON for every API, you can automatically:
- Detect wrapped lists
- Flatten nested objects
- Convert arrays into readable strings
- Standardize data for reporting
Below is a reusable normalization helper:
def normalize_json(input_json):

    # Step 1: detect wrapped list
    if isinstance(input_json, dict):
        for value in input_json.values():
            if isinstance(value, list):
                input_json = value
                break

    normalized = []

    for item in input_json:
        flat_item = {}

        for key, value in item.items():

            # flatten nested dict
            if isinstance(value, dict):
                for sub_key, sub_val in value.items():
                    flat_item[f"{key}_{sub_key}"] = str(sub_val)

            # convert lists to string
            elif isinstance(value, list):
                flat_item[key] = ", ".join(map(str, value))

            else:
                flat_item[key] = str(value)

        normalized.append(flat_item)

    return normalized
Note: Deeply nested multi-level JSON structures may require additional recursive flattening depending on API complexity.
Usage Example:
with open("data.json", "r", encoding="utf-8") as f:
    raw_data = json.load(f)

structured_data = normalize_json(raw_data)
This ensures the dataset is safe for Excel export regardless of JSON complexity.
Step 3 — Load Structured JSON Data into an Excel Worksheet
Excel acts as a structured reporting layer after JSON normalization. Once complex JSON structures have been flattened into a simple list of dictionaries, the data can be written directly into rows and columns for further formatting and PDF export.
Using Spire.XLS for Python, developers can build, modify, and format Excel reports entirely through code—without requiring Microsoft Excel—making it easy to integrate advanced spreadsheet operations into automated reporting workflows.
Create Workbook and Worksheet
from spire.xls import Workbook

workbook = Workbook()
sheet = workbook.Worksheets[0]
How It Works:
- Initializes a new Excel file in memory.
- Accesses the first worksheet.
- Prepares a canvas for writing structured data.
Write Headers and Data Rows
headers = list(structured_data[0].keys())

for col, header in enumerate(headers):
    sheet.Range[1, col + 1].Text = header

for row_idx, row in enumerate(structured_data, start=2):
    for col_idx, key in enumerate(headers):
        sheet.Range[row_idx, col_idx + 1].Text = str(row.get(key, ""))
How It Works:
- Extracts column headers from structured data.
- Writes header row first.
- Iterates through records and fills rows sequentially.
- Converts values to strings to ensure consistent output.
Prepare Formatting Before Export
# Auto-fit columns
for i in range(1, sheet.Range.ColumnCount + 1):
    sheet.AutoFitColumn(i)

# Set a default row height for all rows
sheet.DefaultRowHeight = 18

# Set uniform margins for the sheet
sheet.PageSetup.LeftMargin = 0.2
sheet.PageSetup.RightMargin = 0.2
sheet.PageSetup.TopMargin = 0.2
sheet.PageSetup.BottomMargin = 0.2

# Enable printing of gridlines
sheet.PageSetup.IsPrintGridlines = True
Because the worksheet already defines layout and formatting, the PDF export preserves visual structure without additional rendering logic.
Step 4 — Export the Worksheet as a PDF Report
Once data is structured and formatted in Excel, exporting to PDF creates a portable, professional report suitable for:
- Distribution to stakeholders
- Compliance documentation
- Automated reporting pipelines
- Archival storage
Save Excel Worksheet as PDF Report
sheet.SaveToPdf("output.pdf")
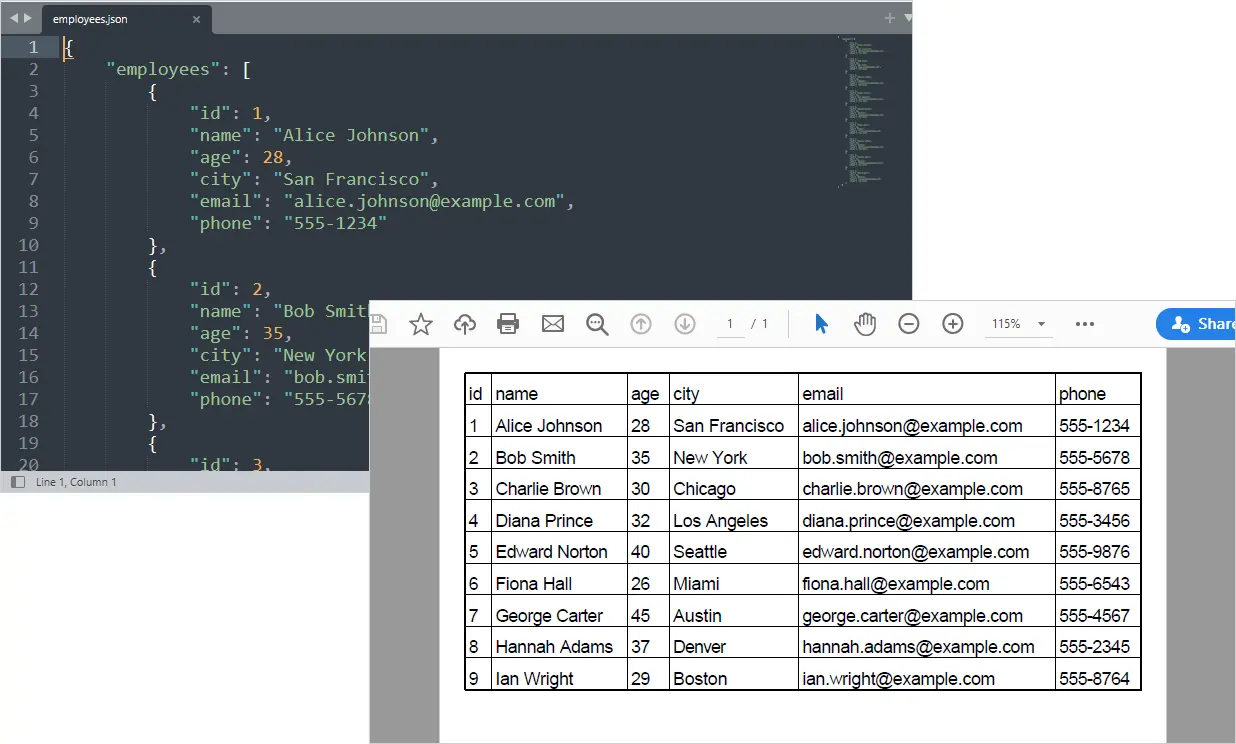
Your structured PDF report is now generated from API data automatically.
Output:
You May Also Like: Convert Excel to PDF in Python
Complete Script — From API JSON to Structured PDF Report
from spire.xls import *
from spire.xls.common import *
import json
import requests

def normalize_json(input_json):

    # Step 1: detect wrapped list
    if isinstance(input_json, dict):
        for value in input_json.values():
            if isinstance(value, list):
                input_json = value
                break

    normalized = []

    for item in input_json:
        flat_item = {}

        for key, value in item.items():

            # flatten nested dict
            if isinstance(value, dict):
                for sub_key, sub_val in value.items():
                    flat_item[f"{key}_{sub_key}"] = str(sub_val)

            # convert lists to string
            elif isinstance(value, list):
                flat_item[key] = ", ".join(map(str, value))

            else:
                flat_item[key] = str(value)

        normalized.append(flat_item)

    return normalized

# =========================
# Step 1: Get JSON from API
# =========================
api_url = "https://api.example.com/employees"

response = requests.get(api_url)

if response.status_code != 200:
    raise Exception(f"API request failed: {response.status_code}")

raw_data = response.json()

# =========================
# Step 2: Normalize JSON
# =========================
data = normalize_json(raw_data)

# =========================
# Step 3: Create Workbook
# =========================
workbook = Workbook()
sheet = workbook.Worksheets[0]

# Write headers
headers = list(data[0].keys())
for col, header in enumerate(headers):
    sheet.Range[1, col + 1].Text = header

# Write rows
for row_idx, row in enumerate(data, start=2):
    for col_idx, key in enumerate(headers):
        sheet.Range[row_idx, col_idx + 1].Text = row.get(key, "")

# =========================
# Step 4: Format worksheet
# =========================

# Set conversion settings to adjust sheet layout
workbook.ConverterSetting.SheetFitToPageRetainPaperSize = True  # Retain paper size during conversion
workbook.ConverterSetting.SheetFitToWidth = True  # Fit sheet to width during conversion

# Auto-fit columns
for i in range(1, sheet.Range.ColumnCount + 1):
    sheet.AutoFitColumn(i)

# Set uniform margins for the sheet
sheet.PageSetup.LeftMargin = 0.2
sheet.PageSetup.RightMargin = 0.2
sheet.PageSetup.TopMargin = 0.2
sheet.PageSetup.BottomMargin = 0.2

# Enable printing of gridlines
sheet.PageSetup.IsPrintGridlines = True

# Set a default row height for all rows
sheet.DefaultRowHeight = 18

# =========================
# Step 5: Export to PDF
# =========================
sheet.SaveToPdf("output.pdf")
workbook.Dispose()
If your data source is a local JSON file rather than a live API, you can load the data directly from disk before generating the PDF report.
with open("data.json", "r", encoding="utf-8") as f:
    raw_data = json.load(f)
Practical Use Cases
This automation workflow can be applied across a wide range of data-driven reporting scenarios:
- Automated API reporting pipelines — Generate daily or weekly PDF reports from backend services without manual exports.
- SaaS usage and activity summaries — Convert application analytics APIs into structured customer or internal reports.
- Financial and HR reporting exports — Transform structured API data into standardized PDF documents for internal distribution.
- Analytics dashboard snapshots — Capture API-driven metrics and convert them into shareable executive reports.
- Scheduled business intelligence reports — Automatically build PDF summaries from data warehouse or analytics APIs.
- Compliance and audit documentation — Produce consistent, timestamped PDF records from structured API datasets.
Final Thoughts
Automating PDF report generation from JSON API responses allows developers to build scalable reporting pipelines that eliminate manual processing. By combining Python’s API capabilities with Spire.XLS for Python’s Excel and PDF export features, you can create structured, professional reports directly from live data sources.
Whether you’re generating weekly business reports, internal dashboards, or customer deliverables, this workflow provides flexibility, automation, and full control over the report generation process.
JSON to PDF: FAQs
Can I convert JSON directly to PDF without Excel?
Yes, but using Excel as an intermediate layer makes it easier to structure tables, control layouts, and generate consistent, professional report formatting.
How do I handle large or paginated API responses?
Iterate through pages or tokens provided by the API and merge all results into a single dataset before generating the PDF report.
Can this workflow run automatically on a schedule?
Yes. You can automate the script using cron jobs, Windows Task Scheduler, CI/CD pipelines, or backend services to generate reports regularly.
How do I customize the PDF report layout?
Format the Excel worksheet before exporting — adjust column widths, apply styles, freeze headers, or add charts. These settings will be preserved in the PDF.
What if the API returns missing or inconsistent fields?
Use safe extraction methods like .get() with default values when parsing JSON to prevent errors and maintain consistent table structures.