When it comes to data management, color is often more than just a visual aid. It represents a vital layer of information. Whether you are highlighting overdue invoices in red or marking completed projects in green, these visual cues help us navigate complex datasets at a glance. However, a common frustration arises when you need to turn those colors into numbers: Excel lacks a native, one-click function to count colored cells in Excel. In this guide, we will explore three effective methods, ranging from simple manual tricks to advanced automation with Python, to help you master this essential task.
- Counting Highlighted Excel Cells Without VBA
- Count Colored Excel Cells Using Python
- Handling Conditional Formatting
Method 1: Counting Highlighted Excel Cells Without VBA
If you are dealing with a one-off report or a small dataset, you might prefer a solution that uses only the standard Excel interface. Fortunately, you can leverage built-in features to achieve accurate results without touching a single line of VBA. There are two primary manual ways to tackle this: the Filter method for dynamic counting and the Find method for a quick tally.
A. The Filter and SUBTOTAL Method
This is the most reliable manual technique for counting Excel cells by color in dynamic datasets. Unlike the standard COUNT function, SUBTOTAL can be configured to ignore hidden rows, making it the perfect partner for filters.
-
Step 1: In a cell outside your data range, insert the formula
=SUBTOTAL(103, A2:A100). The code103tells Excel to count non-empty visible cells. - Step 2: Select your header row and press "Ctrl + Shift + L" to enable filters.
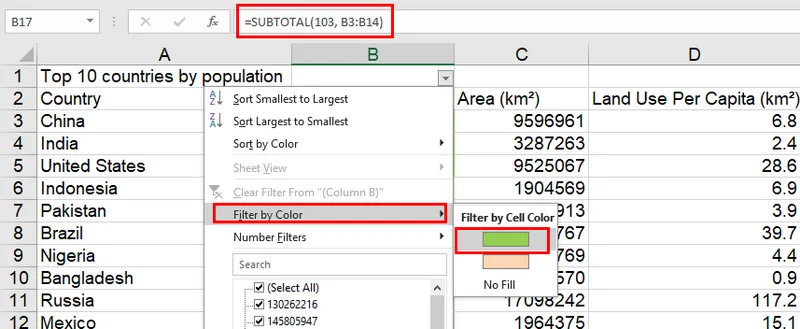
- Step 3: Click the filter dropdown on your colored column, select Filter by Color, and choose your target shade.
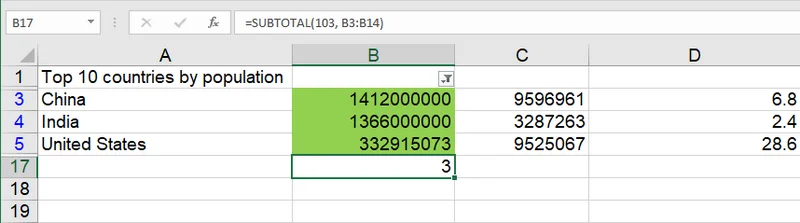
- Step 4: The formula will automatically update to show only the count of the filtered colored cells.
B. The Find and Select Method
If you just need a quick count without setting up formulas, the Find tool is surprisingly effective. This method scans the sheet for a specific format and tells you how many instances it found in the status bar.
- Step 1: Press Ctrl + F to open the Find and Replace dialog and click Options.
- Step 2: Click the small arrow next to the Format button and select Clear Find Format. This is a critical step to ensure no previous search settings interfere with your current search.
- Step 3: Click the Format... button.
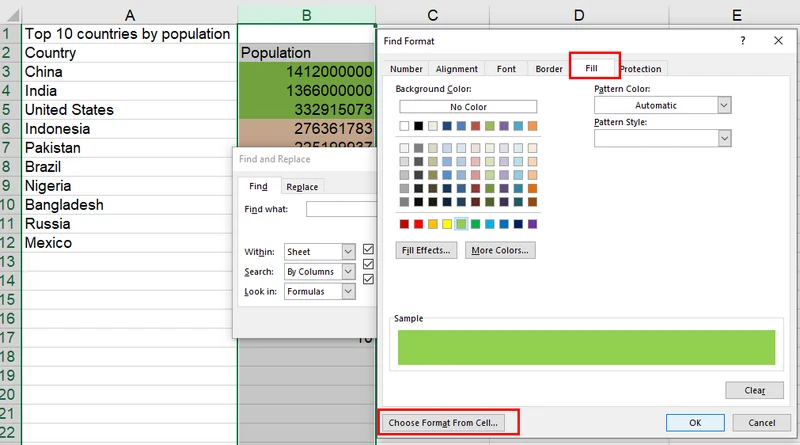
- Step 4: In the popup dialog, navigate to the Fill tab.
- Step 5: Either manually select your target color or use Choose Format From Cell. If you use the sampler, quickly check the Font, Border, and Number tabs to ensure they haven't been automatically filled; if they have, clear those specific settings.
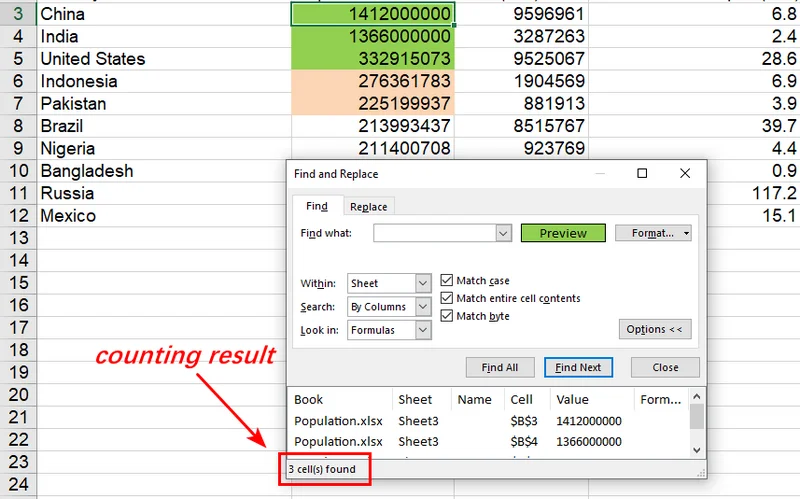
- Step 6: Ensure the Find what text box is completely empty.
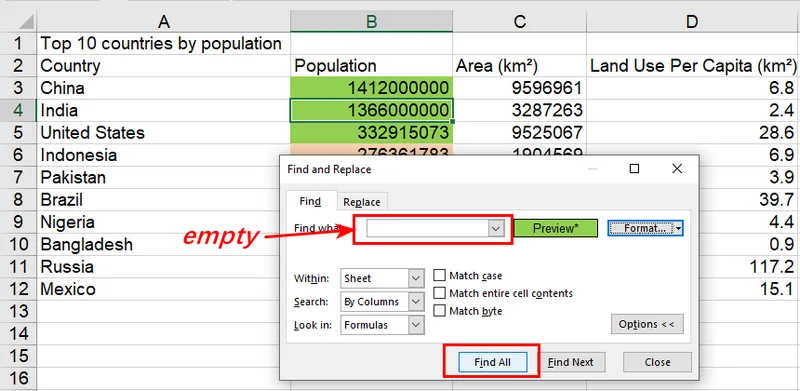
- Step 7: Click Find All. You will see the total count at the bottom of the window.
Method 2: Count Colored Excel Cells Using Python (Static Fill)
While manual filters work for quick checks, they fall short when you need to process hundreds of files. This is where Free Spire.XLS for Python shines, allowing you to programmatically count highlighted cells in Excel by accessing the style properties of every cell. Since manually filled colors are stored as static attributes, the most robust approach for counting is to sample the target color from an existing reference cell.
This sampling technique ensures that colored cells in Excel are counted accurately, even if the file uses complex theme colors or custom RGB tints that are hard to define manually.
- Step 1: Load your workbook and access the specific worksheet using index.
- Step 2: Sample the ARGB value from a reference cell (e.g., B3) to define your target color.
- Step 3: Iterate through the target range to compare each cell's style and increment your count.
The following Python example demonstrates how to sample a reference cell's color to count all matching cells within a range:
from spire.xls import *
from spire.xls.common import *
# Create a Workbook object
workbook = Workbook()
# Load an Excel file
workbook.LoadFromFile(r"/input/Population.xlsx")
# Get the third worksheet
sheet = workbook.Worksheets[2]
# Sample the ARGB value from a known colored cell (B3) to ensure a perfect match
target_argb = sheet.Range["B3"].Style.Color.ToArgb()
count = 0
# Iterate through the specific range to count colored cells
for cell in sheet.Range["B1:E12"]:
if cell.Style.Color.ToArgb() == target_argb:
count += 1
# Print the result
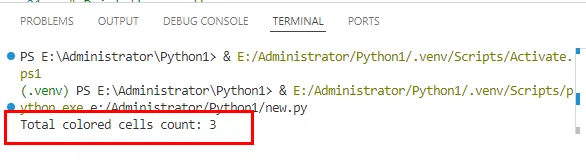
print(f"Total colored cells count: {count}")
workbook.Dispose()
The counting result:
Method 3: Handling Conditional Formatting via Logic
Static colors are straightforward, but conditional formatting is a different beast entirely. Since the color is generated dynamically based on rules, the cell’s underlying style property often remains empty. The color you see is merely a rendering layer.
To count Excel cells colored by conditional formatting, the most professional approach is to sync your logic. Instead of detecting the visual output of colored cells, you should count the underlying data that triggers the rule. This method is faster and more robust, as it bypasses the apparent rendering and prevents errors caused by varying Excel versions or themes.
- Step 1: Define your conditional formatting rule using Free Spire.XLS.
- Step 2: Use the same logical condition in your counting loop.
The following example demonstrates how to count highlighted cells in Excel based on their conditional formatting logic:
from spire.xls import *
from spire.xls.common import *
# Initialize workbook and load the source file
workbook = Workbook()
workbook.LoadFromFile(r"/input/Population.xlsx")
# Get the third worksheet
sheet = workbook.Worksheets[2]
# Define the target range for conditional formatting
data_range = sheet.Range["D3:D12"]
# Apply conditional formatting rule: Highlight cells > 10 in Red
cf = sheet.ConditionalFormats.Add()
cf.AddRange(data_range)
condition = cf.AddCondition()
condition.FormatType = ConditionalFormatType.CellValue
condition.Operator = ComparisonOperatorType.Greater
condition.FirstFormula = "10"
condition.BackColor = Color.get_Red()
# Perform logical counting synchronized with the formatting rule
count = 0
for cell in data_range:
if cell.NumberValue > 10:
count += 1
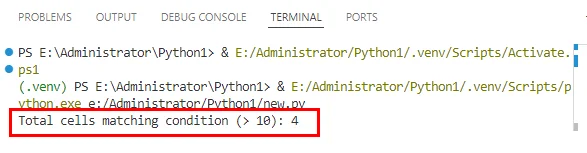
print(f"Total cells matching condition (> 10): {count}")
# Save the stylized result
#workbook.SaveToFile(r"/output/Conditional_Red_Result.xlsx", ExcelVersion.Version2016)
workbook.Dispose()
The result of counting colored cells in Excel using conditional format:
Notice: This method is ideal when the conditional formatting rules are already known. While it is technically possible to reverse-engineer underlying Excel rules via ConditionalFormats, the varying storage mechanisms across different file versions make 'Logic Sync' the most robust and high-performance approach. By bypassing complex API calls, this practice guarantees accuracy in your results.
Conclusion
Mastering how to count colored cells in Excel helps bridge visual formatting and reliable data analysis. For simple scenarios, built-in filters may be enough; for complex workflows, logic-based solutions like Free Spire.XLS provide better accuracy and scalability. By shifting from manual color counting to rule-driven reporting, your spreadsheets become a more dependable source of truth.