Working with legacy database formats like DBF is still common, but these files are not well-suited for modern workflows such as data analysis, reporting, or system integration. In many cases, you may need to convert DBF files to Excel files to make the data easier to use, share, or process. While tools like Excel or online converters can open DBF files, they lack automation, flexibility, and reliability—especially when handling large datasets or repeatable tasks.
Python provides a more scalable solution. It allows you to not only convert DBF files to Excel, but also clean data, standardize structures, and integrate the process into automated workflows.
This guide covers a practical approach to DBF to Excel conversion, including building a reusable command and generating structured Excel outputs for real-world use.
Quick Navigation
- Why Convert DBF to Excel
- Basic DBF to Excel Conversion with Python
- Generate Formatted Excel Outputs from DBF Files
- Batch Conversion and Automatic Formatting
- Command Line Tool for DBF to Excel Conversion
- Comparison of the Methods
- Best Practices and Tips
- Frequently Asked Questions
Why Convert DBF to Excel and the Common Conversion Methods
DBF files store structured data, but they come with several limitations:
- Legacy encoding formats (often causing character issues)
- Limited compatibility with modern tools
- No support for formatting or reporting
Converting DBF to Excel (XLS/XLSX) allows you to:
- Integrate with modern data pipelines
- Improve readability and usability
- Enable structured reporting and analysis
Common DBF to Excel Methods
There are several ways to handle DBF file to Excel file conversion:
- Opening DBF directly in Excel
- Using online converters
- Exporting via legacy database tools
However, these methods have clear limitations:
- ❌ No automation
- ❌ Poor scalability
- ❌ Limited control over output
- ❌ No support for structured reporting
For developers and production workflows, these approaches are not sufficient.
Python enables full control, automation, and extensibility, making it a more practical solution.
Convert DBF to Excel in Python (Basic Conversion)
To perform a basic DBF to Excel conversion in Python, the process is straightforward: read the DBF file into a structured format, then export it as an Excel file (XLSX).
In this workflow:
- The dbf library is used to read and parse DBF files, including legacy formats
- The data is organized and exported using libraries like pandas (with openpyxl as the Excel writing engine)
This approach provides a simple and practical way to convert DBF files to Excel with minimal setup.
Step 1: Install Dependencies
You can install the required libraries using pip:
pip install dbf pandas openpyxl
Step 2: Read the DBF File
import dbf
import pandas as pd

table = dbf.Table("business_demo.dbf")
table.open()

data = [{field: record[field] for field in dbf.field_names(table)} for record in table]

df = pd.DataFrame(data)
This step converts DBF records into a structured, Excel-compatible format.
Step 3: Export DBF to Excel
df.to_excel("output.xlsx", index=False)
At this stage, the DBF data is written to a standard Excel file (XLSX format), completing a basic DBF to XLSX conversion.
Below is an image showing the generated Excel file:
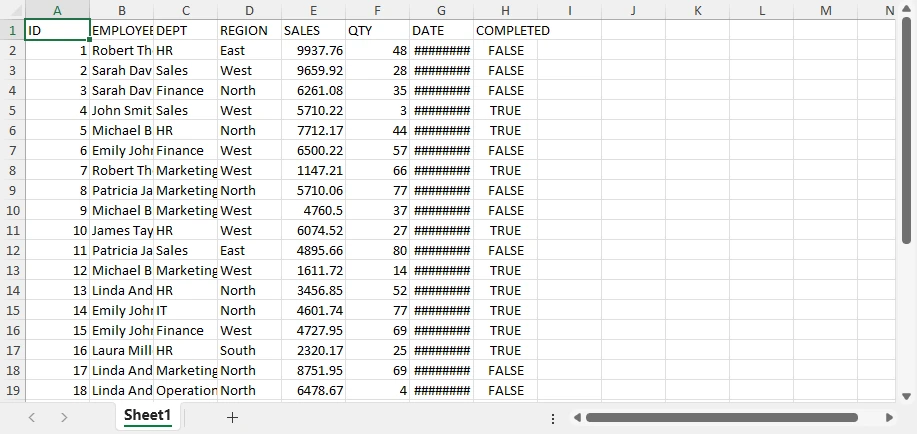
This produces a clean, structured dataset that can be used directly or further processed if needed.
Why This Method Works
This method is commonly used because it keeps the conversion process simple and reliable:
- Converts DBF records into a structured table format
- Preserves field names and data organization
- Works across different DBF variants (dBase, FoxPro, etc.)
- Requires minimal code to complete the conversion
As a result, it is suitable for quick .dbf file to .xlsx file tasks and automated workflows.
While this approach works well for basic conversion, it only generates raw Excel data and does not provide control over formatting, layout, or report structure.
If you are also working with generating Excel files from other data sources, such as CSV, JSON, and XML, you can refer to How to Import Data into Excel Files with Python for detailed instructions.
Limitations of Basic Conversion
While this basic conversion approach is powerful for quick and simple conversions, it has limitations when exporting Excel files:
- No styling or formatting
- No layout control
- No report structure
- Limited usability for business-ready outputs
The result is a raw dataset rather than a polished report.
Generate Professional Excel Reports from DBF Data
Basic DBF to Excel conversion only produces raw datasets. However, in real-world scenarios, Excel files are often used for reporting, presentation, and decision-making. To move beyond simple data export and generate structured, business-ready outputs, you can use Spire.XLS for Python.
A typical production workflow looks like this:
- Read DBF data with dbf
- Write structured Excel data with Spire.XLS
- Apply formatting and layout
- Add charts and other report elements as needed
With this approach, you can progressively enhance your Excel file—from a basic table to a fully formatted report with visual elements.
Step 1: Install Libraries
You can install the libraries using pip:
pip install spire.xls dbf
Step 2: Read DBF Data and Write It to Excel
from spire.xls import *
import dbf

table = dbf.Table("business_demo.dbf")
table.open()

data = [{field: record[field] for field in dbf.field_names(table)} for record in table]
field_names = list(dbf.field_names(table))

workbook = Workbook()
workbook.Worksheets.Clear()
sheet = workbook.Worksheets.Add("Data")

# Write header
for j, col in enumerate(field_names):
    sheet.Range[1, j+1].Value = col

# Write data
for i, record in enumerate(data, start=2):
    for j, col in enumerate(field_names):
        sheet.Range[i, j+1].Value = str(record[col])
At this stage, the DBF file has been converted into a structured Excel dataset.
Step 3: Apply Styles and Save as an Excel File
Once the data is written, you can improve readability by applying styles and layout adjustments.
# Header styling
header = sheet.Range[1, 1, 1, sheet.LastColumn]
header.Style.Font.Bold = True
header.Style.Font.Size = 12
header.Style.Color = Color.get_LightGray()
# Data borders
data_range = sheet.Range[1, 1, sheet.LastRow, sheet.LastColumn]
data_range.BorderAround(LineStyleType.Thin, ExcelColors.Black)
data_range.BorderInside(LineStyleType.Thin, ExcelColors.Black)
# Global font
sheet.AllocatedRange.Style.Font.Name = "Arial"
# Auto-fit columns
sheet.AllocatedRange.AutoFitColumns()
# Save the workbook to a file
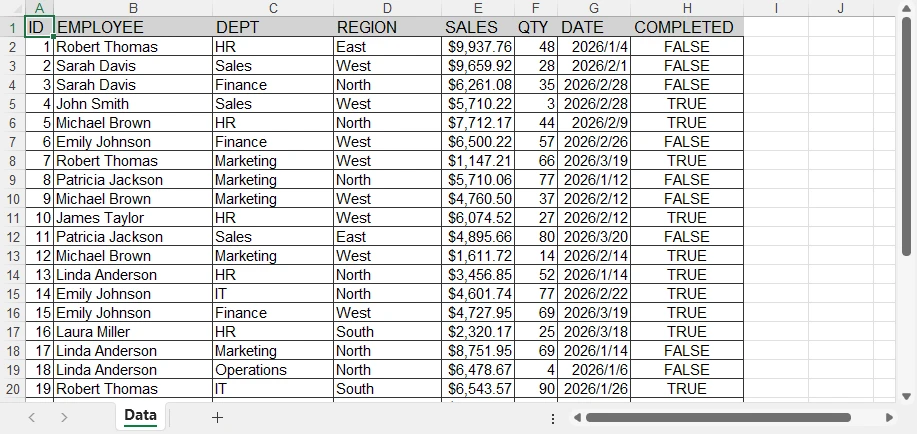
workbook.SaveToFile("output.xlsx", ExcelVersion.Version2016)
The generated Excel file looks like this:
API Notes
Spire.XLS provides a range-based styling model, which allows you to apply formatting to entire regions instead of individual cells.
- Range[row, col] → access a specific cell or region
- Style.Font → control font properties such as size, bold, and family
- BorderAround / BorderInside → add inside and outside borders
- AllocatedRange → refers to the used range in the worksheet, which includes all cells with data
- AutoFitColumns / AutoFitRows → automatically adjust column and row widths within the range
- SaveToFile → save the workbook to a file in the specified format
Note: For SaveToFile method, the second argument specifies the file format. FileFormat.Version97to2003 represents the .xls format, and FileFormat.Version2007 and above represent the .xlsx format.
This approach makes it efficient to format large datasets with minimal code.
At this point, the Excel file is no longer raw data—it has been transformed into a clean, readable table. However, it is still a formatted dataset rather than a full report.
Add Report Elements (Incremental Enhancements)
To further enhance the output, you can add analytical and visual elements.
Example 1: Add a Chart
# Aggregate data by REGION (for charting purposes)
region_sales = defaultdict(float)
for record in data:
region = record["REGION"]
sales = float(record["SALES"])
region_sales[region] += sales
# Create a summary sheet for aggregated data
summary_sheet = workbook.Worksheets.Add("Summary")
# Write summary header
summary_sheet.Range[1, 1].Value = "Region"
summary_sheet.Range[1, 2].Value = "Total Sales"
# Write aggregated results
for i, (region, total) in enumerate(region_sales.items(), start=2):
summary_sheet.Range[i, 1].Value = region
summary_sheet.Range[i, 2].Value = total
summary_sheet.Range[2, 2, summary_sheet.LastRow, 2].NumberFormat = "$#,##0.00"
# Create chart based on aggregated data
chart = summary_sheet.Charts.Add()
chart.ChartType = ExcelChartType.ColumnClustered
# Set data range (Region + Total Sales)
chart.DataRange = summary_sheet.Range[
"A1:B{}".format(len(region_sales) + 1)
]
# Position the chart in the worksheet
chart.LeftColumn = 4
chart.TopRow = 2
chart.RightColumn = 10
chart.BottomRow = 20
# Set chart title
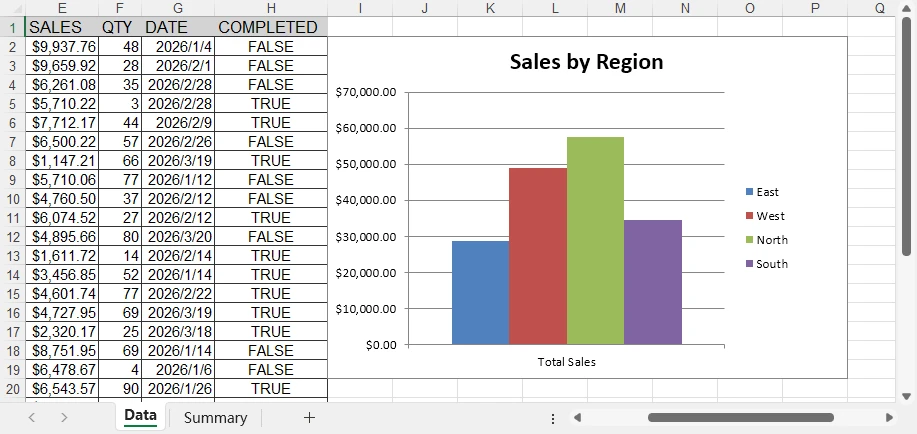
chart.ChartTitle = "Sales by Region"
Below is a preview of the chart added to the Excel sheet:
You can create many other types of charts in Excel worksheets using Spire.XLS, such as pie charts and bar charts. Choose the appropriate chart type based on your data and requirements.
Example 2: Add Conditional Formatting
# Create a conditional format in the specified range
conditions = sheet.ConditionalFormats.Add()
conditions.AddRange(sheet.Range[2, 8, sheet.LastRow, 8])
# Add a rule to the conditional format
condition1 = conditions.AddCondition()
condition1.FormatType = ConditionalFormatType.ContainsText;
condition1.FirstFormula = "TRUE"
condition1.BackColor = Color.FromRgb(144, 200, 172)
# Add another rule to the conditional format
condition2 = conditions.AddCondition()
condition2.FormatType = ConditionalFormatType.ContainsText
condition2.FirstFormula = "FALSE"
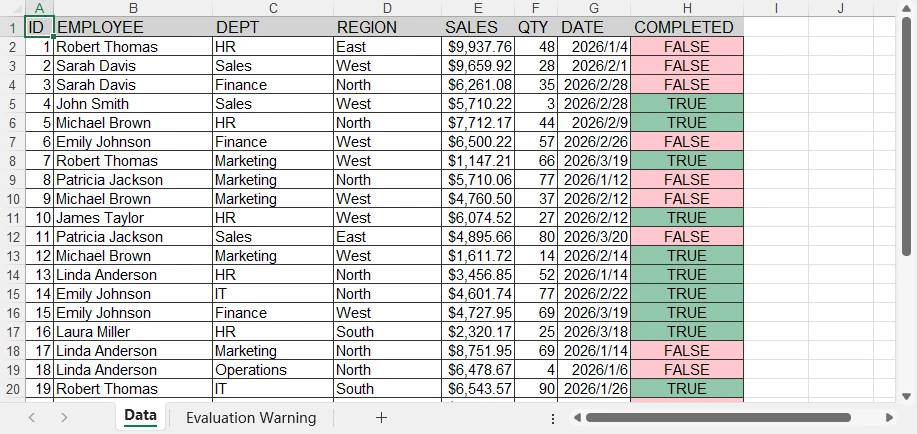
condition2.BackColor = Color.FromRgb(255, 199, 206)
Below is a preview of the generated Excel file with conditional formatting applied:
Conditional formatting allows you to achieve many special effects in Excel sheets. You can refer to How to Apply Conditional Formatting to Excel Sheets Using Python for more details.
Why This Matters
These enhancements transform the Excel file from a simple export into a reporting tool.
You can now:
- Present structured data clearly
- Highlight key information
- Visualize trends with charts
By combining structured data handling with advanced Excel features, you can turn legacy DBF files into modern, usable reports. This level of functionality is essential for business workflows, dashboards, and automated reporting systems.
Advanced Conversion: Batch Processing and Automated Formatting
For real-world workflows, DBF to Excel conversion is often not a one-time task. Instead, you may need to process multiple files automatically, especially in scenarios such as data migration or scheduled jobs.
Python makes it easy to scale DBF to Excel conversion from a single file to batch processing.
Batch Convert DBF to Excel Files
If you only need to generate basic Excel files, you can combine the conversion logic with the os module to process all DBF files in a directory.
import os
import dbf
import pandas as pd

input_folder = "dbf_files"
output_folder = "excel_files"

for file in os.listdir(input_folder):
    if file.endswith(".dbf"):
        table = dbf.Table(os.path.join(input_folder, file))
        table.open()

        df = pd.DataFrame([dict(record) for record in table])

        output_file = file.replace(".dbf", ".xlsx")
        df.to_excel(os.path.join(output_folder, output_file), index=False)
This approach enables automated DBF to Excel export across multiple files and is suitable for:
- Legacy system migration
- Data synchronization
- Scheduled ETL workflows
Batch Conversion with Automatic Formatting
When working with business data, simply exporting raw Excel files is often not enough. You may also need consistent formatting and structured output across all generated files.
Using Spire.XLS for Python, you can apply formatting automatically during batch conversion.
import os
import dbf
from spire.xls import *

input_folder = "dbf_files"
output_folder = "formatted_reports"

for file in os.listdir(input_folder):
    if file.endswith(".dbf"):
        table = dbf.Table(os.path.join(input_folder, file))
        table.open()

        data = [{field: record[field] for field in dbf.field_names(table)} for record in table]
        field_names = list(dbf.field_names(table))

        workbook = Workbook()
        workbook.Worksheets.Clear()
        sheet = workbook.Worksheets.Add("Data")

        # Write header
        for j, col in enumerate(field_names):
            sheet.Range[1, j+1].Value = col

        # Write data
        for i, record in enumerate(data, start=2):
            for j, col in enumerate(field_names):
                sheet.Range[i, j+1].Value = str(record[col])

        # Create a table with built-in style
        table_range = sheet.AllocatedRange
        table_obj = sheet.ListObjects.Create("Data", table_range)
        table_obj.BuiltInTableStyle = TableBuiltInStyles.TableStyleMedium13

        # Auto-fit layout
        sheet.AllocatedRange.AutoFitColumns()

        # Save file
        output_file = file.replace(".dbf", ".xlsx")
        workbook.SaveToFile(os.path.join(output_folder, output_file), FileFormat.Version2016)
        workbook.Dispose()
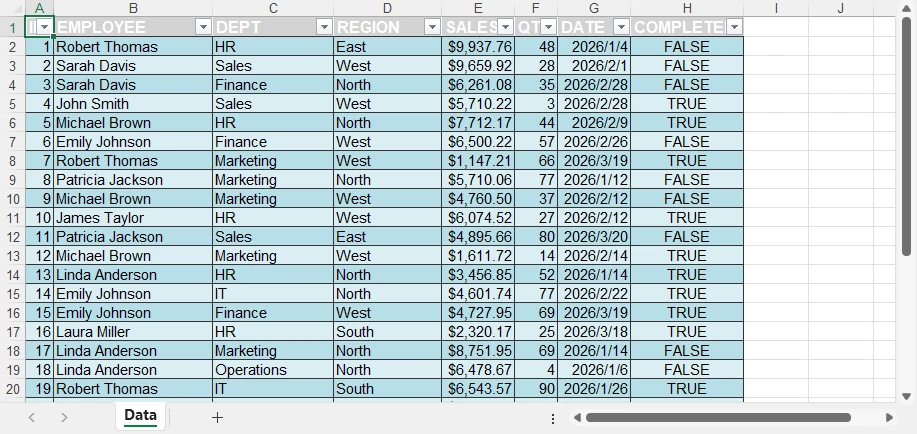
Below is a preview of the built-in table style applied to the data:
Why This Approach Matters
By combining batch processing with automatic formatting, you can:
- Convert multiple DBF files into Excel in one workflow
- Ensure consistent structure and styling across all outputs
- Reduce manual work when generating reports
- Integrate conversion into automated pipelines
This turns a simple DBF file to Excel conversion task into a scalable and production-ready solution.
With Spire.XLS, you can easily transfer data between Excel files and databases. See Data Transfer Between Excel and Database in Python for more details.
Command Line Tool for DBF to Excel Conversion
In addition to batch processing, you can further improve automation by turning your conversion logic into a reusable command-line tool.
This allows you to run DBF to Excel conversion directly from the terminal, making it suitable for scripts, scheduled tasks, and backend workflows.
Create a Command-Line Interface
You can wrap the conversion logic into a Python script that accepts input and output paths as arguments.
import sys

input_file = sys.argv[1]
output_file = sys.argv[2]
Use the Command
Once your script is ready, you can run it from the command line:
python convert.py data.dbf output.xlsx
This approach lets you reuse the same conversion logic across different environments and integrate the conversion into automated workflows with minimal effort.
Basic Conversion vs Spire.XLS for Python
When converting DBF files to Excel, the choice of approach depends on your goals.
| Capability | Basic Conversion (e.g., pandas and dbf) | Spire.XLS for Python and dbf |
|---|---|---|
| DBF to Excel export | ✅ | ✅ |
| Batch processing | ✅ | ✅ |
| Formatting & styling | ❌ | ✅ |
| Report structure | ❌ | ✅ |
| Charts & visualization | ❌ | ✅ |
When to Use Each Approach
Use basic conversion when:
- You only need to convert DBF to Excel
- The output is used for storage or further processing
- No formatting or reporting is required
Use Spire.XLS for Python and dbf when:
- You need structured Excel reports
- Formatting and layout are important
- You want to include charts or visual elements
Choosing the right approach can significantly improve both efficiency and output quality, especially when moving from simple .dbf file to .xlsx file conversion to automated reporting workflows.
Best Practices for DBF to Excel Conversion
Handle Encoding Carefully
table = dbf.Table("file.dbf", codepage="cp1252")
DBF files may use different encodings depending on their source. Always verify the correct codepage to prevent character corruption.
Validate Data Types
DBF fields do not always map cleanly to Excel formats. Check numeric, date, and boolean values before exporting to ensure accuracy.
Optimize for Large Files
When working with large datasets:
- Process data in chunks
- Avoid loading all records into memory at once
Separate Conversion and Reporting
For better flexibility and maintainability:
- Use a simple approach for DBF to Excel conversion
- Apply formatting and report elements only when needed
Conclusion
Converting DBF files to Excel is often more than just a format change—it’s about making legacy data easier to use, share, and analyze.
With Python, you can start with a simple DBF to Excel conversion and scale up to batch processing and automated workflows. For basic needs, a lightweight approach works well. But when you need structured layouts, consistent formatting, or visual elements, more advanced Excel capabilities become important.
If you’re looking to generate professional, report-ready Excel files, you can try Spire.XLS for Python. A free 30-day license is available to explore its full features in real-world scenarios.
FAQ
How do I convert a DBF file to Excel in Python?
Use a Python-based approach to read DBF data and export it to Excel. For example, you can combine dbf with tools like pandas for a quick DBF file to Excel file conversion.
What is the best way to convert DBF to XLSX?
It depends on your needs:
- For simple conversion → use a basic Python approach
- For formatted reports → use Spire.XLS for Python
Can I import a DBF file into Excel directly?
Yes, but it is not suitable for automation or large datasets. Python provides a more reliable and scalable solution.
Why is my Excel file unformatted?
Basic conversion methods only export raw data without styling. To generate formatted Excel reports, you need a tool that supports layout and styling, such as Spire.XLS for Python.
How do I create a command to convert DBF to Excel?
Wrap your conversion logic into a script and pass input/output paths as arguments. This allows you to run DBF to Excel conversion directly from the command line.