
Program Guide (111)
Children categories
Content controls play an important role in Excel, providing powerful functionality for data input, display, and user interaction. These controls include text boxes, radio buttons, checkboxes, drop-down lists, and more. They offer users more efficient, intuitive, and flexible ways of handling data, making Excel a powerful tool for data management and analysis. This article will introduce how to use Spire.XLS for Python to add content controls to Excel documents or edit content controls in Excel documents using Python.
- Add Content Controls to an Excel document in Python
- Edit Content Controls in an Excel document in Python
Install Spire.XLS for Python
This scenario requires Spire.XLS for Python and plum-dispatch v1.7.4. They can be easily installed in your Windows through the following pip commands.
pip install Spire.XLS
If you are unsure how to install, please refer to this tutorial: How to Install Spire.XLS for Python on Windows
Add Content Controls to an Excel document in Python
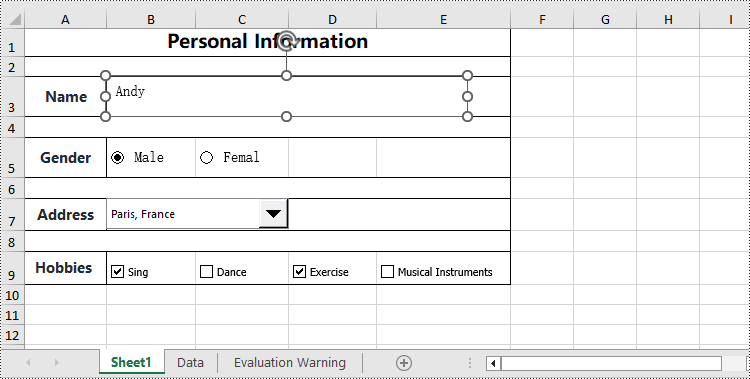
Spire.XLS for Python allows you to add content controls supported by Excel, such as text boxes, radio buttons, drop-down lists (also known as combo boxes), checkboxes, and more. The following are the detailed steps:
- Create an object of the Workbook class.
- Use the Workbook.LoadFromFile() method to load an Excel data document.
- Use the Workbook.Worksheets[] property to retrieve the desired worksheet.
- Add a text box using the Worksheet.TextBoxes.AddTextBox() method.
- Add a radio button using the Worksheet.RadioButtons.Add() method.
- Add a combo box using the Worksheet.ComboBoxes.AddComboBox() method.
- Add a checkbox using the Worksheet.CheckBoxes.AddCheckBox() method.
- Use the Workbook.SaveToFile() method to save the resulting file.
- Python
from spire.xls.common import *
from spire.xls import *

# Create a new Workbook object
workbook = Workbook()

# Load an existing Excel file
workbook.LoadFromFile("Data/Sample01.xlsx")

# Select the first worksheet
worksheet = workbook.Worksheets[0]

# Set the height of the text box (unit: points)
height = 40

# Add a text box to the worksheet
textbox = worksheet.TextBoxes.AddTextBox(3, 2, height, 400)
textbox.Line.ForeKnownColor = ExcelColors.Black
textbox.Text = "Andy"

# Add radio buttons to the worksheet
radioButton1 = worksheet.RadioButtons.Add(5, 2, height, 60)
radioButton1.Text = "Male"
radioButton1.CheckState=CheckState.Checked
radioButton2 = worksheet.RadioButtons.Add(5, 3, height, 60)
radioButton2.Text = "Female"

# Assign a data range from another worksheet to a combo box
dataSheet = workbook.Worksheets[1]
comboBoxShape = worksheet.ComboBoxes.AddComboBox(7, 2, 30, 200)
comboBoxShape.ListFillRange = dataSheet.Range["A1:A7"]
comboBoxShape.SelectedIndex=1

# Add check boxes to the worksheet
checkBox = worksheet.CheckBoxes.AddCheckBox(9, 2, height, 60)
checkBox.CheckState = CheckState.Checked
checkBox.Text = "Sing"
checkBox = worksheet.CheckBoxes.AddCheckBox(9, 3, height, 60)
checkBox.CheckState = CheckState.Unchecked
checkBox.Text = "Dance"
checkBox = worksheet.CheckBoxes.AddCheckBox(9, 4, height, 60)
checkBox.CheckState = CheckState.Checked
checkBox.Text = "Exercise"
checkBox = worksheet.CheckBoxes.AddCheckBox(9, 5, height, 100)
checkBox.CheckState = CheckState.Unchecked
checkBox.Text = "Musical Instruments"

# Save the modified workbook to a new file
workbook.SaveToFile("AddContentControls.xlsx", ExcelVersion.Version2016)

# Clean up and release the workbook object
workbook.Dispose()
Edit Content Controls in an Excel document in Python
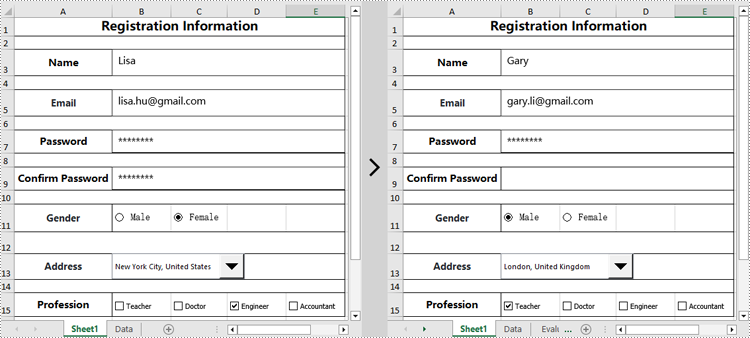
Spire.XLS for Python can also modify the properties of existing content controls in an Excel document, such as changing the text of a text box, resetting the selected item of a drop-down list, hiding a specific content control, and more. Here are the detailed steps:
- Create an object of the Workbook class.
- Use the Workbook.LoadFromFile() method to load an Excel document.
- Use the Workbook.Worksheets[] property to retrieve the desired worksheet.
- Modify the display content of a text box using the Worksheet.TextBoxes[].Text property.
- Set whether to display a specific text box using the Worksheet.TextBoxes[].Visible property.
- Set whether a radio button is checked using the Worksheet.RadioButtons[].CheckState property.
- Set the selected item of a combo box using the Worksheet.ComboBoxes[].SelectedIndex property.
- Set whether a checkbox is checked using the Worksheet.CheckBoxes[].CheckState property.
- Use the Workbook.SaveToFile() method to save the resulting file.
- Python
from spire.xls.common import *
from spire.xls import *

# Create a Workbook object
workbook = Workbook()

# Load Excel data from file
workbook.LoadFromFile("Data/Sample02.xlsx")

# Get the first worksheet
worksheet = workbook.Worksheets[0]

# Set the text content of the first textbox to "Gary"
worksheet.TextBoxes[0].Text = "Gary"

# Set the text content of the second textbox to "gary.li@gmail.com"
worksheet.TextBoxes[1].Text = "gary.li@gmail.com"

# Hide the fourth textbox
worksheet.TextBoxes[3].Visible = False

# Check the first radio button
worksheet.RadioButtons[0].CheckState = CheckState.Checked

# Set the selected index of the first combobox to 0 (the first option)
worksheet.ComboBoxes[0].SelectedIndex = 0

# Check the first checkbox
worksheet.CheckBoxes[0].CheckState = CheckState.Checked

# Uncheck the third checkbox
worksheet.CheckBoxes[2].CheckState = CheckState.Unchecked

# Save the modified workbook to a new file
workbook.SaveToFile("EditContentControls.xlsx", ExcelVersion.Version2016)

# Clean up and release the workbook object
workbook.Dispose()
Apply for a Temporary License
If you'd like to remove the evaluation message from the generated documents, or to get rid of the function limitations, please request a 30-day trial license for yourself.
In Excel, document properties refer to the metadata or information associated with an Excel file. These properties provide details about the workbook itself, such as author, title, subject, keywords, and other descriptive information. Document properties are useful for organizing and categorizing Excel files, making it easier to search, sort, and manage a collection of workbooks. In this article, you will learn how to add document properties in Excel in Python using Spire.XLS for Python.
- Add Built-in Document Properties in Excel in Python
- Add Custom Document Properties in Excel in Python
Install Spire.XLS for Python
This scenario requires Spire.XLS for Python and plum-dispatch v1.7.4. They can be easily installed in your Windows through the following pip command.
pip install Spire.XLS
If you are unsure how to install, please refer to this tutorial: How to Install Spire.XLS for Python on Windows
Add Built-in Document Properties in Excel in Python
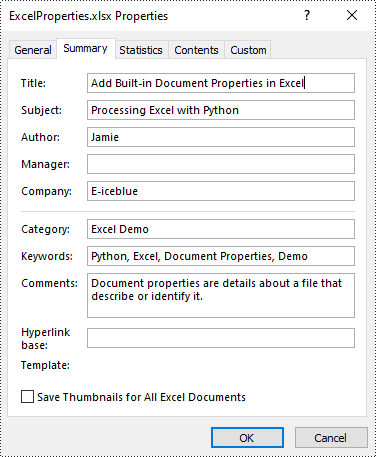
Built-in document properties are basic information about a document such as title, subject, author, category, etc. The names of these properties are predefined that cannot be edited, but Spire.XLS for Python allows you to set specific values for these properties. The following are the detailed steps.
- Create a Workbook object.
- Load an Excel document using Workbook.LoadFromFile() method.
- Get the built-in document properties of the document using Workbook.DocumentProperties property.
- Set specific document properties such as title, author, keywords and comments using the properties of BuiltInDocumentProperties class.
- Save the result document using Workbook.SaveToFile() method.
- Python
from spire.xls import *
from spire.xls.common import *

inputFile = "sample.xlsx"
outputFile = "ExcelProperties.xlsx"

# Create a Workbook object
workbook = Workbook()

# Load a sample Excel document
workbook.LoadFromFile(inputFile)

# Set built-in document properties for the Excel workbook
workbook.DocumentProperties.Author = "Jamie"
workbook.DocumentProperties.Title = "Add Built-in Document Properties in Excel"
workbook.DocumentProperties.Subject = "Processing Excel with Python"
workbook.DocumentProperties.Keywords = "Python, Excel, Document Properties, Demo"
workbook.DocumentProperties.Category = "Excel Demo"
workbook.DocumentProperties.Company = "E-iceblue"
workbook.DocumentProperties.Comments = "Document properties are details about a file that describe or identify it."

# Save the result document
workbook.SaveToFile(outputFile, FileFormat.Version2016)
workbook.Dispose()
Add Custom Document Properties in Excel in Python
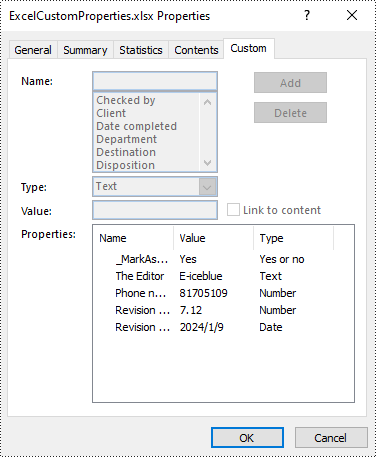
Custom document properties are additional properties that you can define for an Excel document. With Spire.XLS for Python, you can add custom properties with specified names and values through the ICustomDocumentProperties.Add() method. The following are the detailed steps.
- Create a Workbook object.
- Load an Excel document using Workbook.LoadFromFile() method.
- Get the custom document properties of the document using Workbook.CustomDocumentProperties property.
- Add custom document properties with different data types to the document using ICustomDocumentProperties.Add() method.
- Save the result document using Workbook.SaveToFile() method.
- Python
from spire.xls import *
from spire.xls.common import *

inputFile = "sample.xlsx"
outputFile = "ExcelCustomProperties.xlsx"

# Create a Workbook object
workbook = Workbook()

# Load a sample Excel document
workbook.LoadFromFile(inputFile)

# Add a custom property to make the document as final
workbook.CustomDocumentProperties.Add("_MarkAsFinal", True)

# Add other custom properties to the document
workbook.CustomDocumentProperties.Add("The Editor", "E-iceblue")
workbook.CustomDocumentProperties.Add("Phone number", 81705109)
workbook.CustomDocumentProperties.Add("Revision number", 7.12)
workbook.CustomDocumentProperties.Add("Revision date", DateTime.get_Now())

# Save the result document
workbook.SaveToFile(outputFile, FileFormat.Version2016)
workbook.Dispose()
Apply for a Temporary License
If you'd like to remove the evaluation message from the generated documents, or to get rid of the function limitations, please request a 30-day trial license for yourself.
Grouping rows and columns in Excel provides a more organized and structured view of data, making it easier to analyze and understand complex datasets. After grouping related rows or columns, you can collapse or expand them as needed to focus on specific subsets of information while hiding details. In this article, you will learn how to group or ungroup rows and columns , as well as how to collapse or expand groups in Excel in Python using Spire.XLS for Python.
- Group Rows and Columns in Excel in Python
- Ungroup Rows and Columns in Excel in Python
- Expand or Collapse Groups in Excel in Python
Install Spire.XLS for Python
This scenario requires Spire.XLS for Python and plum-dispatch v1.7.4. They can be easily installed in your Windows through the following pip command.
pip install Spire.XLS
If you are unsure how to install, please refer to this tutorial: How to Install Spire.XLS for Python on Windows
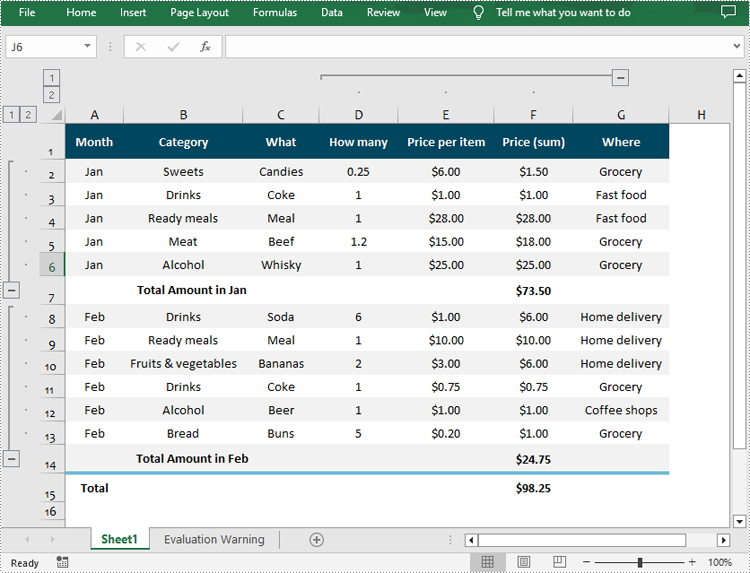
Group Rows and Columns in Excel in Python
Spire.XLS for Python provides the Worksheet.GroupByRows() and Worksheet.GroupByColumns() methods to group specific rows and columns in an Excel worksheet. The following are the detailed steps:
- Create a Workbook object.
- Load a sample Excel file using Workbook.LoadFromFile() method.
- Get the specified worksheet using Workbook.Worksheets[] property.
- Group rows using Worksheet.GroupByRows() method.
- Group columns using Worksheet.GroupByColumns() method.
- Save the result file using Workbook.SaveToFile() method.
- Python
from spire.xls import *
from spire.xls.common import *

inputFile = "Data.xlsx"
outputFile = "GroupRowsAndColumns.xlsx"

# Create a Workbook object
workbook = Workbook()

# Load a sample Excel file
workbook.LoadFromFile(inputFile)

# Get the first worksheet
sheet = workbook.Worksheets[0]

# Group rows
sheet.GroupByRows(2, 6, False)
sheet.GroupByRows(8, 13, False)

# Group columns
sheet.GroupByColumns(4, 6, False)

# Save the result file
workbook.SaveToFile(outputFile, ExcelVersion.Version2016)
workbook.Dispose()
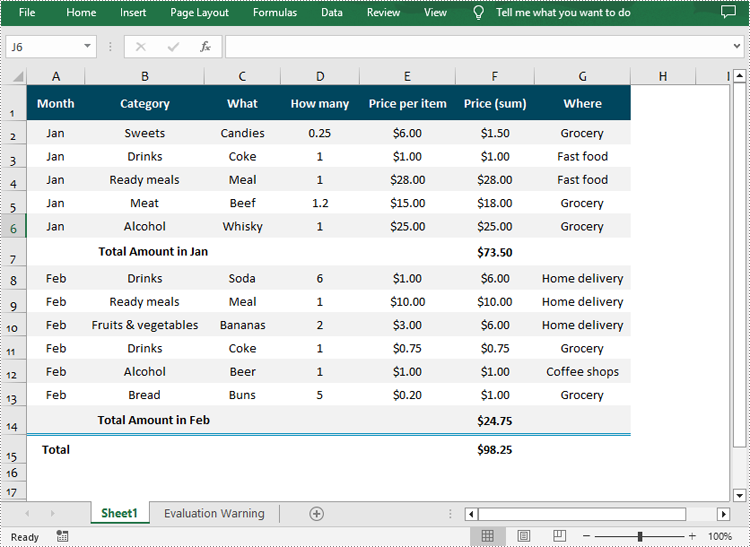
Ungroup Rows and Columns in Excel in Python
Ungrouping rows and columns in Excel refer to the process of reversing the grouping operation and restoring the individual rows or columns to their original state.
To ungroup rows and columns in an Excel worksheet, you can use the Worksheet.UngroupByRows() and Worksheet.UngroupByColumns() methods. The following are the detailed steps:
- Create a Workbook object.
- Load a sample Excel file using Workbook.LoadFromFile() method.
- Get the specified worksheet using Workbook.Worksheets[] property.
- Ungroup rows using Worksheet.UngroupByRows() method.
- Ungroup columns using Worksheet.UngroupByColumns() method.
- Save the result file using Workbook.SaveToFile() method.
- Python
from spire.xls import *
from spire.xls.common import *

inputFile = "GroupRowsAndColumns.xlsx"
outputFile = "UnGroupRowsAndColumns.xlsx"

# Create a Workbook object
workbook = Workbook()

# Load a sample Excel file
workbook.LoadFromFile(inputFile)

# Get the first worksheet
sheet = workbook.Worksheets[0]

# UnGroup rows
sheet.UngroupByRows(2, 6)
sheet.UngroupByRows(8, 13)

# UnGroup columns
sheet.UngroupByColumns(4, 6)

# Save the result file
workbook.SaveToFile(outputFile, ExcelVersion.Version2016)
workbook.Dispose()
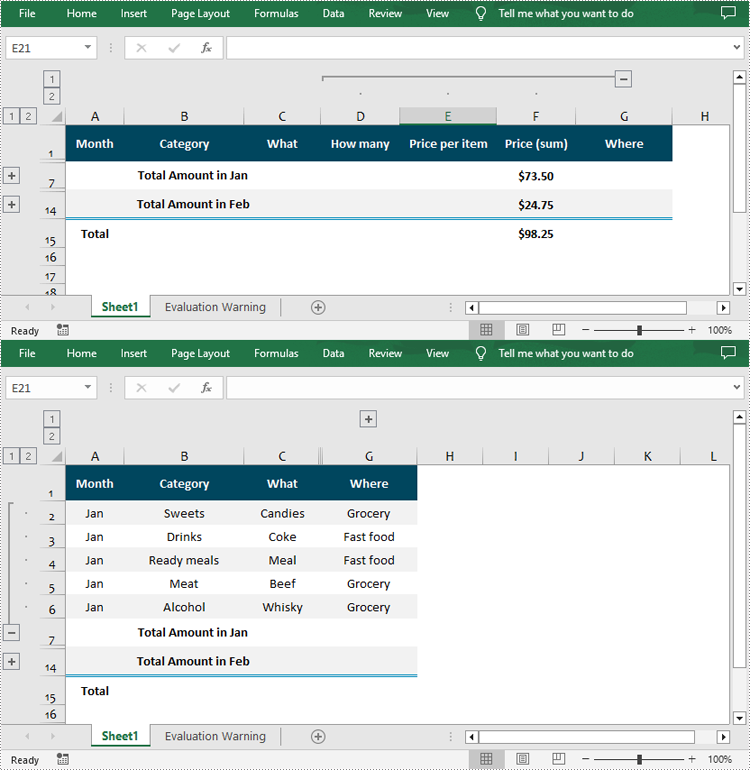
Expand or Collapse Groups in Excel in Python
Expanding or collapsing groups in Excel refers to the action of showing or hiding the detailed information within a grouped section. With Spire.XLS for Python, you can expand or collapse groups through the Worksheet.Range[].ExpandGroup() or Worksheet.Range[].CollapseGroup() methods. The following are the detailed steps:
- Create a Workbook object.
- Load a sample Excel file using Workbook.LoadFromFile() method.
- Get the specified worksheet using Workbook.Worksheets[] property.
- Expand a specific group using the Worksheet.Range[].ExpandGroup() method.
- Collapse a specific group using the Worksheet.Range[].CollapseGroup() method.
- Save the result file using Workbook.SaveToFile() method.
- Python
from spire.xls import *
from spire.xls.common import *

inputFile = "Grouped.xlsx"
outputFile = "ExpandOrCollapseGroups.xlsx"

# Create a Workbook object
workbook = Workbook()

# Load a sample Excel file
workbook.LoadFromFile(inputFile)

# Get the first worksheet
sheet = workbook.Worksheets[0]

# Expand a group
sheet.Range["A2:G6"].ExpandGroup(GroupByType.ByRows)

# Collapse a group
sheet.Range["D1:F15"].CollapseGroup(GroupByType.ByColumns)

# Save the result file
workbook.SaveToFile(outputFile, ExcelVersion.Version2016)
workbook.Dispose()
Apply for a Temporary License
If you'd like to remove the evaluation message from the generated documents, or to get rid of the function limitations, please request a 30-day trial license for yourself.
A page break is a markup that divides the content of a document or spreadsheet into multiple pages for printing or display. This feature can be used to adjust the page layout of a document to ensure that each page contains the appropriate information. By placing page breaks appropriately, you can also ensure that your document is presented in a better format and layout when printed. This article will explain how to insert or remove horizontal/vertical page breaks in Excel on the Python platform by using Spire.XLS for Python.
- Insert Horizontal Page Breaks in Excel Using Python
- Insert Vertical Page Breaks in Excel Using Python
- Remove Horizontal Page Breaks from Excel Using Python
- Remove Vertical Page Breaks from Excel Using Python
Install Spire.XLS for Python
This scenario requires Spire.XLS for Python and plum-dispatch v1.7.4. They can be easily installed in your Windows through the following pip commands.
pip install Spire.XLS
If you are unsure how to install, please refer to this tutorial: How to Install Spire.XLS for Python on Windows
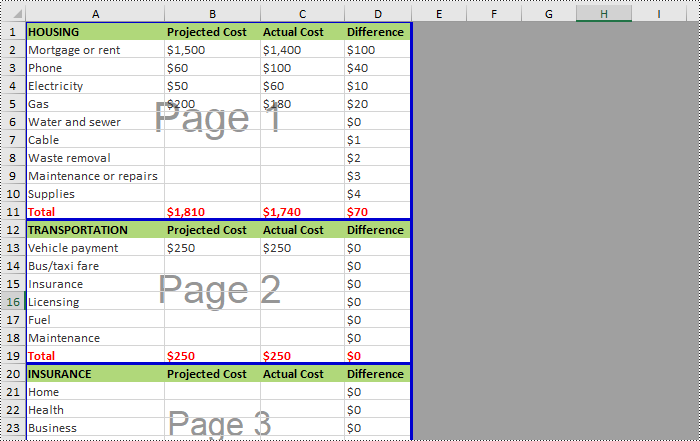
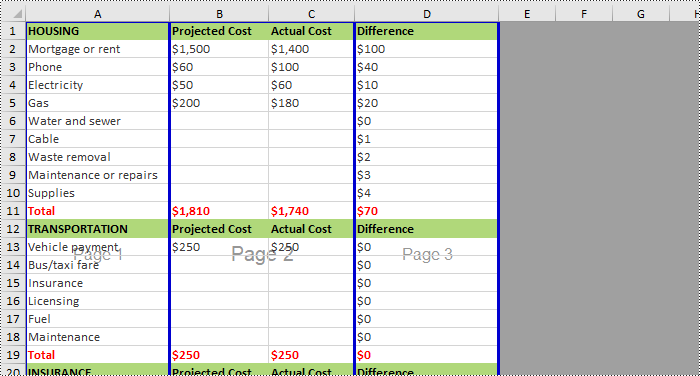
Insert Horizontal Page Breaks in Excel Using Python
Spire.XLS for Python supports inserting horizontal page breaks to specified cell ranges by calling Worksheet.HPageBreaks.Add(CellRange) method. The following are detailed steps.
- Create a Workbook instance.
- Load an Excel file from disk using Workbook.LoadFromFile() method.
- Get a specified worksheet using Workbook.Worksheets[] property.
- Insert horizontal page breaks to specified cell ranges using Worksheet.HPageBreaks.Add(CellRange) method.
- Set view mode to Preview mode by Worksheet.ViewMode property.
- Save the result file using Workbook.SaveToFile() method.
- Python
from spire.xls import *
from spire.xls.common import *

inputFile = "C:/Users/Administrator/Desktop/Sample.xlsx"
outputFile = "C:/Users/Administrator/Desktop/InsertHPageBreak.xlsx"

#Create a Workbook instance
workbook = Workbook()

#Load an Excel file from disk
workbook.LoadFromFile(inputFile)

#Get the first worksheet of this file
sheet = workbook.Worksheets[0]

#Insert horizontal page breaks to specified cell ranges
sheet.HPageBreaks.Add(sheet.Range["A12"])
sheet.HPageBreaks.Add(sheet.Range["A20"])

#Set view mode to Preview mode
sheet.ViewMode = ViewMode.Preview

#Save the result file
workbook.SaveToFile(outputFile, ExcelVersion.Version2013)
workbook.Dispose()
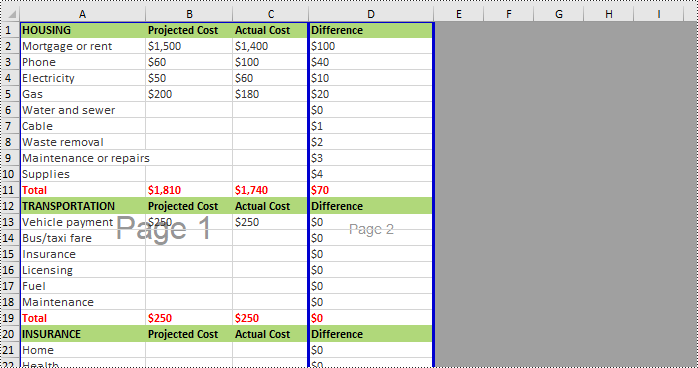
Insert Vertical Page Breaks in Excel Using Python
Spire.XLS for Python also supports inserting vertical page breaks to specified cell ranges by calling Worksheet.VPageBreaks.Add(CellRange) method. The following are detailed steps.
- Create a Workbook instance.
- Load an Excel file from disk using Workbook.LoadFromFile() method.
- Get a specified worksheet using Workbook.Worksheets[] property.
- Insert vertical page breaks to specified cell ranges using Worksheet.VPageBreaks.Add(CellRange) method.
- Set view mode to Preview mode using Worksheet.ViewMode property.
- Save the result file using Workbook.SaveToFile() method.
- Python
from spire.xls import *
from spire.xls.common import *

inputFile = "C:/Users/Administrator/Desktop/Sample.xlsx"
outputFile = "C:/Users/Administrator/Desktop/InsertVPageBreak.xlsx"

#Create a Workbook instance
workbook = Workbook()

#Load an Excel file from disk
workbook.LoadFromFile(inputFile)

#Get the first worksheet of this file
sheet = workbook.Worksheets[0]

#Insert vertical page breaks to specified cell ranges
sheet.VPageBreaks.Add(sheet.Range["B1"])
sheet.VPageBreaks.Add(sheet.Range["D3"])

#Set view mode to Preview mode
sheet.ViewMode = ViewMode.Preview

#Save the result file
workbook.SaveToFile(outputFile, ExcelVersion.Version2013)
workbook.Dispose()
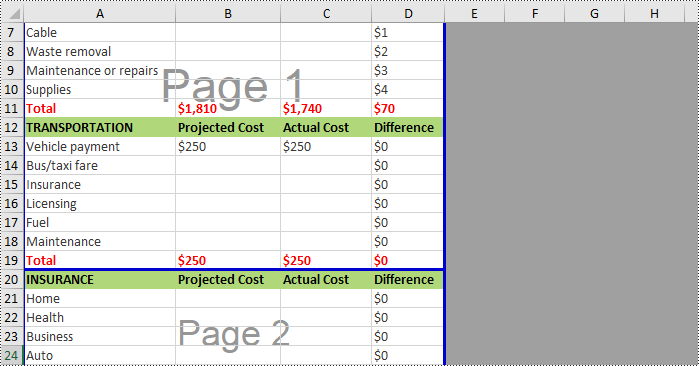
Remove Horizontal Page Breaks from Excel Using Python
If you want to remove horizontal page breaks from Excel, call the Worksheet.HPageBreaks.RemoveAt() or Worksheet.HPageBreaks.Clear() methods. The following are detailed steps.
- Create a Workbook instance.
- Load an Excel file from disk using Workbook.LoadFromFile() method.
- Get a specified worksheet using Workbook.Worksheets[] property.
- Remove all the horizontal page breaks by calling Worksheet.HPageBreaks.Clear() method or remove a specific horizontal page break by calling Worksheet.HPageBreaks.RemoveAt() method.
- Set view mode to Preview mode using Worksheet.ViewMode property.
- Save the result file using Workbook.SaveToFile() method.
- Python
from spire.xls import *
from spire.xls.common import *

inputFile = "C:/Users/Administrator/Desktop/InsertHPageBreak.xlsx"
outputFile = "C:/Users/Administrator/Desktop/RemoveHPageBreak.xlsx"

#Create a Workbook instance
workbook = Workbook()

#Load an Excel file from disk
workbook.LoadFromFile(inputFile)

#Get the first worksheet from this file
sheet = workbook.Worksheets[0]

#Clear all the horizontal page breaks
#sheet.HPageBreaks.Clear()

#Remove the first horizontal page break
sheet.HPageBreaks.RemoveAt(0)

#Set view mode to Preview mode
sheet.ViewMode = ViewMode.Preview

#Save the result file
workbook.SaveToFile(outputFile, ExcelVersion.Version2013)
workbook.Dispose()
Remove Vertical Page Breaks from Excel Using Python
If you want to remove vertical page breaks from Excel, call the Worksheet.VPageBreaks.RemoveAt() or Worksheet.VPageBreaks.Clear() methods. The following are detailed steps.
- Create a Workbook instance.
- Load an Excel file from disk using Workbook.LoadFromFile() method.
- Get a specified worksheet using Workbook.Worksheets[] property.
- Remove all the vertical page breaks by calling Worksheet.VPageBreaks.Clear() method or remove a specific vertical page break by calling Worksheet.VPageBreaks.RemoveAt() method.
- Set view mode to Preview mode using Worksheet.ViewMode property.
- Save the result file using Workbook.SaveToFile() method.
- Python
from spire.xls import *
from spire.xls.common import *

inputFile = "C:/Users/Administrator/Desktop/InsertVPageBreak.xlsx"
outputFile = "C:/Users/Administrator/Desktop/RemoveVPageBreak.xlsx"

#Create a Workbook instance
workbook = Workbook()

#Load an Excel file from disk
workbook.LoadFromFile(inputFile)

#Get the first worksheet from this file
sheet = workbook.Worksheets[0]

#Clear all the vertical page breaks
#sheet.VPageBreaks.Clear()

#Remove the first vertical page break
sheet.VPageBreaks.RemoveAt(0)

#Set view mode to Preview mode
sheet.ViewMode = ViewMode.Preview

#Save the result file
workbook.SaveToFile(outputFile, ExcelVersion.Version2013)
workbook.Dispose()
Apply for a Temporary License
If you'd like to remove the evaluation message from the generated documents, or to get rid of the function limitations, please request a 30-day trial license for yourself.
In the context of Excel, Open XML refers to the underlying file format used by Excel to store spreadsheet data, formatting, formulas, and other related information. It provides a powerful and flexible basis for working with Excel files programmatically.
By converting Excel to Open XML, developers gain greater control and automation when working with spreadsheet-related tasks. In turn, you can also generate Excel files from Open XML to take advantage of Excel's built-in capabilities to perform advanced data operations. In this article, you will learn how to convert Excel to Open XML or Open XML to Excel in Python using Spire.XLS for Python.
Install Spire.XLS for Python
This scenario requires Spire.XLS for Python and plum-dispatch v1.7.4. They can be easily installed in your Windows through the following pip command.
pip install Spire.XLS
If you are unsure how to install, please refer to this tutorial: How to Install Spire.XLS for Python on Windows
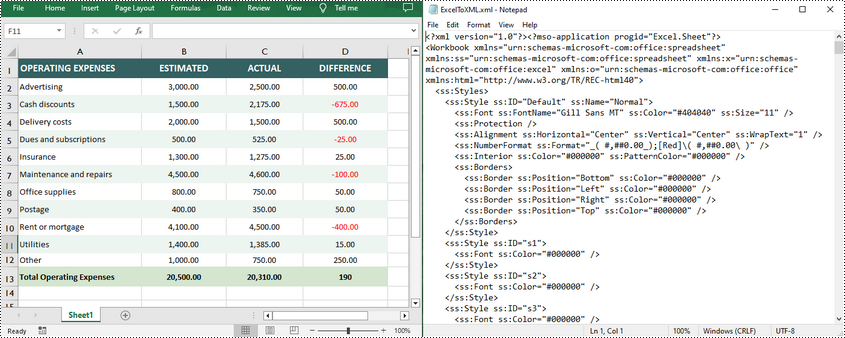
Convert Excel to Open XML in Python
Spire.XLS for Python offers the Workbook.SaveAsXml() method to save an Excel file in Open XML format. The following are the detailed steps.
- Create a Workbook object.
- Load an Excel file using Workbook.LoadFromFile() method.
- Save the Excel file in Open XML format using Workbook.SaveAsXml() method.
- Python
from spire.xls import *
from spire.xls.common import *
# Create a Workbook object
workbook = Workbook()
# Load an Excel file
workbook.LoadFromFile("sample.xlsx")
# Save the Excel file in Open XML file format
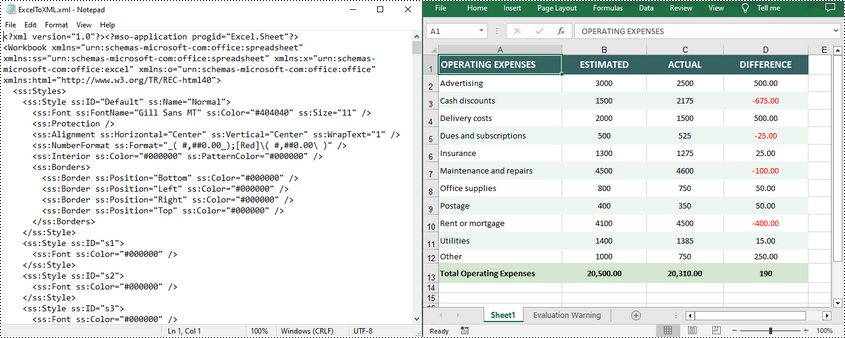
workbook.SaveAsXml("ExcelToXML.xml")
workbook.Dispose()
Convert Open XML to Excel in Python
To convert an Open XML file to Excel, you need to load the Open XML file through the Workbook.LoadFromXml() method, and then call the Workbook.SaveToFile() method to save it as an Excel file. The following are the detailed steps.
- Create a Workbook object.
- Load an Open XML file using Workbook.LoadFromXml() method.
- Save the Open XML file to Excel using Workbook.SaveToFile() method.
- Python
from spire.xls import *
from spire.xls.common import *

# Create a Workbook object
workbook = Workbook()

# Load an Open XML file
workbook.LoadFromXml("ExcelToXML.xml")

# Save the Open XML file to Excel XLSX format
workbook.SaveToFile("XMLToExcel.xlsx", ExcelVersion.Version2016)
workbook.Dispose()
Apply for a Temporary License
If you'd like to remove the evaluation message from the generated documents, or to get rid of the function limitations, please request a 30-day trial license for yourself.
Comment in Excel is primarily used to add additional instructions or notes to cells. With this feature, users can add relevant content next to a specific cell to explain the data, provide contextual information, or give instructions. It also helps users to better organize and manage the data in the Excel workbook and improve the understanding and readability of the data. Spire.XLS for Python supports adding comments to Excel files. If necessary, you can also use this library to edit the content of the comments or delete unnecessary comments. In this article, we will show you how to edit or remove existing comments in Excel on Python platforms using Spire.XLS for Python.
Install Spire.XLS for Python
This scenario requires Spire.XLS for Python and plum-dispatch v1.7.4. They can be easily installed in your Windows through the following pip commands.
pip install Spire.XLS
If you are unsure how to install, please refer to this tutorial: How to Install Spire.XLS for Python on Windows
Edit Existing Comments in Excel Using Python
Spire.XLS for Python allows users to edit existing comments in Excel, including setting new text or changing comment box size. The following are detailed steps.
- Create a Workbook instance.
- Load an Excel file from disk using Workbook.LoadFromFile() method.
- Get the first worksheet of the Excel file using Workbook.Worksheets[] property.
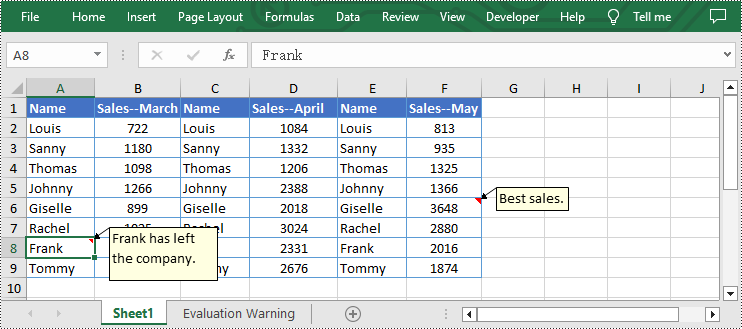
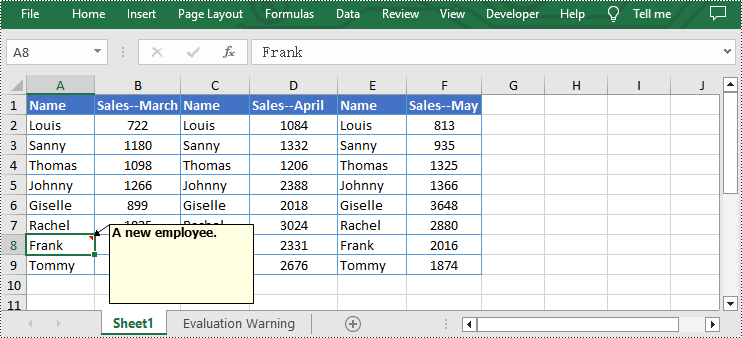
- Set new text for the existing comments using Worksheet.Range[].Comment.Text property.
- Set the height and width of the existing comment by using Worksheet.Range[].Comment.Height and Worksheet.Range[].Comment.Width properties.
- Automatically adapt to the size of the comment by setting the Worksheet.Range.Comment.AutoSize property to "True".
- Save the result file using Workbook.SaveToFile() method.
- Python
from spire.xls import *
from spire.xls.common import *

inputFile = "C:/Users/Administrator/Desktop/Sample.xlsx"
outputFile = "C:/Users/Administrator/Desktop/EditExcelComment.xlsx"

# Create a Workbook instance
workbook = Workbook()

# Load an Excel file from disk
workbook.LoadFromFile(inputFile)

# Get the first worksheet of this file
sheet = workbook.Worksheets[0]

# Set new text for the existing comments
sheet.Range["A8"].Comment.Text = "Frank has left the company."
sheet.Range["F6"].Comment.Text = "Best sales."

# Set the height and width of the comment of A8
sheet.Range["A8"].Comment.Height = 60
sheet.Range["A8"].Comment.Width = 100

# Automatically adapt to the size of the comment of F6
sheet.Range["F6"].Comment.AutoSize = True

# Save the result file
workbook.SaveToFile(outputFile, ExcelVersion.Version2013)
workbook.Dispose()
Remove Existing Comments from Excel Using Python
The Worksheet.Range[].Comment.Remove() method offered by Spire.XLS for Python allows users to remove a specified comment easily. The detailed steps are as follows.
- Create a Workbook instance.
- Load an Excel file from disk using Workbook.LoadFromFile() method.
- Get the first worksheet of the Excel file using Workbook.Worksheets[] property.
- Remove the comment by using Worksheet.Range[].Comment.Remove() method.
- Save the document to another file using Workbook.SaveToFile() method.
- Python
from spire.xls import *
from spire.xls.common import *

inputFile = "C:/Users/Administrator/Desktop/Sample.xlsx"
outputFile = "C:/Users/Administrator/Desktop/RemoveExcelComment.xlsx"

# Create a Workbook instance
workbook = Workbook()

# Load an Excel file from disk
workbook.LoadFromFile(inputFile)

# Get the first worksheet of this file
sheet = workbook.Worksheets[0]

# Remove the comment from the sheet
sheet.Range["F6"].Comment.Remove()

# Save the result file
workbook.SaveToFile(outputFile, ExcelVersion.Version2013)
workbook.Dispose()
Apply for a Temporary License
If you'd like to remove the evaluation message from the generated documents, or to get rid of the function limitations, please request a 30-day trial license for yourself.
A bar chart is a type of graph that represents categorical data using rectangular bars. It is somewhat like a column chart, but with bars that extend horizontally from the Y-axis. The length of each bar corresponds to the value represented by a particular category or group, and changes, trends, or rankings can be quickly identified by comparing the lengths of the bars. In this article, you will learn how to create a clustered or stacked bar chart in Excel in Python using Spire.XLS for Python.
Install Spire.XLS for Python
This scenario requires Spire.XLS for Python and plum-dispatch v1.7.4. They can be easily installed in your Windows through the following pip command.
pip install Spire.XLS
If you are unsure how to install, please refer to this tutorial: How to Install Spire.XLS for Python on Windows
Create a Clustered Bar Chart in Excel in Python
The Worksheet.Chart.Add(ExcelChartType chartType) method provided by Spire.XLS for Python allows to add a chart to a worksheet. To add a clustered bar chart in Excel, you can set the chart type to BarClustered. The following are the steps.
- Create a Workbook object.
- Get a specific worksheet using Workbook.Worksheets[index] property.
- Add chart data to specified cells and set the cell styles.
- Add a clustered bar char to the worksheet using Worksheet.Chart.Add(ExcelChartType.BarClustered) method.
- Set data range for the chart using Chart.DataRange property.
- Set position, title, category axis and value axis for the chart.
- Save the result file using Workbook.SaveToFile() method.
- Python
from spire.xls import *
# Create a Workbook instance
workbook = Workbook()
# Get the first sheet and set its name
sheet = workbook.Worksheets[0]
sheet.Name = "ClusteredBar"
# Add chart data to specified cells
sheet.Range["A1"].Value = "Quarter"
sheet.Range["A2"].Value = "Q1"
sheet.Range["A3"].Value = "Q2"
sheet.Range["A4"].Value = "Q3"
sheet.Range["A5"].Value = "Q4"
sheet.Range["B1"].Value = "Team A"
sheet.Range["B2"].NumberValue = 3000
sheet.Range["B3"].NumberValue = 8000
sheet.Range["B4"].NumberValue = 9000
sheet.Range["B5"].NumberValue = 8500
sheet.Range["C1"].Value = "Team B"
sheet.Range["C2"].NumberValue = 7000
sheet.Range["C3"].NumberValue = 2000
sheet.Range["C4"].NumberValue = 5000
sheet.Range["C5"].NumberValue = 4200
# Set cell style
sheet.Range["A1:C1"].RowHeight = 18
sheet.Range["A1:C1"].Style.Color = Color.get_Black()
sheet.Range["A1:C1"].Style.Font.Color = Color.get_White()
sheet.Range["A1:C1"].Style.Font.IsBold = True
sheet.Range["A1:C1"].Style.VerticalAlignment = VerticalAlignType.Center
sheet.Range["A1:C1"].Style.HorizontalAlignment = HorizontalAlignType.Center
sheet.Range["A2:A5"].Style.HorizontalAlignment = HorizontalAlignType.Center
sheet.Range["B2:C5"].Style.NumberFormat = "\"$\"#,##0"
# Add a clustered bar chart to the sheet
chart = sheet.Charts.Add(ExcelChartType.BarClustered)
# Set data range of the chart
chart.DataRange = sheet.Range["A1:C5"]
chart.SeriesDataFromRange = False
# Set position of the chart
chart.LeftColumn = 1
chart.TopRow = 6
chart.RightColumn = 11
chart.BottomRow = 29
# Set and format chart title
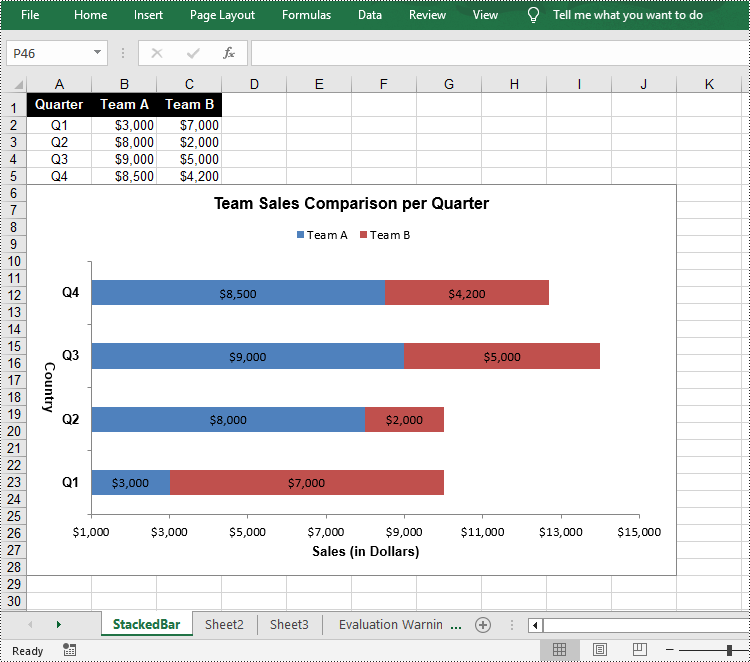
chart.ChartTitle = "Team Sales Comparison per Quarter"
chart.ChartTitleArea.IsBold = True
chart.ChartTitleArea.Size = 12
# Set and format category axis
chart.PrimaryCategoryAxis.Title = "Country"
chart.PrimaryCategoryAxis.Font.IsBold = True
chart.PrimaryCategoryAxis.TitleArea.IsBold = True
chart.PrimaryCategoryAxis.TitleArea.TextRotationAngle = 90
# Set and format value axis
chart.PrimaryValueAxis.Title = "Sales (in Dollars)"
chart.PrimaryValueAxis.HasMajorGridLines = False
chart.PrimaryValueAxis.MinValue = 1000
chart.PrimaryValueAxis.TitleArea.IsBold = True
# Show data labels for data points
for cs in chart.Series:
cs.Format.Options.IsVaryColor = True
cs.DataPoints.DefaultDataPoint.DataLabels.HasValue = True
# Set legend position
chart.Legend.Position = LegendPositionType.Top
#Save the result file
workbook.SaveToFile("ClusteredBarChart.xlsx", ExcelVersion.Version2016)
workbook.Dispose()

Create a Stacked Bar Chart in Excel in Python
To create a stacked bar chart, you just need to change the Excel chart type to BarStacked. The following are the steps.
- Create a Workbook object.
- Get a specific worksheet using Workbook.Worksheets[index] property.
- Add chart data to specified cells and set the cell styles.
- Add a clustered bar char to the worksheet using Worksheet.Chart.Add(ExcelChartType.BarStacked) method.
- Set data range for the chart using Chart.DataRange property.
- Set position, title, category axis and value axis for the chart.
- Save the result file using Workbook.SaveToFile() method.
- Python
from spire.xls import *

# Create a Workbook instance
workbook = Workbook()

# Get the first sheet and set its name
sheet = workbook.Worksheets[0]
sheet.Name = "StackedBar"

# Add chart data to specified cells
sheet.Range["A1"].Value = "Quarter"
sheet.Range["A2"].Value = "Q1"
sheet.Range["A3"].Value = "Q2"
sheet.Range["A4"].Value = "Q3"
sheet.Range["A5"].Value = "Q4"
sheet.Range["B1"].Value = "Team A"
sheet.Range["B2"].NumberValue = 3000
sheet.Range["B3"].NumberValue = 8000
sheet.Range["B4"].NumberValue = 9000
sheet.Range["B5"].NumberValue = 8500
sheet.Range["C1"].Value = "Team B"
sheet.Range["C2"].NumberValue = 7000
sheet.Range["C3"].NumberValue = 2000
sheet.Range["C4"].NumberValue = 5000
sheet.Range["C5"].NumberValue = 4200

# Set cell style
sheet.Range["A1:C1"].RowHeight = 18
sheet.Range["A1:C1"].Style.Color = Color.get_Black()
sheet.Range["A1:C1"].Style.Font.Color = Color.get_White()
sheet.Range["A1:C1"].Style.Font.IsBold = True
sheet.Range["A1:C1"].Style.VerticalAlignment = VerticalAlignType.Center
sheet.Range["A1:C1"].Style.HorizontalAlignment = HorizontalAlignType.Center
sheet.Range["A2:A5"].Style.HorizontalAlignment = HorizontalAlignType.Center
sheet.Range["B2:C5"].Style.NumberFormat = "\"$\"#,##0"

# Add a clustered bar chart to the sheet
chart = sheet.Charts.Add(ExcelChartType.BarStacked)

# Set data range of the chart
chart.DataRange = sheet.Range["A1:C5"]
chart.SeriesDataFromRange = False

# Set position of the chart
chart.LeftColumn = 1
chart.TopRow = 6
chart.RightColumn = 11
chart.BottomRow = 29

# Set and format chart title
chart.ChartTitle = "Team Sales Comparison per Quarter"
chart.ChartTitleArea.IsBold = True
chart.ChartTitleArea.Size = 12

# Set and format category axis
chart.PrimaryCategoryAxis.Title = "Country"
chart.PrimaryCategoryAxis.Font.IsBold = True
chart.PrimaryCategoryAxis.TitleArea.IsBold = True
chart.PrimaryCategoryAxis.TitleArea.TextRotationAngle = 90

# Set and format value axis
chart.PrimaryValueAxis.Title = "Sales (in Dollars)"
chart.PrimaryValueAxis.HasMajorGridLines = False
chart.PrimaryValueAxis.MinValue = 1000
chart.PrimaryValueAxis.TitleArea.IsBold = True

# Show data labels for data points
for cs in chart.Series:
    cs.Format.Options.IsVaryColor = True
    cs.DataPoints.DefaultDataPoint.DataLabels.HasValue = True

# Set legend position
chart.Legend.Position = LegendPositionType.Top

#Save the result file
workbook.SaveToFile("StackedBarChart.xlsx", ExcelVersion.Version2016)
workbook.Dispose()
Apply for a Temporary License
If you'd like to remove the evaluation message from the generated documents, or to get rid of the function limitations, please request a 30-day trial license for yourself.
Locking cells is often used to protect the contents of specific cell ranges in a spreadsheet from accidental modification, which is useful in situations such as sharing a worksheet or protecting specific data. When you lock a cell, no one else can edit it unless they know the password or have the appropriate permissions. This feature is important for data security and integrity. In this article, we will show you how to lock specific cells, columns or rows in Excel on python platforms by using Spire.XLS for Python.
Install Spire.XLS for Python
This scenario requires Spire.XLS for Python and plum-dispatch v1.7.4. They can be easily installed in your Windows through the following pip commands.
pip install Spire.XLS
If you are unsure how to install, please refer to this tutorial: How to Install Spire.XLS for Python on Windows
Lock Specific Cells in Python
Spire.XLS for Python supports users to lock a specified range of cells by setting the Worksheet.Range[].Style.Locked property to "True". Below are the detailed steps.
- Create a Workbook instance and load a sample excel file using Workbook.LoadFromFile() method.
- Get the first worksheet using Workbook.Worksheets[] property.
- Unlock all cells in the used range of the worksheet by setting the Worksheet.Range.Style.Locked property to "False".
- Set text for the specific cells using Worksheet.Range[].Text property and then lock them by setting the Worksheet.Range[].Style.Locked property to "True".
- Protect the worksheet using XlsWorksheetBase.Protect() method.
- Save the result file using Workbook.SaveToFile() method.
- Python
from spire.xls import *
from spire.xls.common import *
inputFile = "C:/Users/Administrator/Desktop/Sample.xlsx"
outputFile = "C:/Users/Administrator/Desktop/LockSpecificCells.xlsx"
# Create a Workbook instance and load a sample file
workbook = Workbook()
workbook.LoadFromFile(inputFile)
# Get the first worksheet
sheet = workbook.Worksheets[0]
# Unlock all cells in the used range of the worksheet
sheet.Range.Style.Locked = False
# Lock a specific cell in the sheet
sheet.Range["A1"].Text = "Locked"
sheet.Range["A1"].Style.Locked = True
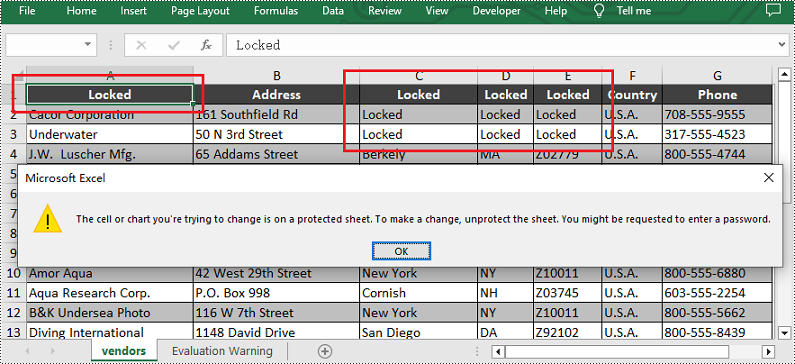
# Lock a specific range of cells in the sheet
sheet.Range["C1:E3"].Text = "Locked"
sheet.Range["C1:E3"].Style.Locked = True
# Protect the worksheet with a password
sheet.Protect("123456", SheetProtectionType.All)
# Save the result file
workbook.SaveToFile(outputFile, ExcelVersion.Version2013)
workbook.Dispose()
Lock a Specific Column in Python
If you want to lock a specific column in the worksheet, please set the Worksheet.Columns[].Style.Locked property to "True". Other steps are similar to the above method. Below are the detailed steps.
- Create a Workbook instance and load a sample excel file using Workbook.LoadFromFile() method.
- Get the first worksheet using Workbook.Worksheets[] property.
- Unlock all cells in the used range of the worksheet by setting the Worksheet.Range.Style.Locked property to "False".
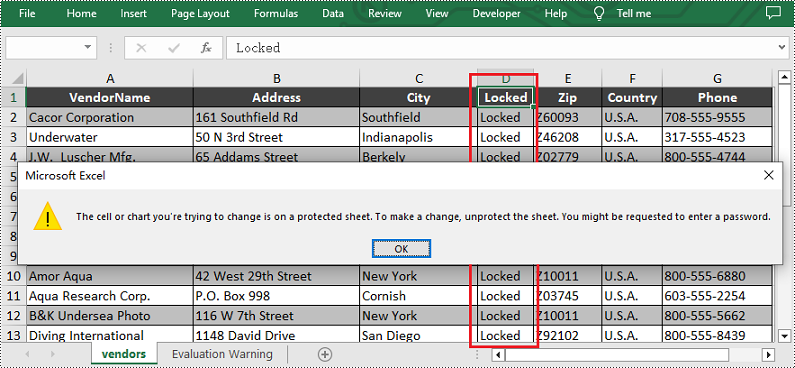
- Set text for the fourth column using the Worksheet.Columns[].Text property and then lock it by setting the Worksheet.Columns[].Style.Locked property to "True".
- Protect the worksheet with a password by calling XlsWorksheetBase.Protect() method.
- Save the result file using Workbook.SaveToFile() method.
- Python
from spire.xls import *
from spire.xls.common import *

inputFile = "C:/Users/Administrator/Desktop/Sample.xlsx"
outputFile = "C:/Users/Administrator/Desktop/LockSpecificColumn.xlsx"

# Create a Workbook instance and load a sample file
workbook = Workbook()
workbook.LoadFromFile(inputFile)

# Get the first worksheet
sheet = workbook.Worksheets[0]

# Unlock all cells in the used range of the worksheet
sheet.Range.Style.Locked = False

# Lock the fourth column in the sheet
sheet.Columns[3].Text = "Locked"
sheet.Columns[3].Style.Locked = True

# Protect the worksheet with a password
sheet.Protect("123456", SheetProtectionType.All)

# Save the result file
workbook.SaveToFile(outputFile, ExcelVersion.Version2013)
workbook.Dispose()
Lock a Specific Row in Python
Similarly, if you want to lock a certain row, please set the Worksheet.Rows[].Style.Locked property to "True". Here are the detailed steps.
- Create a Workbook instance and load a sample excel file using Workbook.LoadFromFile() method.
- Get the first worksheet using Workbook.Worksheets[] property.
- Unlock all cells in the used range of the worksheet by setting the Worksheet.Range.Style.Locked property to "False".
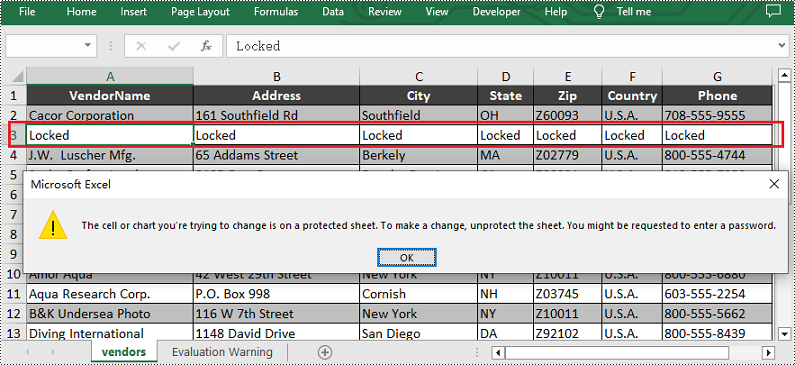
- Set text for the third row using the Worksheet.Rows[].Text property and then lock it by setting the Worksheet.Rows[].Style.Locked property to "True".
- Protect the worksheet with a password using XlsWorksheetBase.Protect() method.
- Save the result file using Workbook.SaveToFile() method.
- Python
from spire.xls import *
from spire.xls.common import *

inputFile = "C:/Users/Administrator/Desktop/Sample.xlsx"
outputFile = "C:/Users/Administrator/Desktop/LockSpecificRow.xlsx"

# Create a Workbook instance and load a sample file
workbook = Workbook()
workbook.LoadFromFile(inputFile)

# Get the first worksheet
sheet = workbook.Worksheets[0]

# Unlock all cells in the used range of the worksheet
sheet.Range.Style.Locked = False

# Lock the third row in the worksheet
sheet.Rows[2].Text = "Locked"
sheet.Rows[2].Style.Locked = True

# Protect the worksheet with a password
sheet.Protect("123456", SheetProtectionType.All)

# Save the result file
workbook.SaveToFile(outputFile, ExcelVersion.Version2013)
workbook.Dispose()
Apply for a Temporary License
If you'd like to remove the evaluation message from the generated documents, or to get rid of the function limitations, please request a 30-day trial license for yourself.
OLE enables users to incorporate diverse file types-such as images, charts, documents, and multimedia-directly into Excel workbooks, fostering a more dynamic and comprehensive representation of information. By inserting OLE objects, users can create interactive and engaging spreadsheets that integrate a variety of data formats to simplify analyses and presentations in a single Excel environment. In this article, you will learn how to insert linked or embedded OLE objects to Excel in Python as well as how to extract OLE objects from Excel in Python using Spire.XLS for Python.
- Insert a Linked OLE Object to Excel in Python
- Insert an Embedded Object to Excel in Python
- Extract OLE Objects from Excel in Python
Install Spire.XLS for Python
This scenario requires Spire.XLS for Python and plum-dispatch v1.7.4. They can be easily installed in your Windows through the following pip command.
pip install Spire.XLS
If you are unsure how to install, please refer to this tutorial: How to Install Spire.XLS for Python on Windows
Insert a Linked OLE Object to Excel in Python
To insert an OLE object to a worksheet, you use the Worksheet.OleObjects.Add(fileName, image, linkType) method, in which:
- the fileName parameter specifies the path of an external file to be inserted,
- the image parameter specifies a thumbnail of the first page or a document icon that the OLE object will be displayed as,
- the linkType parameter determines whether the OLE object is inserted to the document as an embedded source or a linked source.
The following are the steps to insert a linked OEL object to Excel using Spire.XLS for Python.
- Create a Workbook object.
- Get the first worksheet through Workbook.Worksheet[index] property.
- Load an image using Image.FromFile() method.
- Insert an OLE object to the worksheet using Worksheet.OleObjects.Add() method, and specify the link type as OleLinkType.Link.
- Specify the OLE object location through IOleObject.Location property.
- Specify the OLE object type through IOleObject.ObjectType property.
- Save the workbook to an Excel file using Workbook.SaveToFile() method.
- Python
from spire.xls import *
from spire.xls.common import *
# Create a Workbook object
workbook = Workbook()
# Get the first worksheet
sheet = workbook.Worksheets[0]
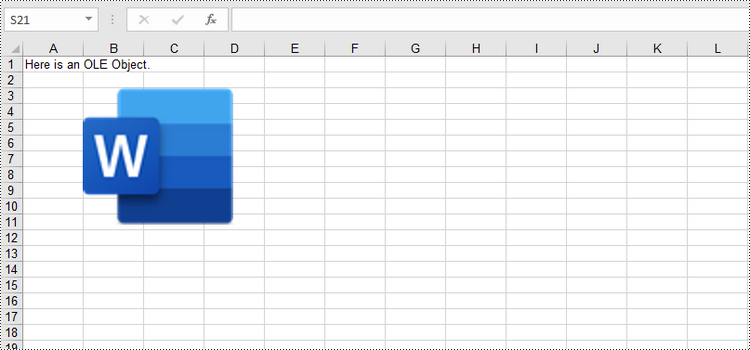
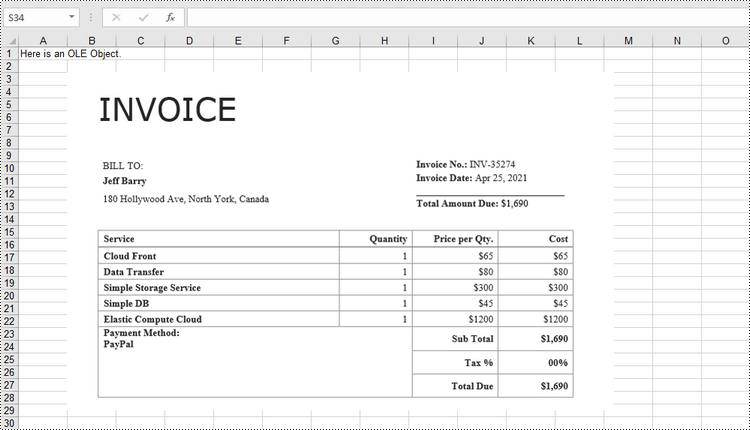
# Add text to A1
sheet.Range["A1"].Text = "Here is an OLE Object."
# Load an image to be displayed as an icon of ole object
image = Image.FromFile("C:/Users/Administrator/Desktop/word_icon.png")
with Stream() as stream:
image.Save(stream,ImageFormat.get_Png())
# Add an ole object to the worksheet that links to an external file
oleObject = sheet.OleObjects.Add("C:/Users/Administrator/Desktop/invoice.docx", stream, OleLinkType.Link)
# Specify ole object location
oleObject.Location = sheet.Range["B3"]
# Specify ole object type
oleObject.ObjectType = OleObjectType.WordDocument
# Save to file
workbook.SaveToFile("output/OleObject.xlsx", ExcelVersion.Version2016)
workbook.Dispose()
Insert an Embedded OLE Object to Excel in Python
To insert an embedded OEL object to Excel, you specify the link type as OleLinkType.Embed while invoking the Worksheet.OleObjects.Add() method. The detailed steps are as follows.
- Create a Workbook object.
- Get the first worksheet through Workbook.Worksheet[index] property.
- Load an image using Image.FromFile() method.
- Insert an OLE object to the worksheet using Worksheet.OleObjects.Add() method, and specify the link type as OleLinkType.Embed.
- Specify the OLE object location through IOleObject.Location property.
- Specify the OLE object type through IOleObject.ObjectType property.
- Save the workbook to an Excel file using Workbook.SaveToFile() method.
- Python
from spire.xls import *
from spire.xls.common import *

# Create a Workbook object
workbook = Workbook()

# Get the first worksheet
sheet = workbook.Worksheets[0]

# Add text to A1
sheet.Range["A1"].Text = "Here is an OLE Object."

# Load an image that represents ole object
image = Image.FromFile("C:/Users/Administrator/Desktop/screenshot.png")
with Stream() as stream:
    image.Save(stream,ImageFormat.get_Png())

    # Add an ole object to the worksheet as embedded source
    oleObject = sheet.OleObjects.Add("C:/Users/Administrator/Desktop/invoice.docx", stream, OleLinkType.Embed)

# Specify ole object location
oleObject.Location = sheet.Range["B3"]

# Specify ole object type
oleObject.ObjectType = OleObjectType.WordDocument

# Save to file
workbook.SaveToFile("output/OleObject.xlsx", ExcelVersion.Version2016)
workbook.Dispose()
Extract OLE Objects from Excel in Python
Spire.XLS for Python provides the Worksheet.HasOleObjects property to determine whether a worksheet has OLE objects. If it does, get all the objects through the Worksheet.OleObjects property. Then, determine the type of a particular OEL object and save the OEL as a file of the appropriate document type. The following are the steps to extract OLE objects from Excel using Spire.XLS for Python.
- Create a Workbook object.
- Get a specific worksheet through Workbook.Worksheet[index] property.
- Determine if the worksheet contains OLE objects through Worksheet.HasOleObjects property.
- Get all the OLE objects from the worksheet through Worksheet.OleObjects property.
- Determine the type of a particular OEL object and save the OEL as a file of the appropriate document type.
- Python
from spire.xls import *
from spire.xls.common import *
# Write data to file
def WriteAllBytes(fname:str,data):
fp = open(fname,"wb")
for d in data:
fp.write(d)
fp.close()
# Create a Workbook object
workbook = Workbook()
# Load an Excel document
workbook.LoadFromFile("C:\\Users\\Administrator\\Desktop\\OleObjects.xlsx")
# Get the first worksheet
sheet = workbook.Worksheets[0]
# Determine if the worksheet has ole objects
if sheet.HasOleObjects:
# Iterate through the found objects
for obj in sheet.OleObjects:
# If the object type is a Word document, save it to a .docx file
type = obj.ObjectType
if type is OleObjectType.WordDocument:
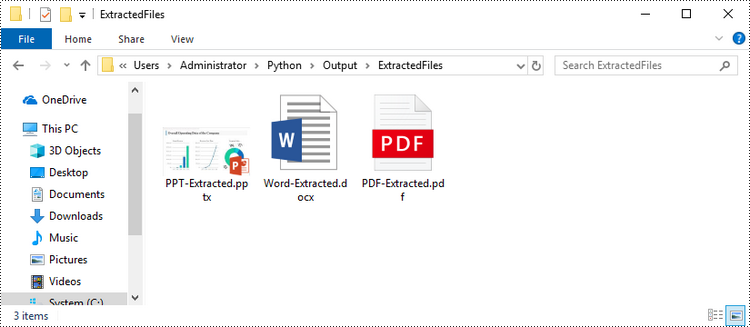
WriteAllBytes("output/ExtractedFiles/Word-Extracted.docx", obj.OleData)
# If the object type is an Adobe Acrobat document, save it to a .pdf file
if type is OleObjectType.AdobeAcrobatDocument:
WriteAllBytes("output/ExtractedFiles/PDF-Extracted.pdf", obj.OleData)
# If the object type is a PowerPoint document, save it to a .pptx file
if type is OleObjectType.PowerPointPresentation:
WriteAllBytes("output/ExtractedFiles/PPT-Extracted.pptx", obj.OleData)
workbook.Dispose()
Apply for a Temporary License
If you'd like to remove the evaluation message from the generated documents, or to get rid of the function limitations, please request a 30-day trial license for yourself.
The Find and Replace feature in Excel allows you to quickly find specific values and perform targeted replacements based on specific requirements. With it, all occurrences of a specific value can be updated at once, which can significantly improve productivity when working with large data sets. In this article, you will learn how to programmatically find and replace data in Excel in Python using Spire.XLS for Python.
- Find and Replace Data in a Worksheet in Excel
- Find and Replace Data in a Specific Cell Range in Excel
Install Spire.XLS for Python
This scenario requires Spire.XLS for Python and plum-dispatch v1.7.4. They can be easily installed in your Windows through the following pip command.
pip install Spire.XLS
If you are unsure how to install, please refer to this tutorial: How to Install Spire.XLS for Python on Windows
Find and Replace Data in an Excel Worksheet in Python
Spire.XLS for Python offers the Worksheet.FindAllString() method to find the cells containing specific data values in an Excel worksheet. Once the cells are found, you can use the CellRange.Text property to update their values with new values. The detailed steps are as follows:
- Create a Workbook object.
- Load an Excel file using Workbook.LoadFromFile() method.
- Get a specific worksheet using Workbook.Worksheets[] property.
- Find the cells containing a specific value in the worksheet using Worksheet.FindAllString() method.
- Iterate through the found cells.
- Replace the value of each found cell with another value using CellRange.Text property.
- Set a background color to highlight the cell using CellRange.Style.Color property.
- Save the result file using Workbook.SaveToFile() method.
- Python
from spire.xls import *
from spire.xls.common import *
# Create a Workbook object
workbook = Workbook()
# Load an Excel document from disk
workbook.LoadFromFile("input.xlsx")
# Get the first worksheet
worksheet = workbook.Worksheets[0]
# Find the cells with the specific string value “Total” in the worksheet
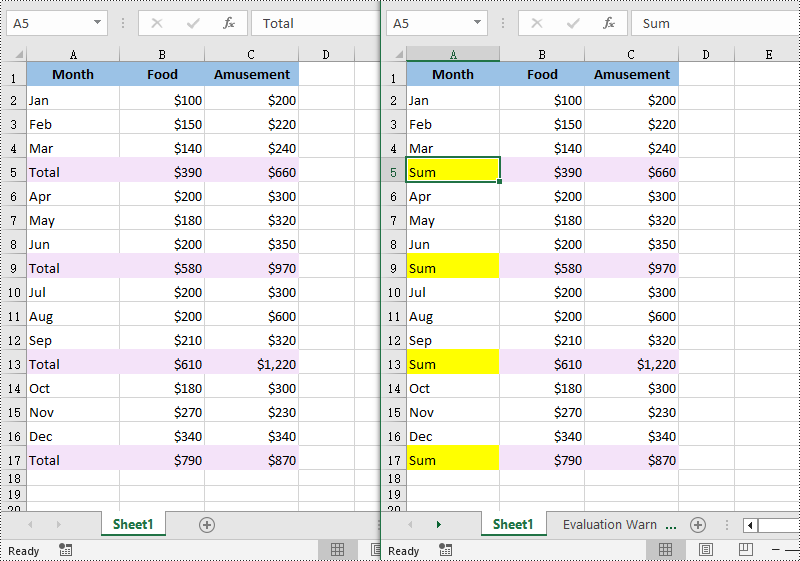
ranges = worksheet.FindAllString("Total", False, False)
# Iterate through the found cells
for range in ranges:
# Replace the value of the cell with another value
range.Text = "Sum"
# Set a background color for the cell
range.Style.Color = Color.get_Yellow()
# Save the result file
workbook.SaveToFile("FindAndReplaceData.xlsx", ExcelVersion.Version2016)
workbook.Dispose()
Find and Replace Data in a Specific Cell Range in Excel in Python
Spire.XLS for Python also allows you to find the cells containing a specific value in a cell range through the CellRange.FindAllString() method. Then you can update the value of each found cell with another value using the CellRange.Text property. The detailed steps are as follows:
- Create a Workbook object.
- Load an Excel file using Workbook.LoadFromFile() method.
- Get a specific worksheet using Workbook.Worksheets[] property.
- Get a specific cell range of the worksheet using Worksheet.Range[] property.
- Find the cells with a specific value in the cell range using CellRange.FindAllString() method.
- Iterate through the found cells.
- Replace the value of each found cell with another value using CellRange.Text property.
- Set a background color to highlight the cell using CellRange.Style.Color property.
- Save the result file using Workbook.SaveToFile() method.
- Python
from spire.xls import *
from spire.xls.common import *
# Create a Workbook object
workbook = Workbook()
# Load an Excel document from disk
workbook.LoadFromFile("input.xlsx")
# Get the first worksheet
sheet = workbook.Worksheets[0]
# Get a specific cell range
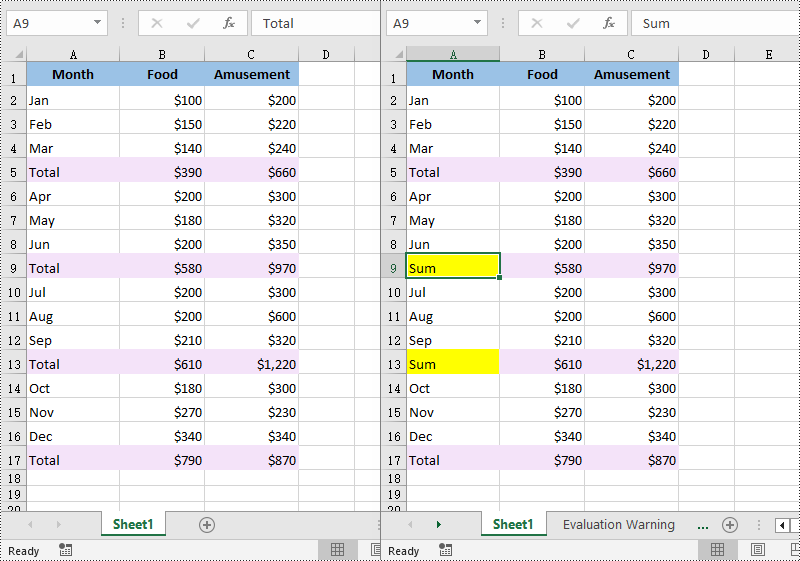
range = sheet.Range["A6:C13"]
# Find the cells with the specific value "Total" in the cell range
cells = range.FindAllString("Total", False, False)
# Iterate through the found cells
for cell in cells:
# Replace the value of the cell with another value
cell.Text = "Sum"
# Set a background color for the cell
cell.Style.Color = Color.get_Yellow()
# Save the result file
workbook.SaveToFile("ReplaceDataInCellRange.xlsx", ExcelVersion.Version2016)
workbook.Dispose()
Apply for a Temporary License
If you'd like to remove the evaluation message from the generated documents, or to get rid of the function limitations, please request a 30-day trial license for yourself.
