When organizing data such as sales records or statistical reports, converting a plain data range into an Excel table (Table / ListObject) gives the data a dedicated header row, automatic filter drop-downs, banded styling, and a "total row", which makes later browsing and summarizing more convenient. After the table is created, its appearance can also be adjusted at any time through built-in styles and various display options. Spire.XLS for JavaScript completes all of these operations directly in the browser based on WebAssembly, and manages input/output files through a virtual file system (VFS), with no backend service required.
This article covers two core features:
For installation and project configuration, refer to Integrating Spire.XLS for JavaScript in a React Project. The examples below assume Spire.XLS is installed and the WebAssembly module is initialized.
Create a Table in Excel
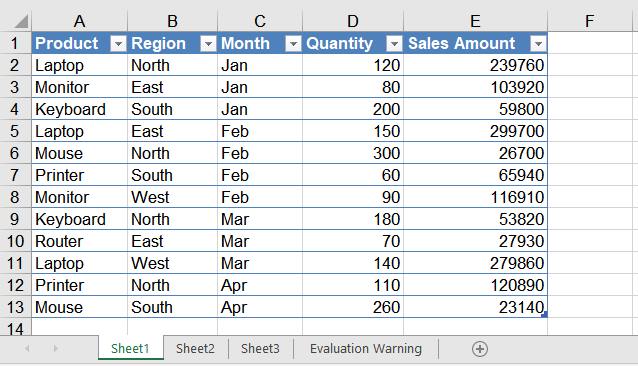
Converting a data range into a table is a quick way to obtain a structured range that has built-in filter buttons and banded styling. In this example, a sales detail list (Product, Region, Month, Quantity, Sales Amount) is first written into the worksheet, then the A1:E13 range is converted into a table named "Table1" with ListObjects.Create(), and finally the built-in light style TableStyleLight9 is applied. The main steps are as follows:
- Create a
Workbookobject and get the first worksheet. - Write the headers and the sample data into the cells.
- Call the
Worksheet.ListObjects.Create()method to convert the range that contains the headers into a table. - Apply a built-in style to the table through the
IListObject.BuiltInTableStyleproperty. - Save the workbook with the
Workbook.SaveToFile()method.
Here is a complete code example showing how to create an Excel table for a worksheet in React:
function App() {
  const createTable = async () => {
    // Get the Spire.XLS WASM module
    const xlsModule = window.wasmModule?.spirexls;

    // Check whether the module is ready
    if (!xlsModule) {
      alert('Spire.Xls is not ready yet');
      return;
    }

    // Load the font into the VFS for text measurement and column auto-fit
    await window.spire.FetchFileToVFS('ARIAL.TTF', '/Library/Fonts/', `${process.env.PUBLIC_URL}/font/`);

    // Create a new workbook and get the first worksheet
    const workbook = new xlsModule.Workbook();
    const sheet = workbook.Worksheets.get(0);

    // Write the headers
    sheet.Range.get('A1').Value = 'Product';
    sheet.Range.get('B1').Value = 'Region';
    sheet.Range.get('C1').Value = 'Month';
    sheet.Range.get('D1').Value = 'Quantity';
    sheet.Range.get('E1').Value = 'Sales Amount';

    // Write the sample data
    sheet.Range.get('A2').Value = 'Laptop';
    sheet.Range.get('B2').Value = 'North';
    sheet.Range.get('C2').Value = 'Jan';
    sheet.Range.get('D2').NumberValue = 120;
    sheet.Range.get('E2').NumberValue = 239760;

    sheet.Range.get('A3').Value = 'Monitor';
    sheet.Range.get('B3').Value = 'East';
    sheet.Range.get('C3').Value = 'Jan';
    sheet.Range.get('D3').NumberValue = 80;
    sheet.Range.get('E3').NumberValue = 103920;

    sheet.Range.get('A4').Value = 'Keyboard';
    sheet.Range.get('B4').Value = 'South';
    sheet.Range.get('C4').Value = 'Jan';
    sheet.Range.get('D4').NumberValue = 200;
    sheet.Range.get('E4').NumberValue = 59800;

    sheet.Range.get('A5').Value = 'Laptop';
    sheet.Range.get('B5').Value = 'East';
    sheet.Range.get('C5').Value = 'Feb';
    sheet.Range.get('D5').NumberValue = 150;
    sheet.Range.get('E5').NumberValue = 299700;

    sheet.Range.get('A6').Value = 'Mouse';
    sheet.Range.get('B6').Value = 'North';
    sheet.Range.get('C6').Value = 'Feb';
    sheet.Range.get('D6').NumberValue = 300;
    sheet.Range.get('E6').NumberValue = 26700;

    sheet.Range.get('A7').Value = 'Printer';
    sheet.Range.get('B7').Value = 'South';
    sheet.Range.get('C7').Value = 'Feb';
    sheet.Range.get('D7').NumberValue = 60;
    sheet.Range.get('E7').NumberValue = 65940;

    sheet.Range.get('A8').Value = 'Monitor';
    sheet.Range.get('B8').Value = 'West';
    sheet.Range.get('C8').Value = 'Feb';
    sheet.Range.get('D8').NumberValue = 90;
    sheet.Range.get('E8').NumberValue = 116910;

    sheet.Range.get('A9').Value = 'Keyboard';
    sheet.Range.get('B9').Value = 'North';
    sheet.Range.get('C9').Value = 'Mar';
    sheet.Range.get('D9').NumberValue = 180;
    sheet.Range.get('E9').NumberValue = 53820;

    sheet.Range.get('A10').Value = 'Router';
    sheet.Range.get('B10').Value = 'East';
    sheet.Range.get('C10').Value = 'Mar';
    sheet.Range.get('D10').NumberValue = 70;
    sheet.Range.get('E10').NumberValue = 27930;

    sheet.Range.get('A11').Value = 'Laptop';
    sheet.Range.get('B11').Value = 'West';
    sheet.Range.get('C11').Value = 'Mar';
    sheet.Range.get('D11').NumberValue = 140;
    sheet.Range.get('E11').NumberValue = 279860;

    sheet.Range.get('A12').Value = 'Printer';
    sheet.Range.get('B12').Value = 'North';
    sheet.Range.get('C12').Value = 'Apr';
    sheet.Range.get('D12').NumberValue = 110;
    sheet.Range.get('E12').NumberValue = 120890;

    sheet.Range.get('A13').Value = 'Mouse';
    sheet.Range.get('B13').Value = 'South';
    sheet.Range.get('C13').Value = 'Apr';
    sheet.Range.get('D13').NumberValue = 260;
    sheet.Range.get('E13').NumberValue = 23140;

    // Convert the A1:E13 data range into an Excel table (ListObject)
    const table = sheet.ListObjects.Create('Table1', sheet.Range.get({ row: 1, column: 1, lastRow: 13, lastColumn: 5 }));

    // Apply a built-in light table style
    table.BuiltInTableStyle = xlsModule.TableBuiltInStyles.TableStyleLight9;

    // Auto-fit the columns so that the contents are fully shown
    sheet.AllocatedRange.AutoFitColumns();

    // Save the workbook
    const outputFileName = 'CreateTable.xlsx';
    workbook.SaveToFile({ fileName: outputFileName, version: xlsModule.ExcelVersion.Version2010 });

    // Release resources
    workbook.Dispose();

    // Read the saved file from the VFS and trigger the download
    const fileArray = window.dotnetRuntime.Module.FS.readFile(outputFileName);
    const blob = new Blob([fileArray], { type: 'application/vnd.openxmlformats-officedocument.spreadsheetml.sheet' });
    const url = URL.createObjectURL(blob);
    const a = document.createElement('a');
    a.href = url;
    a.download = outputFileName;
    a.click();
    URL.revokeObjectURL(url);
  };

  return (
    <div style={{ textAlign: 'center', height: '300px' }}>
      <h1>Create Table</h1>
      <button onClick={createTable}>Start</button>
    </div>
  );
}

export default App;
Effect of creating the table:
Set the Table Style, Total Row and Stripes
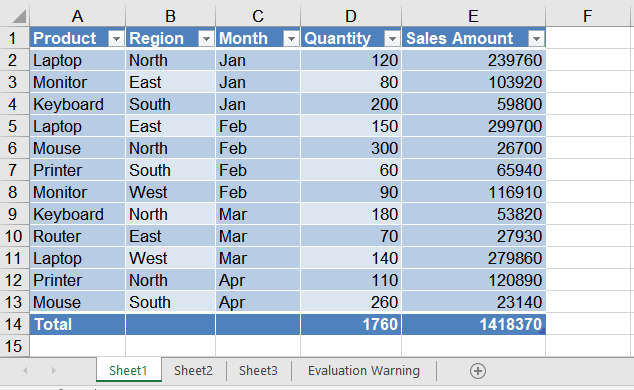
A created table can be restyled at any time: for example, replace the light style with the built-in Medium dark style, show a total row at the bottom of the table and let the "Quantity" and "Sales Amount" columns be summed automatically, and enable both row and column stripes to make the data easier to read. The main steps are as follows:
- Create a
Workbookobject and load a workbook that already contains a table with theWorkbook.LoadFromFile()method. - Get the worksheet with the
Workbook.Worksheets.get()method, and then get the table object withListObjects.get(). - Assign a new built-in style through the
BuiltInTableStyleproperty. - Set
DisplayTotalRowtotrueto show the total row, and useColumns[].TotalsRowLabelandColumns[].TotalsCalculationto set the label and the calculation of the total row columns. - Enable row and column stripes with
ShowTableStyleRowStripesandShowTableStyleColumnStripes. - Save the workbook with the
Workbook.SaveToFile()method.
Here is a complete code example showing how to load a created table in React and set its style and total row:
function App() {
  const formatTable = async () => {
    // Get the Spire.XLS WASM module
    const xlsModule = window.wasmModule?.spirexls;

    // Check whether the module is ready
    if (!xlsModule) {
      alert('Spire.Xls is not ready yet');
      return;
    }

    // Load the font into the VFS for text measurement and column auto-fit
    await window.spire.FetchFileToVFS('ARIAL.TTF', '/Library/Fonts/', `${process.env.PUBLIC_URL}/font/`);

    // Load the Excel file created in the previous section, which already contains a table
    const inputFileName = 'CreateTable.xlsx';
    await window.spire.FetchFileToVFS(inputFileName, '', `${process.env.PUBLIC_URL}data/`);

    // Create a Workbook object and load the workbook
    const workbook = new xlsModule.Workbook();
    workbook.LoadFromFile({ fileName: inputFileName });

    // Get the first worksheet and the table in it
    const sheet = workbook.Worksheets.get(0);
    const table = sheet.ListObjects.get(0);

    // Apply a built-in Medium table style
    table.BuiltInTableStyle = xlsModule.TableBuiltInStyles.TableStyleMedium9;

    // Show the total row
    table.DisplayTotalRow = true;

    // Set the label of the first column of the total row to "Total"
    table.Columns.get(0).TotalsRowLabel = 'Total';

    // Do not calculate the text columns, and sum the "Quantity" and "Sales Amount" columns automatically
    table.Columns.get(1).TotalsCalculation = xlsModule.ExcelTotalsCalculation.None;
    table.Columns.get(2).TotalsCalculation = xlsModule.ExcelTotalsCalculation.None;
    table.Columns.get(3).TotalsCalculation = xlsModule.ExcelTotalsCalculation.Sum;
    table.Columns.get(4).TotalsCalculation = xlsModule.ExcelTotalsCalculation.Sum;

    // Show the row stripes and column stripes
    table.ShowTableStyleRowStripes = true;
    table.ShowTableStyleColumnStripes = true;

    // Auto-fit the columns so that the contents are fully shown
    sheet.AllocatedRange.AutoFitColumns();

    // Save the workbook
    const outputFileName = 'FormatTable_out.xlsx';
    workbook.SaveToFile({ fileName: outputFileName, version: xlsModule.ExcelVersion.Version2010 });

    // Release resources
    workbook.Dispose();

    // Read the saved file from the VFS and trigger the download
    const fileArray = window.dotnetRuntime.Module.FS.readFile(outputFileName);
    const blob = new Blob([fileArray], { type: 'application/vnd.openxmlformats-officedocument.spreadsheetml.sheet' });
    const url = URL.createObjectURL(blob);
    const a = document.createElement('a');
    a.href = url;
    a.download = outputFileName;
    a.click();
    URL.revokeObjectURL(url);
  };

  return (
    <div style={{ textAlign: 'center', height: '300px' }}>
      <h1>Format Table</h1>
      <button onClick={formatTable}>Start</button>
    </div>
  );
}

export default App;
Effect of setting the table style:
Frequently Asked Questions
How do I change the built-in style of a table? What styles are available?
Reason: The BuiltInTableStyle property was not reassigned after the table was created, or the wrong enum type was assigned to the property.
Solution: Reassign the IListObject.BuiltInTableStyle property. Its values come from the TableBuiltInStyles enum, which provides multiple built-in styles including Light (TableStyleLight1 ~ TableStyleLight21), Medium (TableStyleMedium1 ~ TableStyleMedium28) and Dark (TableStyleDark1 ~ TableStyleDark11). For example, this article first applies TableStyleLight9 and then switches to TableStyleMedium9.
How do I name a table or rename it? What happens if two tables have the same name?
Reason: The first parameter of ListObjects.Create() is the table name, e.g. Create("Table1", ...). Within the same worksheet, table names must be unique; otherwise creating another table with the same name raises an error.
Solution: Pass a unique name when creating the table (e.g. "SalesTable1"). To rename an existing table, set its DisplayName property directly, for example table.DisplayName = "SalesTable2025";.
Get a Free License
Spire.XLS for JavaScript offers a 30-day full-featured free trial license with no functional limitations. Apply here to evaluate before purchasing.