In the field of education and academic affairs, processing exam scores after each test is one of the most frequent and time-consuming tasks. The same exam result often needs to be handled from two dimensions: for class students and class teachers, it needs to present the class's own score details, rankings, and subject strengths; for teachers and the academic affairs office, it needs cross-class horizontal comparison to determine which classes and subjects require focused attention.
The traditional approach usually requires manually writing formulas in Excel, sorting, drawing charts item by item, and writing analysis summaries. For different audiences, the same data must be reorganized twice, and the whole process often takes half a day to a full day. Formulas are error-prone, chart styles are inconsistent, and analysis criteria are hard to keep aligned.
Comparison with Traditional SDK API Processing
| Traditional Spire.Office for .NET API | Spire.Agent.Office Processing | |
|---|---|---|
| Driving Method | Write Excel formulas + file splitting + sorting + chart + conditional formatting code, controlling every step | Describe the goal in natural language; the AI understands and automatically orchestrates the execution path |
| Code Volume | Score analysis scenarios typically require 500-1000 lines of C# code (including per-class file splitting, formula calculation, ranking logic, chart configuration, etc.) | About 10 lines of calling code + one natural language instruction |
| Statistics Criteria | Must hard-code the calculation formulas and judgment logic for average/pass rate/excellence rate; adjusting criteria requires code changes | AI understands education statistics semantics and automatically computes by criteria such as "≥60 pass, ≥90 excellent" |
| Chart Generation | Must manually create Chart objects, configure data ranges, set chart types and styles | AI automatically selects the most appropriate chart type (radar, column, etc.) based on data semantics |
| Requirement Changes | Adding new statistics dimensions requires modifying code → compiling → deploying | Modify the description in the instruction; takes effect immediately |
This article introduces how to use the Excel AI capabilities of Spire.Agent.Office for two audiences — class students and teachers / the academic affairs office — to automate score statistics, ranking, and visual analysis with just a few natural language instructions.
For product installation and SpireToken configuration, please refer to Integrating Spire.Agent.Office in a .NET Project. The following examples assume Spire.Agent.Office is already installed and SpireToken is configured.
Class Score Statistics and Display
The score analysis for class students and class teachers focuses on the class itself: score details, in-class ranking, and subject strengths. Since there is no need for cross-class comparison, each class gets its own Excel file, which can be printed and posted, or used for parent meetings.
The following example uses the Spire.Agent.Office agent to automatically split data by class through natural language instructions and generate an independent score analysis Excel file for each class:
using Spire.Agent.Office.AI;
using Spire.Agent.Office.Extensions;
using Spire.Xls;

// Source score data (containing class, student name, and subject score columns)
string inputPath = @"C:\ScoreAnalysis\StudentScores.xlsx";
// Result document path (null uses the output folder path set below)
string savePath = null;
// Output directory (one file per class)
string OutDir = @"C:\ScoreAnalysis\ClassAnalysis";
// SpireToken Key
string key = "sk-TF***************************r";
// Natural language instruction
string instruction =
    "Process the input file as follows:\r\n" +
    "1. Read the file and generate one separate Excel analysis file per class, named 'XXClassScoreAnalysis.xlsx'\r\n" +
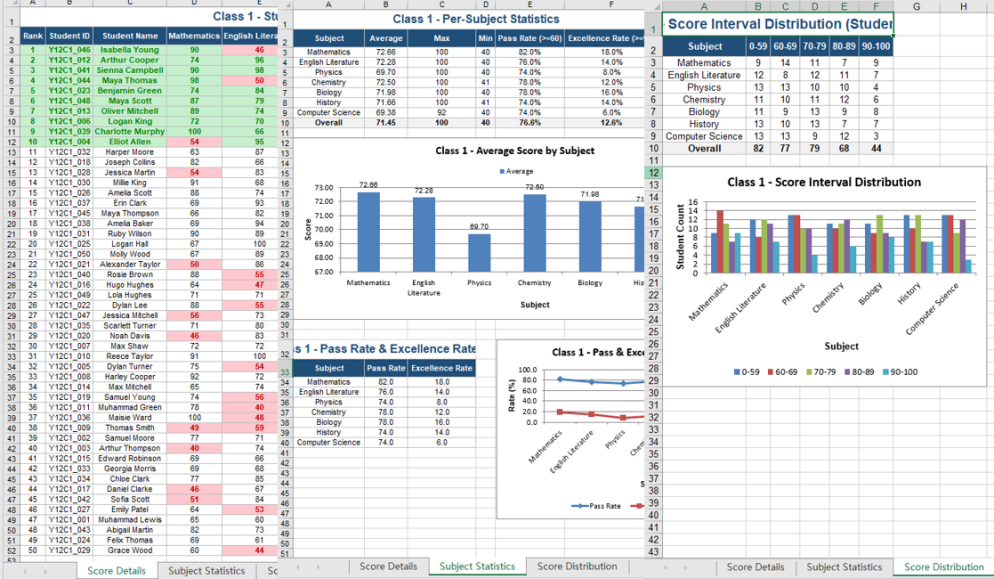
    "2. Each class file must contain: the class score details, class ranking by total score, per-subject average/max/min, pass rate (≥60 points), excellence rate (≥90 points), and score interval distribution\r\n" +
    "3. Choose appropriate chart types to visualize the class performance\r\n" +
    "4. Apply a unified and clean table style: highlight the top 10 by total score in green, and mark failing subject scores in red";
// AI generation
AIResult result = AnalyzeClassScores(instruction, inputPath, savePath, key, OutDir);

// AI-assisted score analysis
static AIResult AnalyzeClassScores(string instruction, string inputpath, string savePath, string key, string output)
{
    // Configure the AI processing options
    AIOptions options = new AIOptions();
    options.SpireToken = key;
    options.WorkDir = output;

    using (Workbook wb = new Workbook())
    {
        if (!string.IsNullOrEmpty(inputpath) && File.Exists(inputpath))
            wb.LoadFromFile(inputpath);
        AIDocumentProcessor processor = wb.AI(options);
        return processor.ExecuteInstruction(wb, instruction, savePath);
    }
}
Original score data and per-class score analysis files 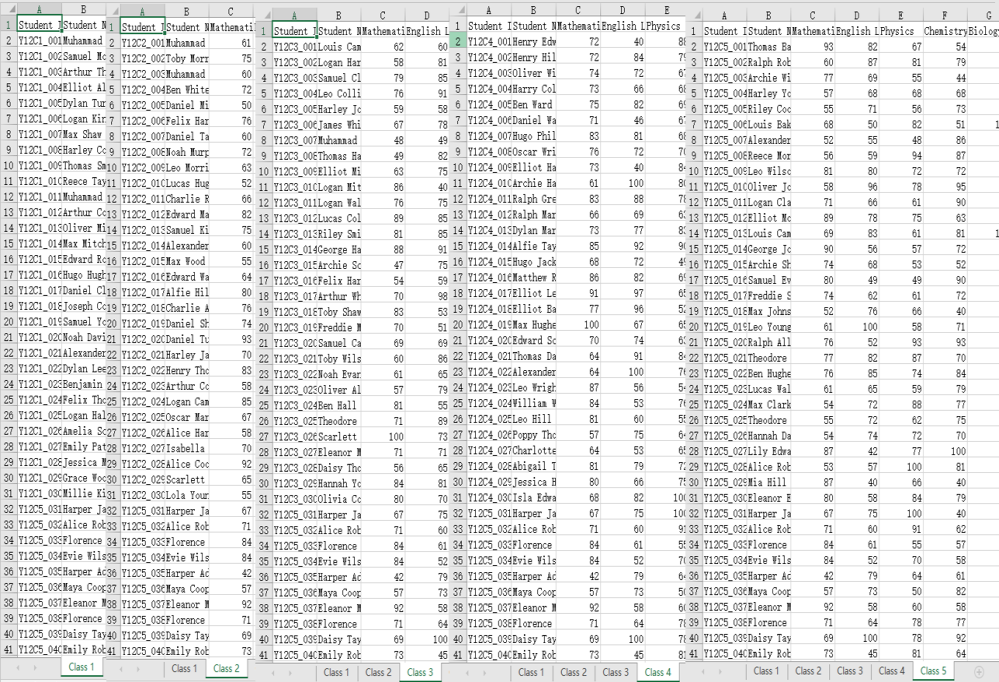
Grade Score Summary and Analysis
The score analysis for teachers and the academic affairs office focuses on the overall picture: gaps between classes, subjects that are weak across the board, and the distribution of the full-grade ranking. All classes' data must be consolidated into a single worksheet to enable horizontal comparison, unified criteria, and decision support.
The following example uses the Spire.Agent.Office agent to consolidate all classes' data into one worksheet through natural language instructions, completing class comparison and visual analysis:
using Spire.Agent.Office.AI;
using Spire.Agent.Office.Extensions;
using Spire.Xls;

// Source score data (containing class, student name, and subject score columns)
string inputPath = @"C:\ScoreAnalysis\StudentScores.xlsx";
// Save path of the grade score analysis file
string savePath = @"C:\ScoreAnalysis\GradeAnalysis.xlsx";
// SpireToken Key
string key = "sk-TF***************************r";
// Natural language instruction
string instruction =
    "Process the input file as follows:\r\n" +
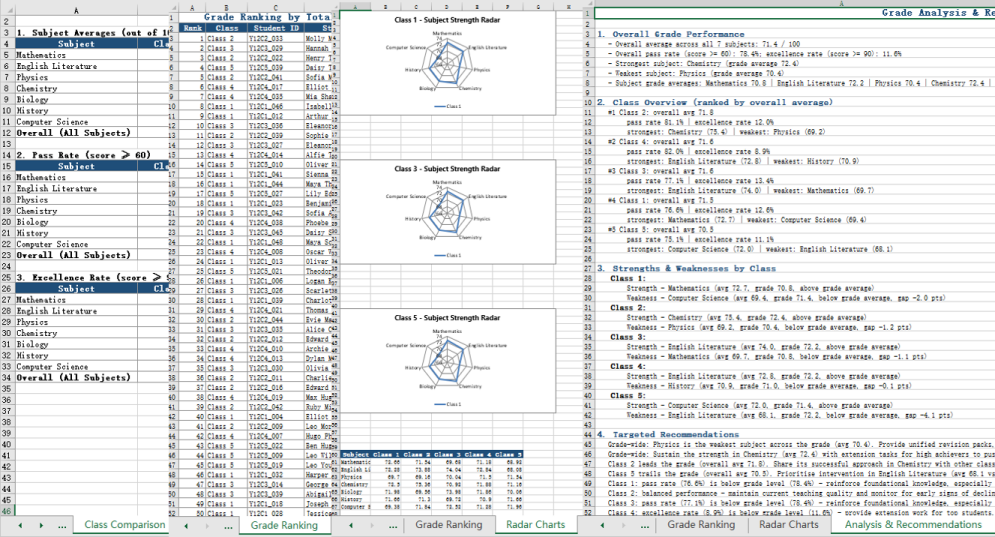
    "1. Read the file, and for each class calculate the average score, pass rate (≥60 points), and excellence rate (≥90 points) for every subject; generate a \"Class Comparison\" worksheet that summarizes these metrics for all classes.\r\n" +
    "2. Generate the overall grade ranking based on total scores.\r\n" +
    "3. Create radar charts for subject averages: one radar chart per class to show each class's own subject strengths, and a single combined radar chart that overlays all classes (each class as one series) for direct comparison.\r\n" +
    "4. Based on the statistical data, analyze the overall performance of the entire grade, identify each class's strengths and weaknesses, and provide targeted improvement recommendations.";
// AI generation
AIResult result = AnalyzeGradeScores(instruction, inputPath, savePath, key);

// AI-assisted score analysis
static AIResult AnalyzeGradeScores(string instruction, string inputpath, string savePath, string key)
{
    // Configure the AI processing options
    AIOptions options = new AIOptions();
    options.SpireToken = key;

    using (Workbook wb = new Workbook())
    {
        if (!string.IsNullOrEmpty(inputpath) && File.Exists(inputpath))
            wb.LoadFromFile(inputpath);
        AIDocumentProcessor processor = wb.AI(options);
        return processor.ExecuteInstruction(wb, instruction, savePath);
    }
}
Original score data and grade score analysis result 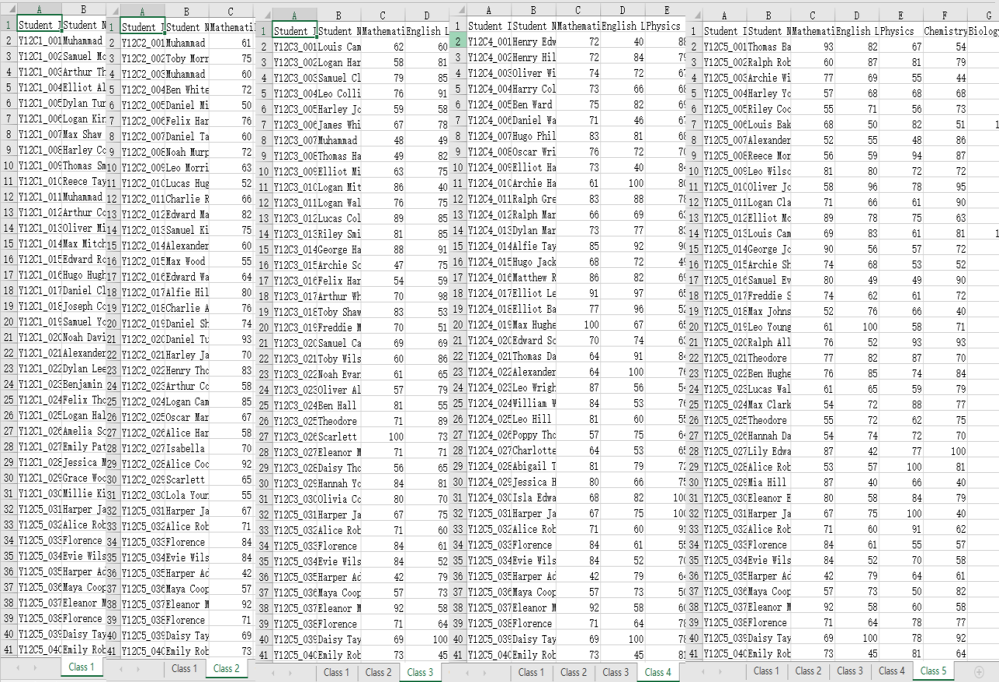
Comparison of the Two Approaches
| Class Score Statistics and Display | Grade Score Summary and Analysis | |
|---|---|---|
| Audience | Class students, class teachers | Teachers, academic affairs office |
| Output | One independent Excel file per class | All classes consolidated into one Excel file |
| Core Content | In-class score details, in-class ranking, per-subject statistics, subject strength charts | Cross-class comparison, full-grade ranking, radar charts, score analysis conclusions |
| Typical Uses | Print and post, parent meetings | Teaching research reports, teaching decisions, academic affairs statistics |
Frequently Asked Questions
The chart type is not as expected
Cause: The chart type selected by the AI may not match the user's presentation preferences.
Solution: Specify chart type preferences explicitly in the instruction, such as "use radar charts for class subject strengths, column charts for score interval distribution, and line charts for score trends across multiple tests."
How to handle tied rankings
Cause: It is normal for multiple students to have the same total score; the AI's default handling of tied ranks may not meet your requirements.
Solution: Specify the tie-breaking rule in the instruction, such as "when total scores are equal, sort by Computer Science score first."
Obtaining a SpireToken Key
- Contact sales@e-iceblue.com or visit https://www.e-iceblue.com/TemLicense.html to obtain a trial/commercial API key
Configure it in code:
AIOptions options = new AIOptions();
options.SpireToken = key;
