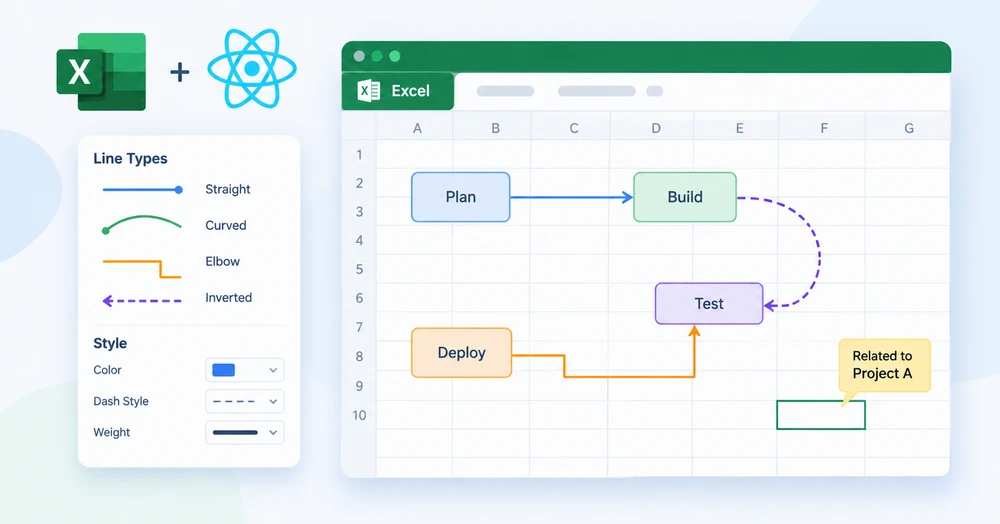
A worksheet is not always just a grid of numbers. Sometimes it is a canvas — a flowchart sketched between data blocks, a relationship diagram connecting teams to projects, a callout pointing from a note to the cell it annotates. In every one of these cases the missing element is a line: a straight stroke between two boxes, a curved arc around a region, an elbow connector that bends once and continues.
Spire.XLS for JavaScript gives a React app the sheet.Lines.AddLine() method for inserting line shapes at a specified position, with four line types available through the LineShapeType enum and full control over dash style, color, and weight. Everything runs in the browser on WebAssembly — no backend, no Excel automation, no file upload.
For project setup, see Integrating Spire.XLS for JavaScript in a React Project. The examples below assume the package is installed and the WebAssembly module has been initialized.
When a worksheet needs lines
Lines in a worksheet serve three broad purposes, and the line type you reach for depends on which one is in front of you:
| Scenario | What the line does | Typical line type |
|---|---|---|
| Flowchart between data blocks | Connects a process step to the next, sometimes with a bend | Straight or elbow |
| Relationship diagram | Links entities that are not aligned in a grid | Curved |
| Region boundary or divider | Separates one area of the sheet from another | Straight |
| Callout or annotation pointer | Draws attention from a label to a cell | Straight with an arrowhead |
The arrowhead case — where the line needs to show direction — uses a different API, TypedLines.AddLine(), which supports arrow styles on both ends and pixel-precise positioning. That is covered separately in Add Arrow Connectors in Excel in JavaScript (React). This article focuses on Lines.AddLine(), which handles the four core line shapes and their visual styling.
Prerequisites
You need a React project with Spire.XLS for JavaScript installed and the WebAssembly module initialized, reachable at window.wasmModule.spirexls. The sample loads a font into the VFS for text measurement and saves with the Excel 2010 version flag.
The four line types
LineShapeType exposes four shapes, and the difference between them is geometric — how the line travels from its start to its end:
LineShapeType value |
Shape | What it looks like | Reach for it when |
|---|---|---|---|
Line |
Straight line | A single stroke from start to end | Connecting two points on the same row or column |
CurveLine |
Curved line | A smooth arc between start and end | Routing around other content, or showing a non-linear relationship |
ElbowLine |
Elbow connector | A line that bends once at a right angle | Flowchart steps that are not directly aligned |
LineInv |
Inverted line | A straight line with inverted orientation | Mirror layouts or right-to-left diagrams |
All four are created by the same method — sheet.Lines.AddLine() — with the lineShapeType parameter selecting which one is drawn. The appearance properties (DashStyle, Color, Weight) apply to all four uniformly.
Insert lines into a worksheet
The example inserts one of each line type into a fresh worksheet, each with a distinct dash style and color so the four shapes are distinguishable in the output. The steps are:
- Create a
Workbookobject and get the first worksheet. - Call
Worksheet.Lines.AddLine()four times, passing position parameters and a differentLineShapeTypeeach time. - Customize each line's
DashStyle,Color, andWeight. - Save the workbook with
Workbook.SaveToFile().
function App() {
  const addLineShapes = async () => {
    // Get the Spire.XLS WASM module
    const xlsModule = window.wasmModule?.spirexls;

    // Check whether the module is ready
    if (!xlsModule) {
      alert('Spire.Xls is not ready yet');
      return;
    }

    // Load the font into the VFS for text measurement and column auto-fit
    await window.spire.FetchFileToVFS('ARIAL.TTF', '/Library/Fonts/', `${process.env.PUBLIC_URL}/font/`);

    // Create a new workbook and get the first worksheet
    const workbook = new xlsModule.Workbook();
    const sheet = workbook.Worksheets.get(0);

    // Add a straight line - solid, CadetBlue, weight 2, with arrow
    let line1 = sheet.Lines.AddLine({ row: 10, column: 2, width: 200, height: 1, lineShapeType: xlsModule.LineShapeType.Line });
    line1.DashStyle = xlsModule.ShapeDashLineStyleType.Solid;
    line1.Color = xlsModule.Color.get_CadetBlue();
    line1.Weight = 2;
    line1.EndArrowHeadStyle = xlsModule.ShapeArrowStyleType.LineArrow;

    // Add a curved line - dotted, OrangeRed, weight 2
    let line2 = sheet.Lines.AddLine({ row: 12, column: 2, width: 200, height: 1, lineShapeType: xlsModule.LineShapeType.CurveLine });
    line2.DashStyle = xlsModule.ShapeDashLineStyleType.Dotted;
    line2.Color = xlsModule.Color.get_OrangeRed();
    line2.Weight = 2;

    // Add an elbow connector - DashDotDot, Purple, weight 2
    let line3 = sheet.Lines.AddLine({ row: 14, column: 2, width: 200, height: 1, lineShapeType: xlsModule.LineShapeType.ElbowLine });
    line3.DashStyle = xlsModule.ShapeDashLineStyleType.DashDotDot;
    line3.Color = xlsModule.Color.get_Purple();
    line3.Weight = 2;

    // Add an inverted line - Dashed, Green, weight 2
    let line4 = sheet.Lines.AddLine({ row: 16, column: 2, width: 200, height: 1, lineShapeType: xlsModule.LineShapeType.LineInv });
    line4.DashStyle = xlsModule.ShapeDashLineStyleType.Dashed;
    line4.Color = xlsModule.Color.get_Green();
    line4.Weight = 2;

    // Save the workbook
    const outputFileName = 'AddLineShapes.xlsx';
    workbook.SaveToFile({ fileName: outputFileName, version: xlsModule.ExcelVersion.Version2010 });

    // Release resources
    workbook.Dispose();

    // Read the saved file from the VFS and trigger the download
    const fileArray = window.dotnetRuntime.Module.FS.readFile(outputFileName);
    const blob = new Blob([fileArray], { type: 'application/vnd.openxmlformats-officedocument.spreadsheetml.sheet' });
    const url = URL.createObjectURL(blob);
    const a = document.createElement('a');
    a.href = url;
    a.download = outputFileName;
    a.click();
    URL.revokeObjectURL(url);
  };

  return (
    <div style={{ textAlign: 'center', height: '300px' }}>
      <h1>Add Line Shapes</h1>
      <button onClick={addLineShapes}>Start</button>
    </div>
  );
}

export default App;
Four line types inserted into a worksheet: straight, curved, elbow, and inverted

The first line also sets EndArrowHeadStyle, which gives it an arrowhead at the end — Lines.AddLine() supports a single arrow style on the end, but not on the beginning. For arrows on both ends or pixel-precise positioning, use TypedLines.AddLine() instead, covered in Add Arrow Connectors in Excel in JavaScript (React).
Customizing line appearance
Three properties control how a line looks, and they are independent — changing one does not reset the others:
| Property | What it controls | Example values |
|---|---|---|
DashStyle |
The dash pattern of the stroke |
Solid, Dotted, Dashed, DashDotDot
|
Color |
The stroke color | Any xlsModule.Color.get_*() value |
Weight |
The stroke thickness, in points |
1, 2, 3 — higher is thicker |
The dash style is the one worth experimenting with. A solid line reads as a permanent connection; a dotted line reads as a tentative or optional one; a dashed line reads as a boundary. In a flowchart where some connections are conditional, using Solid for the main flow and Dashed for the conditional branches communicates the distinction without a legend.
Positioning by row and column
Lines.AddLine() places a line using row and column coordinates, plus a width and height:
sheet.Lines.AddLine({ row: 10, column: 2, width: 200, height: 1, lineShapeType: xlsModule.LineShapeType.Line });
-
rowandcolumnset the anchor point — where the line starts. -
widthsets the horizontal extent in pixels. -
heightsets the vertical extent in pixels. A height of1produces a horizontal line; a width of1produces a vertical one.
This is a hybrid system: the anchor is in spreadsheet units (rows and columns), but the size is in pixels. That makes it straightforward to align a line with a specific cell — pass that cell's row and column — but the length needs to account for column widths and row heights, which vary. If you need full pixel control over the start position as well as the size, TypedLines.AddLine() offers Top and Left in pixels.
Common issues
The line is not visible in the output.
Check Weight and Color. A weight of 0 or a color that matches the background produces an invisible line. Also verify that row and column place the line within the used range of the worksheet — a line anchored at row 1000 on an empty sheet is drawn but off-screen.
The arrowhead is missing.
EndArrowHeadStyle was not set, or was set to LineNoArrow. Assign ShapeArrowStyleType.LineArrow to show an arrowhead at the end of the line. Lines.AddLine() does not support BeginArrowHeadStyle — for arrows on both ends, use TypedLines.AddLine().
The elbow line goes in an unexpected direction.
An elbow connector bends once, and the direction of the bend depends on the width and height values. A positive width with a positive height bends down-right; changing the sign of either value changes the bend direction. Experiment with small values first to confirm the shape before committing to a large layout.
Lines overlap or stack on top of each other.
Each call to AddLine creates an independent shape at the specified position. If two lines share the same row and column, they overlap. Offset the row value by 2 or more for each successive line, as the example does.
FAQ
What is the difference between Lines.AddLine() and TypedLines.AddLine()?
Lines.AddLine() positions by row and column and supports an arrowhead on the end only. TypedLines.AddLine() positions by pixel coordinates and supports arrowheads on both ends. For basic line shapes without directional arrows, Lines.AddLine() is simpler. For connectors that need precise placement or bidirectional arrows, see Add Arrow Connectors in Excel in JavaScript (React).
Can I create a vertical line?
Yes. Set width to 1 and height to a positive value. The line extends downward from the anchor point.
How many lines can a single worksheet hold?
There is no hard limit in the API. Each line is a shape object stored in the worksheet's shapes collection, and the practical constraint is file size and rendering performance when hundreds of shapes are present.
Do the lines survive if the file is opened in Excel?
Yes. Lines are stored as standard shape objects in the worksheet XML. Excel reads and renders them natively — they are not a rendering artifact specific to Spire.XLS.
Can I retrieve and modify lines that already exist in a workbook?
Yes. Traverse the sheet.Shapes collection to access line shape objects, then modify their properties through the ILineShape interface. For deletion, use sheet.Shapes.Remove(index).