.NET (1327)
Children categories
What is Excel Interior?
Excel provides essentially no support in worksheet functions for Working with cell colors. However, colors are often used in spreadsheets to indicate some sorts of value or category. Thus comes the need for functions that can work with colors on the worksheet. So it appears in the version in Excel 2007 as a new function. It contains all kinds of colors. Below I will show you how to insert interior in Excel with MS Excel and how to do this with Spire.XLS.
How to insert interior in Excel with MS Excel?
To insert interior in Excel with Microsoft Excel, you can follow the sections below:
- Open the worksheet in Excel
- Highlight the zones that you want to insert interior
- Rightclick and choose Setting Cell Format
- Choose Fill->Fill Effect in the dialog box of Setting Cell Format
- In the box, you can change the Color and the Shade Format to your desired effect
How to Insert Interior with Spire.XLS?
It's convenient to realize C#/.NET Excel Integration via Spire.XLS. In interior method, to realize interior you may set the color gradient by assigning sheet.Range[string.Format("E{0}:K{0}", i)].Style.Interior.FillPattern property with ExcelPatternType.Gradient. You can set the BackKnownColor and ForeKnownColor of the sheet. What's more, you can set the gradient style, in the demo, we set the gradient style vertical. In order to reflect the effect, we merge the worksheet range from E to K. In this demo, we use Enum method to enumerate many kinds of colors and define a random object to fill the cell with a gradient color randomly.
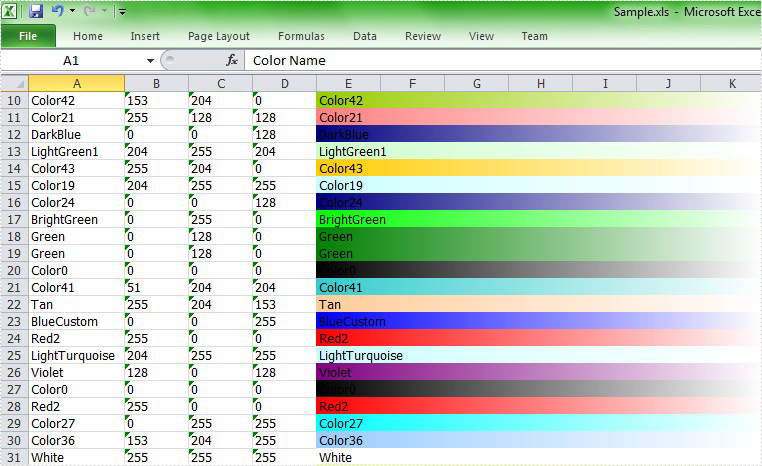
First, let's preview the effect screenshot:
Here comes to the full code in C# and VB.NET.
using Spire.Xls;
using System.Drawing;
using System;

namespace Interior
{
    class Program
    {
        static void Main(string[] args)
        {
            //Create a workbook
            Workbook workbook = new Workbook();

            //Initialize the worksheet
            Worksheet sheet = workbook.Worksheets[0];

            //Specify the version
            workbook.Version = ExcelVersion.Version2007;

            //Define the number of the colors
            int maxColor = Enum.GetValues(typeof(ExcelColors)).Length;

            //Create a random object
            Random random = new Random((int)System.DateTime.Now.Ticks);

            for (int i = 2; i < 40; i++)
            {
                //Random backKnownColor
                ExcelColors backKnownColor = (ExcelColors)(random.Next(1, maxColor / 2));
                sheet.Range["A1"].Text = "Color Name";
                sheet.Range["B1"].Text = "Red";
                sheet.Range["C1"].Text = "Green";
                sheet.Range["D1"].Text = "Blue";

                //Merge the sheet"E1-K1"
                sheet.Range["E1:K1"].Merge();
                sheet.Range["E1:K1"].Text = "Gradient";
                sheet.Range["A1:K1"].Style.Font.IsBold = true;
                sheet.Range["A1:K1"].Style.Font.Size = 11;

                //Set the text of color in sheetA-sheetD
                string colorName = backKnownColor.ToString();
                sheet.Range[string.Format("A{0}", i)].Text = colorName;
                sheet.Range[string.Format("B{0}", i)].Text = workbook.GetPaletteColor(backKnownColor).R.ToString();
                sheet.Range[string.Format("C{0}", i)].Text = workbook.GetPaletteColor(backKnownColor).G.ToString();
                sheet.Range[string.Format("D{0}", i)].Text = workbook.GetPaletteColor(backKnownColor).B.ToString();

                //Merge the sheets
                sheet.Range[string.Format("E{0}:K{0}", i)].Merge();

                //Set the text of sheetE-sheetK
                sheet.Range[string.Format("E{0}:K{0}", i)].Text = colorName;

                //Set the interior of the color
                sheet.Range[string.Format("E{0}:K{0}", i)].Style.Interior.FillPattern = ExcelPatternType.Gradient;
                sheet.Range[string.Format("E{0}:K{0}", i)].Style.Interior.Gradient.BackKnownColor = backKnownColor;
                sheet.Range[string.Format("E{0}:K{0}", i)].Style.Interior.Gradient.ForeKnownColor = ExcelColors.White;
                sheet.Range[string.Format("E{0}:K{0}", i)].Style.Interior.Gradient.GradientStyle = GradientStyleType.Vertical;
                sheet.Range[string.Format("E{0}:K{0}", i)].Style.Interior.Gradient.GradientVariant = GradientVariantsType.ShadingVariants1;
            }

            //AutoFit Column
            sheet.AutoFitColumn(1);

            //Save the file
            workbook.SaveToFile("Sample.xls",ExcelVersion.Version97to2003);

            //Launch the file
            System.Diagnostics.Process.Start("Sample.xls");
        }
    }
}
Imports Spire.Xls
Imports System.Drawing
Imports System

Module Module1

    Sub Main()
        'Create a workbook
        Dim workbook As New Workbook()

        'Initialize the worksheet
        Dim sheet As Worksheet = workbook.Worksheets(0)

        'Specify the version
        workbook.Version = ExcelVersion.Version2007

        'Define the number of the colors
        Dim maxColor As Integer = [Enum].GetValues(GetType(ExcelColors)).Length

        'Create a random object
        Dim random As New Random()

        For i As Integer = 2 To 39
            'Random backKnownColor
            Dim backKnownColor As ExcelColors = DirectCast(random.[Next](1, maxColor \ 2), ExcelColors)
            sheet.Range("A1").Text = "Color Name"
            sheet.Range("B1").Text = "Red"
            sheet.Range("C1").Text = "Green"
            sheet.Range("D1").Text = "Blue"

            'Merge the sheet"E1-K1"
            sheet.Range("E1:K1").Merge()
            sheet.Range("E1:K1").Text = "Gradient"
            sheet.Range("A1:K1").Style.Font.IsBold = True
            sheet.Range("A1:K1").Style.Font.Size = 11

            'Set the text of color in sheetA-sheetD
            Dim colorName As String = backKnownColor.ToString()
            sheet.Range(String.Format("A{0}", i)).Text = colorName
            sheet.Range(String.Format("B{0}", i)).Text = workbook.GetPaletteColor(backKnownColor).R.ToString()
            sheet.Range(String.Format("C{0}", i)).Text = workbook.GetPaletteColor(backKnownColor).G.ToString()
            sheet.Range(String.Format("D{0}", i)).Text = workbook.GetPaletteColor(backKnownColor).B.ToString()

            'Merge the sheets
            sheet.Range(String.Format("E{0}:K{0}", i)).Merge()

            'Set the text of sheetE-sheetK
            sheet.Range(String.Format("E{0}:K{0}", i)).Text = colorName

            'Set the interior of the color
            sheet.Range(String.Format("E{0}:K{0}", i)).Style.Interior.FillPattern = ExcelPatternType.Gradient
            sheet.Range(String.Format("E{0}:K{0}", i)).Style.Interior.Gradient.BackKnownColor = backKnownColor
            sheet.Range(String.Format("E{0}:K{0}", i)).Style.Interior.Gradient.ForeKnownColor = ExcelColors.White
            sheet.Range(String.Format("E{0}:K{0}", i)).Style.Interior.Gradient.GradientStyle = GradientStyleType.Vertical
            sheet.Range(String.Format("E{0}:K{0}", i)).Style.Interior.Gradient.GradientVariant = GradientVariantsType.ShadingVariants1
        Next

        'AutoFit Column
        sheet.AutoFitColumn(1)

        'Save doc file.
        workbook.SaveToFile("Sample.xls",ExcelVersion.Version97to2003)

        'Launching the MS Word file.
        System.Diagnostics.Process.Start("Sample.xls")
    End Sub
End Module
After running the demo, you will find color interior in your 2007 worksheet.
In today's digital age, managing and manipulating Excel files programmatically has become an essential skill for developers. Whether you're building a reporting tool, automating data processing, or enhancing your applications with dynamic data handling, having a robust library at your disposal can make all the difference. Enter Spire.XLS for .NET - a versatile and powerful library that allows you to create, read, write, and edit Excel files seamlessly using C#.
In this article, you will learn how to edit Excel documents effortlessly using C# and Spire.XLS for .NET.
- Read and Write Excel Files in C#
- Apply Styles and Formats to Excel Cells in C#
- Find and Replace Text in Excel in C#
- Add Formulas and Charts to Excel in C#
Install Spire.XLS for .NET
To begin with, you need to add the DLL files included in the Spire.XLS for .NET package as references in your .NET project. The DLL files can be either downloaded from this link or installed via NuGet.
PM> Install-Package Spire.XLS
Read and Write Excel Files in C#
One of the most common tasks when working with Excel files in C# is reading and writing data. Spire.XLS for .NET provides the CellRange.Value property, enabling developers to easily retrieve or assign values to individual cells.
The step to read and write an Excel file using C# are as follows:
- Create a Workbook object.
- Load an Excel file from a given file path.
- Get a specific worksheet using the Workbook.Worksheets[] property.
- Get a specific cell using the Worksheet.Range[] property
- Get or set the cell value using the CellRange.Value property.
- Save the workbook to a different Excel file.
- C#
using Spire.Xls;
namespace ReadAndWriteExcel
{
class Program
{
static void Main(string[] args)
{
// Create a Workbook object
Workbook workbook = new Workbook();
// Load an Excel file
workbook.LoadFromFile("C:\\Users\\Administrator\\Desktop\\Sample.xlsx");
// Get a specific worksheet
Worksheet worksheet = workbook.Worksheets[0];
// Get a specific cell
CellRange cell = worksheet.Range["A1"];
// Read the cell value
String text = cell.Value;
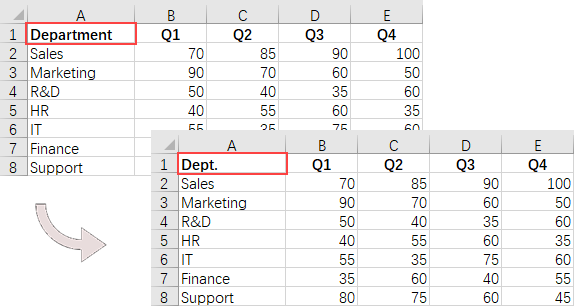
// Determine if the cell value is "Department"
if (text == "Department")
{
// Update the cell value
cell.Value = "Dept.";
}
// Save the workbook to a different
workbook.SaveToFile("ModifyExcel.xlsx", ExcelVersion.Version2016);
// Dispose resources
workbook.Dispose();
}
}
}
Apply Styles and Formats to Excel Cells in C#
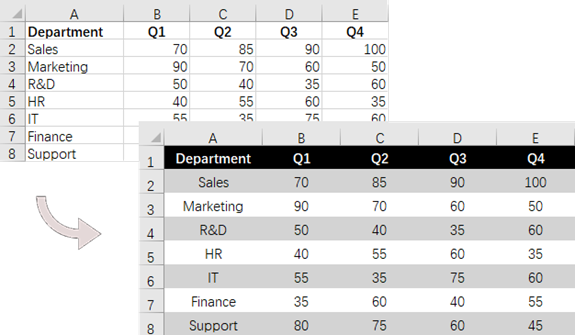
Styling and formatting Excel documents is an important aspect of creating professional-looking reports. Spire.XLS for .NET offers a variety of APIs within the CellRange class for managing cell styles, fonts, colors, and alignments, as well as adjusting row heights and column widths.
The steps to apply styles and formats to Excel cells are as follows:
- Create a Workbook object.
- Load an Excel file from a given file path.
- Get a specific worksheet using the Workbook.Worksheets[] property.
- Get all located range using the Worksheet.AllocatedRange property.
- Get a specific row using the CellRange.Rows[] property, and set the cell color, text color, text alignment, and row height using the properties under the CellRange object.
- Get a specific column using the CellRange.Columns[] property, and set the column width using the ColumnWidth property under the CellRange object.
- Save the workbook to a different Excel file.
- C#
using Spire.Xls;
using System.Drawing;

namespace FormatCells
{
    class Program
    {
        static void Main(string[] args)
        {
            // Create a Workbook object
            Workbook workbook = new Workbook();

            // Load an Excel file
            workbook.LoadFromFile("C:\\Users\\Administrator\\Desktop\\Sample.xlsx");

            // Get a specific worksheet
            Worksheet worksheet = workbook.Worksheets[0];

            // Get all located range from the worksheet
            CellRange allocatedRange = worksheet.AllocatedRange;

            // Iterate through the rows
            for (int rowNum = 0; rowNum < allocatedRange.RowCount; rowNum++)
            {
                if(rowNum == 0)
                {
                    // Apply cell color to the header row
                    allocatedRange.Rows[rowNum].Style.Color = Color.Black;

                    // Change the font color of the header row
                    allocatedRange.Rows[rowNum].Style.Font.Color = Color.White;
                }

                // Apply alternate colors to other rows
                else if (rowNum % 2 == 1)
                {
                    allocatedRange.Rows[rowNum].Style.Color = Color.LightGray;
                }
                else if (rowNum % 2 == 0)
                {
                    allocatedRange.Rows[rowNum].Style.Color = Color.White;
                }

                // Align text to center
                allocatedRange.Rows[rowNum].HorizontalAlignment = HorizontalAlignType.Center;
                allocatedRange.Rows[rowNum].VerticalAlignment = VerticalAlignType.Center;

                // Set the row height
                allocatedRange.Rows[rowNum].RowHeight = 20;
            }

            // Iterate through the columns
            for (int columnNum = 0; columnNum < allocatedRange.ColumnCount; columnNum++)
            {
                // Set the column width
                if (columnNum > 0)
                {
                    allocatedRange.Columns[columnNum].ColumnWidth = 10;
                }
            }

            // Save the workbook to a different
            workbook.SaveToFile("FormatExcel.xlsx", ExcelVersion.Version2016);

            // Dispose resources
            workbook.Dispose();
        }
    }
}
Find and Replace Text in Excel in C#
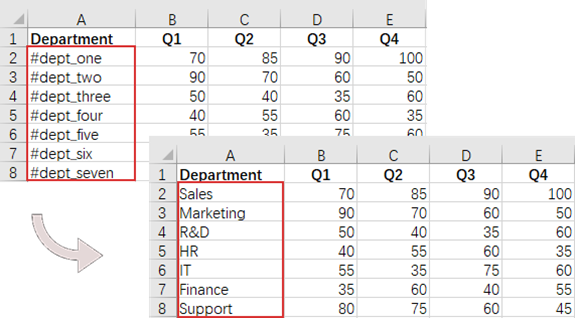
The find and replace feature in Excel enhances data accuracy and consistency while significantly improving efficiency. With Spire.XLS for .NET, you can easily locate a cell containing a specific string using the Worksheet.FindString() method and then update the cell value with the CellRange.Value property.
The steps to find and replace text in Excel using C# are as follows:
- Create a Workbook object.
- Load an Excel file from a given file path.
- Get a specific worksheet using the Workbook.Worksheets[] property.
- Find the cell that contains a specified string using the Worksheet.FindString() method.
- Update the cell value using the CellRange.Value property.
- Save the workbook to a different Excel file.
- C#
using Spire.Xls;

namespace FindAndReplaceText
{
    class Program
    {
        static void Main(string[] args)
        {
            // Create a Workbook object
            Workbook workbook = new Workbook();

            // Load an Excel file
            workbook.LoadFromFile("C:\\Users\\Administrator\\Desktop\\Sample.xlsx");

            // Get a specific worksheet
            Worksheet worksheet = workbook.Worksheets[0];

            // Define an array of department names for replacement
            String[] departments = new String[] { "Sales", "Marketing", "R&D", "HR", "IT", "Finance", "Support" };

            // Define an array of placeholders that will be replaced in the Excel sheet
            String[] placeholders = new String[] { "#dept_one", "#dept_two", "#dept_three", "#dept_four", "#dept_five", "#dept_six", "#dept_seven" };

            // Iterate through the placeholder strings
            for (int i = 0; i < placeholders.Length; i++)
            {
                // Find the cell containing the current placeholder string
                CellRange cell = worksheet.FindString(placeholders[i], false, false);

                // Replace the text in the found cell with the corresponding department name
                cell.Text = departments[i];
            }

            // Save the workbook to a different
            workbook.SaveToFile("ReplaceText.xlsx", ExcelVersion.Version2016);

            // Dispose resources
            workbook.Dispose();
        }
    }
}
Add Formulas and Charts to Excel in C#
In addition to basic file operations, Spire.XLS for .NET provides a variety of advanced techniques for working with Excel files. These techniques can be used to automate complex tasks, perform calculations, and generate dynamic reports.
The following are the steps to add formulas and create a chart in Excel using C#:
- Create a Workbook object.
- Load an Excel file from a given file path.
- Get a specific worksheet using the Workbook.Worksheets[] property.
- Get a specific cell using the Worksheet.Range[] property.
- Add a formula to the cell using the CellRange.Formula property.
- Add a column chart to the worksheet using the Worksheet.Charts.Add() method.
- Set the chart data range, position, title and other attributes using the methods and properties under the Chart object.
- Save the workbook to a different Excel file.
- C#
using Spire.Xls;
namespace AddFormulaAndChart
{
class Program
{
static void Main(string[] args)
{
// Create a Workbook object
Workbook workbook = new Workbook();
// Load an Excel file
workbook.LoadFromFile("C:\\Users\\Administrator\\Desktop\\Sample.xlsx");
// Get a specific worksheet
Worksheet worksheet = workbook.Worksheets[0];
// Get all located range
CellRange allocatedRange = worksheet.AllocatedRange;
// Iterate through the rows
for (int rowNum = 0; rowNum < allocatedRange.RowCount; rowNum++)
{
if (rowNum == 0)
{
// Write text in the cell F1
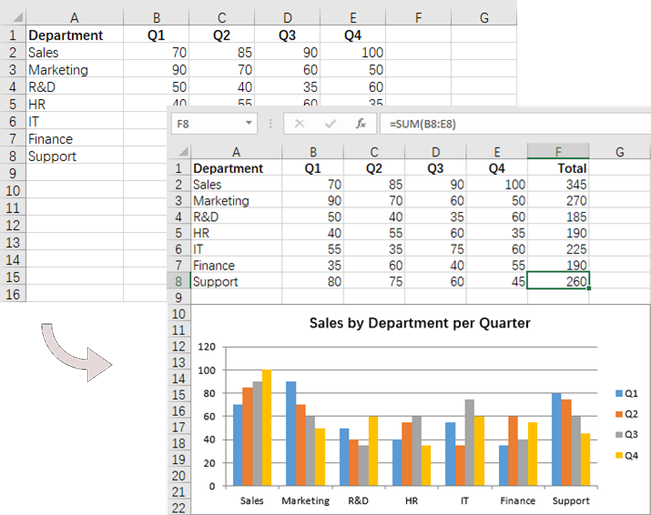
worksheet.Range[rowNum + 1, 6].Text = "Total";
// Apply style to the cell
worksheet.Range[rowNum + 1, 6].Style.Font.IsBold = true;
worksheet.Range[rowNum + 1, 6].Style.HorizontalAlignment = HorizontalAlignType.Right;
}
else
{
// Add formulas to the cells from F2 to F8
worksheet.Range[rowNum + 1, 6].Formula = $"=SUM(B{rowNum + 1}:E{rowNum + 1})";
}
}
// Add a clustered column chart
Chart chart = worksheet.Charts.Add(ExcelChartType.ColumnClustered);
// Set data range for the chart
chart.DataRange = worksheet.Range["A1:E8"];
chart.SeriesDataFromRange = false;
// Set position of the chart
chart.LeftColumn = 1;
chart.TopRow = 10;
chart.RightColumn = 8;
chart.BottomRow = 23;
// Set and format chart title
chart.ChartTitle = "Sales by Department per Quarter";
chart.ChartTitleArea.Size = 13;
chart.ChartTitleArea.IsBold = true;
// Save the workbook to a different
workbook.SaveToFile("AddFormulaAndChart.xlsx", ExcelVersion.Version2016);
// Dispose resources
workbook.Dispose();
}
}
}
Apply for a Temporary License
If you'd like to remove the evaluation message from the generated documents, or to get rid of the function limitations, please request a 30-day trial license for yourself.
This section aims at providing developers a solution to unlock sheet in Excel workbook with C#, VB.NET via this Excel library Spire.XLS for .NET.
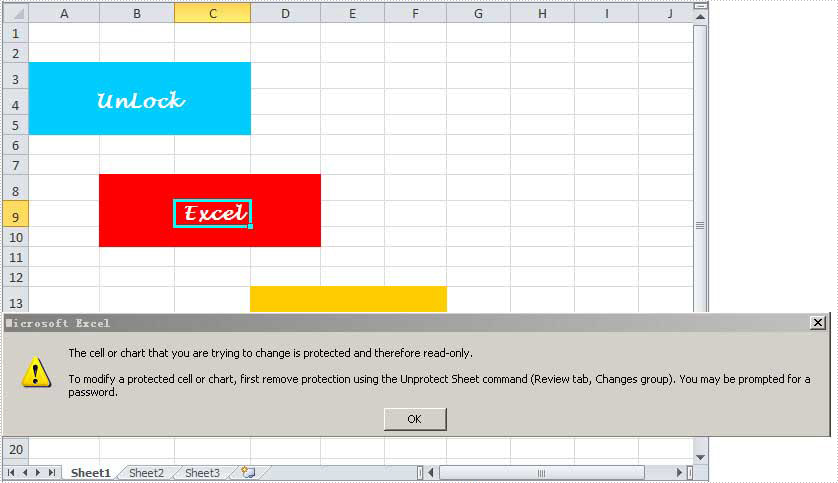
Spire.XLS for .NET enables you to unlock any sheet in Excel file only by one line of key code: Spire.Xls.Worksheet.Unprotect(string password); Besides, as an MS Excel component, Spire.XLS for .NET also enables you to create, read and handle Excel files with fast speed. Below is an Excel file with protected worksheets which will be unlocked in my task.
Since you will use Spire.XLS for .NET, you have to download Spire.XLS for .NET and install it on system. When you create your project, please do not forget to add Spire.XLS.dll as reference from Bin folder. The default path is "..\Spire.XLS\Bin\NET4.0\Spire.XLS.dll". Please note that Spire.XLS for .NET supports .NET Framework 2.0 and above. Here is the whole code for unlocking Excel sheet:
namespace UnlockExcelSheet
{
    class Program
    {
        static void Main(string[] args)
        {
            //initialize an instance of Workbook
            Workbook workbook = new Workbook();
            //Load an Excel file with protected worksheet
            workbook.LoadFromFile(@"..\Unlock Excel Worksheet.xlsx");
            //get the first worksheet
            Worksheet sheet = workbook.Worksheets[0];
            //Unprotect worksheet
            sheet.Unprotect("iceblue");
            //Save the file
            workbook.SaveToFile("Sample.xlsx",ExcelVersion.Version2010);
            //Launch the file
            System.Diagnostics.Process.Start("Sample.xlsx");
        }
    }
}
Namespace UnlockExcelSheet
	Class Program
		Private Shared Sub Main(args As String())
			'initialize an instance of Workbook
			Dim workbook As New Workbook()
			'Load an Excel file with protected worksheet
			workbook.LoadFromFile("..\Unlock Excel Worksheet.xlsx")
			'get the first worksheet
			Dim sheet As Worksheet = workbook.Worksheets(0)
			'Unprotect worksheet
			sheet.Unprotect("iceblue")
			'Save the file
			workbook.SaveToFile("Sample.xlsx",ExcelVersion.Version2010)
			'Launch the file
			System.Diagnostics.Process.Start("Sample.xlsx")
		End Sub
	End Class
End Namespace
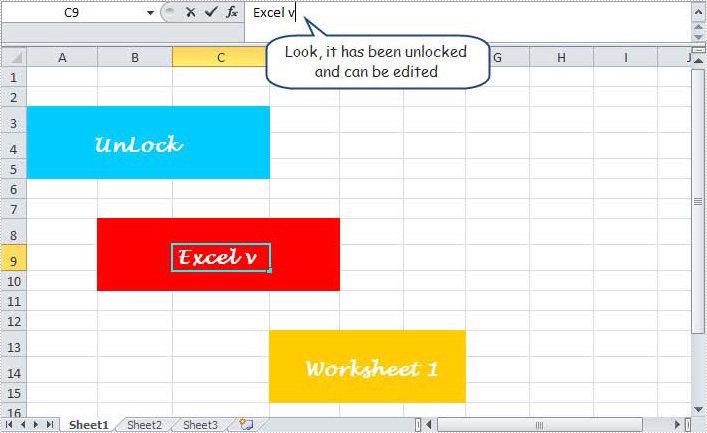
After executing above code, you can see that the protected worksheet in the original Excel file has been unlocked, we can edit it also. Please see following image.
In this section, I have introduced the solution to unlock any sheet in Excel file via Spire.XLS for .NET. I hope it can help you. If you have any questions, feedbacks and advice, you can put them on E-iceblue Forum. We will promise a prompt reply.
By running VBA within the Office applications, developers/programmers can build customized solutions and programs to enhance the capabilities of those applications. The VBA function of Excel is very powerful. Below I will show you how to use VBA by Spire.XLS.
VBA is the acronym for VB.NET for Applications. It is an implementation of Microsoft's event-driven programming language VB.NET 6 and its associated integrated development environment (IDE), which are built into most Microsoft Office applications. VBA is closely related to VB.NET and uses the VB.NET Runtime Library, but can normally only run code within a host application rather than as a standalone program. It can be used to control one application from another via OLE Automation.
Spire.XLS for .NET is a professional Excel .NET component that can be linked into any type of .NET 2.0, 3.5 or 4.0 projects, either ASP.NET web sites or Windows Forms application. Spire.XLS for .NET offers a combination of APIs and GUI controls for speeding up Excel programming in .NET platform-create new Excel documents from scratch, edit existing Excel documents and convert Excel files. At the same time, Spire.XLS supports VBA and it can load/Save Excel VBA.
Here comes to the steps:
- Write a template with VBA program with which you can execute your work in Excel.
- Create another workbook to load the VBA template.
In this demo, it generates a new worksheet named "test" with the VBA template we provide.
Please check the codes as below:
using Spire.Xls;

namespace NumberFormat
{
    class Program
    {
        static void Main(string[] args)
        {
            //Create a workbook
            Workbook workbook = new Workbook();

            //Initailize worksheet
            workbook.LoadFromFile("VBASample.xls");
            Worksheet sheet = workbook.Worksheets[0];

            //VBA function
            sheet.Range["A1"].Text = "test";

            //Save the file
            workbook.SaveToFile("Sample.xls",ExcelVersion.Version97to2003);

            //Launch the file
            System.Diagnostics.Process.Start("Sample.xls");
        }
    }
}
Imports Spire.Xls

Module Module1

    Sub Main()
        'Create a workbook
        Dim workbook As New Workbook()

        'Initailize worksheet
        workbook.LoadFromFile("VBASample.xls")
        Dim sheet As Worksheet = workbook.Worksheets(0)

        'VBA function
        sheet.Range("A1").Text = "test"

        'Save doc file.
        workbook.SaveToFile("Sample.xls",ExcelVersion.Version97to2003)

        'Launching the MS Word file.
        System.Diagnostics.Process.Start("Sample.xls")
    End Sub
End Module
Convert Excel to DataTable in C#: Worksheets, Ranges & Beyond
2024-11-14 03:59:00 Written by hayes Liu
Working with Excel data is a common requirement in .NET development. Developers often need to convert Excel files into a DataTable, which provides a structured way to manipulate data, perform LINQ queries, bind to UI controls, or import into a database.
Although this task is common, the implementation details are not always straightforward. Converting Excel data into a DataTable in C# can be achieved in several ways, but traditional approaches often depend on OLEDB drivers or involve lengthy OpenXML programming, both of which add unnecessary complexity and external dependencies. In this guide, we’ll use Spire.XLS for .NET to simplify the process of importing Excel data into a DataTable with C# code. The library provides built-in methods to load Excel files, export worksheets or specific ranges, and work with the data directly in a DataTable.
Quick Navigation
- What is a DataTable and Why Use It?
- Preparing the Environment
- Converting Excel to DataTable in C#
- Bonus: Exporting DataTable Back to Excel
- Handling Large Excel Files and Performance Tips
- Best Practices
- Conclusion
- FAQ
What is a DataTable and Why Use It?
A DataTable in C# is a memory-resident representation of structured data. It allows developers to:
- Store Excel data in tabular form.
- Perform filtering, sorting, and LINQ queries.
- Bind to UI components like DataGridView.
- Bulk insert into relational databases.
Compared with DataSet, a DataTable is lightweight and especially well-suited for working with a single worksheet or range of data.
Preparing the Environment
Before starting, install Spire.XLS for .NET in your project. The easiest way is through NuGet:
Install-Package Spire.XLS
Then, import the required namespaces in your C# code:
using Spire.Xls;
using System.Data;
Converting Excel to DataTable in C#
The following sections demonstrate how to load an Excel file and convert its contents into a DataTable using Spire.XLS. Unlike older methods that depend on OLEDB, this library works without Microsoft Office installation, making it reliable for both desktop and server-side applications.
Load an Excel File
Workbook workbook = new Workbook();
workbook.LoadFromFile("Sample.xlsx");
This creates a Workbook object from the specified Excel file, which you can then use to access individual worksheets.
Convert a Worksheet to DataTable
Worksheet sheet = workbook.Worksheets[0];
DataTable dataTable = sheet.ExportDataTable(sheet.AllocatedRange, true);
Here, the entire first worksheet is exported to a DataTable.
- sheet.AllocatedRange retrieves the used range of the worksheet.
- The true parameter means the first row will be treated as column headers.
This approach is useful when you want to import all data from a sheet directly into a DataTable, for example when binding to a DataGridView or performing bulk inserts into a database.
Convert a Specific Range to DataTable
DataTable partialTable = sheet.ExportDataTable(sheet.Range["A1:C10"], true);
This snippet converts only the range A1:C10 into a DataTable. It’s a practical choice when dealing with large Excel files, where only part of the sheet is needed for processing, or when extracting a specific report section.
Complete Example: Excel Worksheet to DataTable with C#
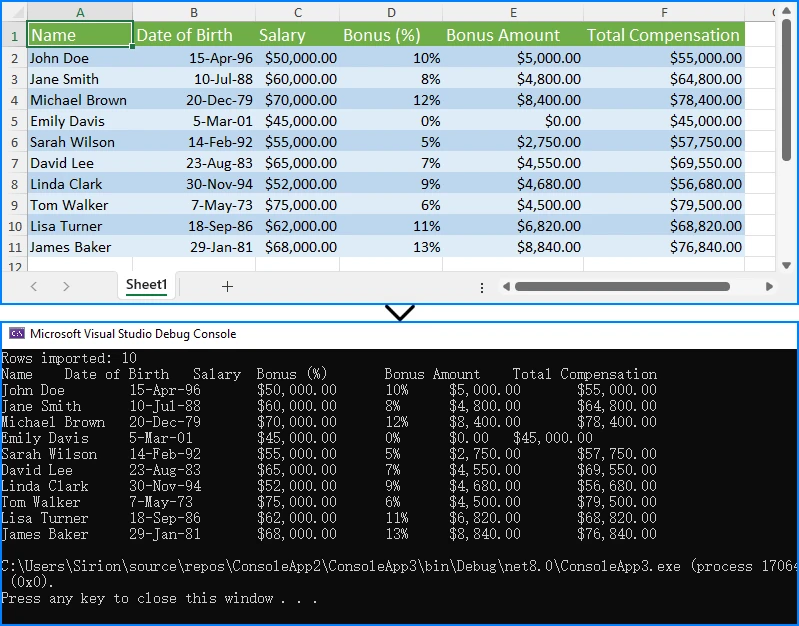
The following example demonstrates the entire workflow of loading an Excel file and converting it into a DataTable. After running this code, you can process the table further, such as querying, filtering, or inserting into a database.
using Spire.Xls;
using System.Data;

class Program
{
    static void Main()
    {
        // Load Excel file
        Workbook workbook = new Workbook();
        workbook.LoadFromFile("Sample.xlsx");

        // Convert first worksheet to DataTable
        Worksheet sheet = workbook.Worksheets[0];
        DataTable dataTable = sheet.ExportDataTable(sheet.AllocatedRange, true);

        // Print row count
        Console.WriteLine("Rows imported: " + dataTable.Rows.Count);

        // Print column names
        foreach (DataColumn col in dataTable.Columns)
        {
            Console.Write(col.ColumnName + "\t");
        }
        Console.WriteLine();

        // Print all rows
        foreach (DataRow row in dataTable.Rows)
        {
            foreach (var item in row.ItemArray)
            {
                Console.Write(item + "\t");
            }
            Console.WriteLine();
        }
    }
}
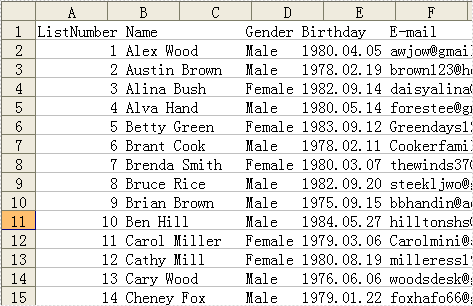
This code loads the first worksheet from an Excel file, exports its content into a DataTable, and prints the table to the console. The following screenshot shows an example of the output:
For scenarios where you need to read Excel data cell by cell, see our guide on reading Excel files in C#.
Bonus: Exporting DataTable Back to Excel in C#
In some cases, you may also need to write modified data from a DataTable back to Excel. This can be done easily:
Workbook wb = new Workbook();
Worksheet ws = wb.Worksheets[0];

// Assume dataTable is already populated
ws.InsertDataTable(dataTable, true, 1, 1);

wb.SaveToFile("Output.xlsx", ExcelVersion.Version2016);
This code inserts the DataTable starting at cell A1 and saves the file. It demonstrates the reverse workflow, ensuring smooth two-way data exchange between Excel and C#. For more details, you can check How to Export DataTable into Excel in C#.
Handling Large Excel Files and Performance Tips
When working with large Excel files, performance optimization is key. Here are a few best practices:
- Read only the required worksheets instead of loading all.
- Export specific ranges rather than entire sheets if possible.
- Use stream-based methods (LoadFromStream) to avoid file locks.
- Minimize memory usage by processing rows iteratively when handling very large DataTables.
Spire.XLS supports .xls, .xlsx, and .csv formats consistently, making it suitable across different scenarios.
Best Practices
When converting Excel to DataTable, keep in mind:
- Data type handling: Excel stores values as text by default. Convert them to int, decimal, or DateTime as needed.
- Null or empty cells: Always check for missing values to prevent runtime errors.
- Database integration: Before bulk inserting into SQL Server or another database, validate and sanitize the DataTable.
Conclusion
Converting Excel data into a DataTable is a common but critical task in .NET development. With Spire.XLS for .NET, you can achieve this efficiently without relying on OLEDB drivers or complex OpenXML parsing.
Whether you need to convert an entire worksheet, extract a specific range, or write data back to Excel, the process remains straightforward and reliable. Mastering this workflow ensures smoother integration between Excel data and your C# applications.
If you want to unlock the full feature set of Spire.XLS, you can apply for a free temporary license. For smaller projects, you can also use Free Spire.XLS for .NET.
FAQ
Q: How do I import data from Excel to DataTable in C#?
Use Worksheet.ExportDataTable() to directly convert worksheet data into a DataTable.
Q: Can I read Excel into DataTable without OLEDB?
Yes. Spire.XLS does not require OLEDB or Microsoft Office installation.
Q: How to read only a specific worksheet or range into a DataTable?
Pass the target Worksheet or Range to ExportDataTable().
Q: Can I export a DataTable back to Excel in C#?
Yes. Use Worksheet.InsertDataTable() and then save the file with SaveToFile().
The sample demonstrates how to convert Excel workbook to PDF file via Spire.XLS.
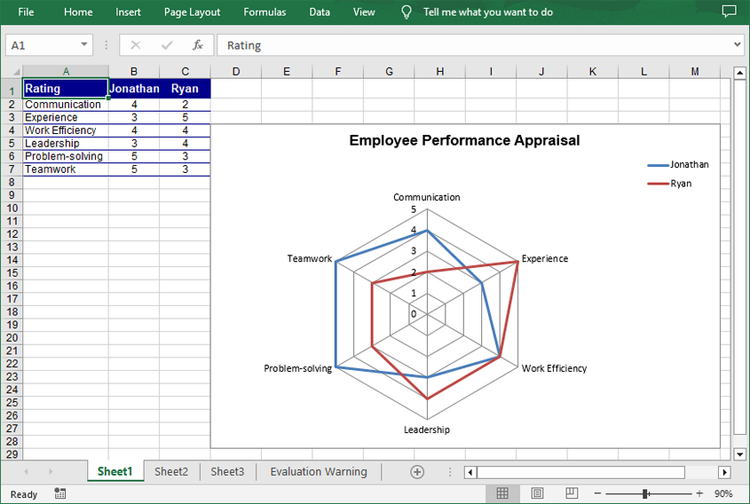
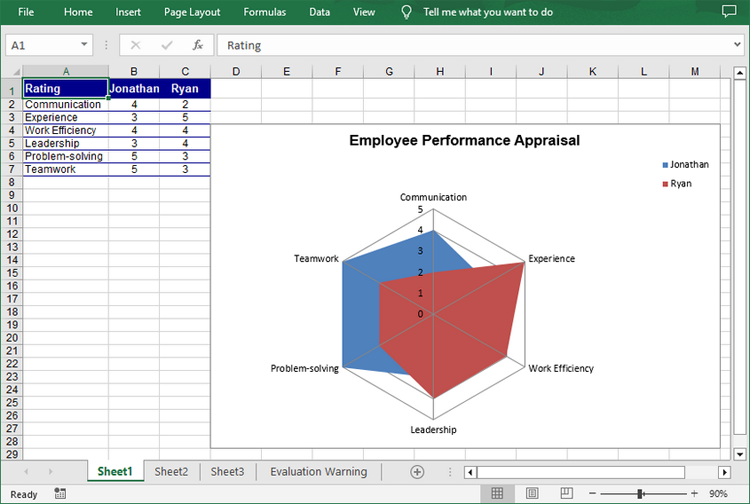
Excel radar charts, also known as spider charts or web charts, are used to compare multiple data series in different categories. By plotting data points on a multi-axis chart, radar charts provide a clear and intuitive representation of data balance and skewness. This makes them particularly useful for visualizing performance metrics, market analysis, and other situations where multiple dimensions need to be compared. In this article, you will learn how to create a radar chart in Excel in C# using Spire.XLS for .NET.
Install Spire.XLS for .NET
To begin with, you need to add the DLL files included in the Spire.XLS for .NET package as references in your .NET project. The DLL files can be either downloaded from this link or installed via NuGet.
PM> Install-Package Spire.XLS
Create a Simple Radar Chart in Excel in C#
Spire.XLS for .NET provides the Worksheet.Charts.Add(ExcelChartType.Radar) method to add a standard radar chart to an Excel worksheet. The following are the detailed steps:
- Create a Workbook instance.
- Get a specified worksheet using Workbook.Worksheets[sheetIndex] property.
- Add the chart data to specified cells and set the cell styles.
- Add a simple radar chart to the worksheet using Worksheet.Charts.Add(ExcelChartType.Radar) method.
- Set data range for the chart using Chart.DataRange property.
- Set the position, legend and title of the chart.
- Save the result file using Workbook.SaveToFile() method.
- C#
using Spire.Xls;
using System.Drawing;

namespace ExcelRadarChart
{
    class Program
    {
        static void Main(string[] args)
        {
            //Create a Workbook instance
            Workbook workbook = new Workbook();

            //Get the first worksheet
            Worksheet sheet = workbook.Worksheets[0];

            //Add chart data to specified cells
            sheet.Range["A1"].Value = "Rating";
            sheet.Range["A2"].Value = "Communication";
            sheet.Range["A3"].Value = "Experience";
            sheet.Range["A4"].Value = "Work Efficiency";
            sheet.Range["A5"].Value = "Leadership";
            sheet.Range["A6"].Value = "Problem-solving";
            sheet.Range["A7"].Value = "Teamwork";

            sheet.Range["B1"].Value = "Jonathan";
            sheet.Range["B2"].NumberValue = 4;
            sheet.Range["B3"].NumberValue = 3;
            sheet.Range["B4"].NumberValue = 4;
            sheet.Range["B5"].NumberValue = 3;
            sheet.Range["B6"].NumberValue = 5;
            sheet.Range["B7"].NumberValue = 5;

            sheet.Range["C1"].Value = "Ryan";
            sheet.Range["C2"].NumberValue = 2;
            sheet.Range["C3"].NumberValue = 5;
            sheet.Range["C4"].NumberValue = 4;
            sheet.Range["C5"].NumberValue = 4;
            sheet.Range["C6"].NumberValue = 3;
            sheet.Range["C7"].NumberValue = 3;

            //Set font styles
            sheet.Range["A1:C1"].Style.Font.IsBold = true;
            sheet.Range["A1:C1"].Style.Font.Size = 11;
            sheet.Range["A1:C1"].Style.Font.Color = Color.White;

            //Set row height and column width
            sheet.Rows[0].RowHeight = 20;
            sheet.Range["A1:C7"].Columns[0].ColumnWidth = 15;

            //Set cell styles
            sheet.Range["A1:C1"].Style.Color = Color.DarkBlue;
            sheet.Range["A2:C7"].Borders[BordersLineType.EdgeBottom].LineStyle = LineStyleType.Thin;
            sheet.Range["A2:C7"].Style.Borders[BordersLineType.EdgeBottom].Color = Color.DarkBlue;
            sheet.Range["B1:C7"].HorizontalAlignment = HorizontalAlignType.Center;
            sheet.Range["A1:C7"].VerticalAlignment = VerticalAlignType.Center;

            //Add a radar chart to the worksheet
            Chart chart = sheet.Charts.Add(ExcelChartType.Radar);

            //Set position of chart
            chart.LeftColumn = 4;
            chart.TopRow = 4;
            chart.RightColumn = 14;
            chart.BottomRow = 29;

            //Set data range for the chart
            chart.DataRange = sheet.Range["A1:C7"];
            chart.SeriesDataFromRange = false;

            //Set and format chart title
            chart.ChartTitle = "Employee Performance Appraisal";
            chart.ChartTitleArea.IsBold = true;
            chart.ChartTitleArea.Size = 14;

            //Set position of chart legend
            chart.Legend.Position = LegendPositionType.Corner;

            //Save the result file
            workbook.SaveToFile("ExcelRadarChart.xlsx", ExcelVersion.Version2016);

        }
    }
}
Create a Filled Radar Chart in Excel in C#
A filled radar chart is a variation of a standard radar chart, with the difference that the area between each data point is filled with color. The following are the steps to create a filled radar chart using C#:
- Create a Workbook instance.
- Get a specified worksheet using Workbook.Worksheets[sheetIndex] property.
- Add the chart data to specified cells and set the cell styles.
- Add a filled radar chart to the worksheet using Worksheet.Charts.Add(ExcelChartType.RadarFilled) method.
- Set data range for the chart using Chart.DataRange property.
- Set the position, legend and title of the chart.
- Save the result file using Workbook.SaveToFile() method.
- C#
using Spire.Xls;
using System.Drawing;

namespace ExcelRadarChart
{
    class Program
    {
        static void Main(string[] args)
        {
            //Create a Workbook instance
            Workbook workbook = new Workbook();

            //Get the first worksheet
            Worksheet sheet = workbook.Worksheets[0];

            //Add chart data to specified cells
            sheet.Range["A1"].Value = "Rating";
            sheet.Range["A2"].Value = "Communication";
            sheet.Range["A3"].Value = "Experience";
            sheet.Range["A4"].Value = "Work Efficiency";
            sheet.Range["A5"].Value = "Leadership";
            sheet.Range["A6"].Value = "Problem-solving";
            sheet.Range["A7"].Value = "Teamwork";

            sheet.Range["B1"].Value = "Jonathan";
            sheet.Range["B2"].NumberValue = 4;
            sheet.Range["B3"].NumberValue = 3;
            sheet.Range["B4"].NumberValue = 4;
            sheet.Range["B5"].NumberValue = 3;
            sheet.Range["B6"].NumberValue = 5;
            sheet.Range["B7"].NumberValue = 5;

            sheet.Range["C1"].Value = "Ryan";
            sheet.Range["C2"].NumberValue = 2;
            sheet.Range["C3"].NumberValue = 5;
            sheet.Range["C4"].NumberValue = 4;
            sheet.Range["C5"].NumberValue = 4;
            sheet.Range["C6"].NumberValue = 3;
            sheet.Range["C7"].NumberValue = 3;

            //Set font styles
            sheet.Range["A1:C1"].Style.Font.IsBold = true;
            sheet.Range["A1:C1"].Style.Font.Size = 11;
            sheet.Range["A1:C1"].Style.Font.Color = Color.White;

            //Set row height and column width
            sheet.Rows[0].RowHeight = 20;
            sheet.Range["A1:C7"].Columns[0].ColumnWidth = 15;

            //Set cell styles
            sheet.Range["A1:C1"].Style.Color = Color.DarkBlue;
            sheet.Range["A2:C7"].Borders[BordersLineType.EdgeBottom].LineStyle = LineStyleType.Thin;
            sheet.Range["A2:C7"].Style.Borders[BordersLineType.EdgeBottom].Color = Color.DarkBlue;
            sheet.Range["B1:C7"].HorizontalAlignment = HorizontalAlignType.Center;
            sheet.Range["A1:C7"].VerticalAlignment = VerticalAlignType.Center;

            //Add a filled radar chart to the worksheet
            Chart chart = sheet.Charts.Add(ExcelChartType.RadarFilled);

            //Set position of chart
            chart.LeftColumn = 4;
            chart.TopRow = 4;
            chart.RightColumn = 14;
            chart.BottomRow = 29;

            //Set data range for the chart
            chart.DataRange = sheet.Range["A1:C7"];
            chart.SeriesDataFromRange = false;

            //Set and format chart title
            chart.ChartTitle = "Employee Performance Appraisal";
            chart.ChartTitleArea.IsBold = true;
            chart.ChartTitleArea.Size = 14;

            //Set position of chart legend
            chart.Legend.Position = LegendPositionType.Corner;

            //Save the result file
            workbook.SaveToFile("FilledRadarChart.xlsx", ExcelVersion.Version2016);

        }
    }
}
Apply for a Temporary License
If you'd like to remove the evaluation message from the generated documents, or to get rid of the function limitations, please request a 30-day trial license for yourself.
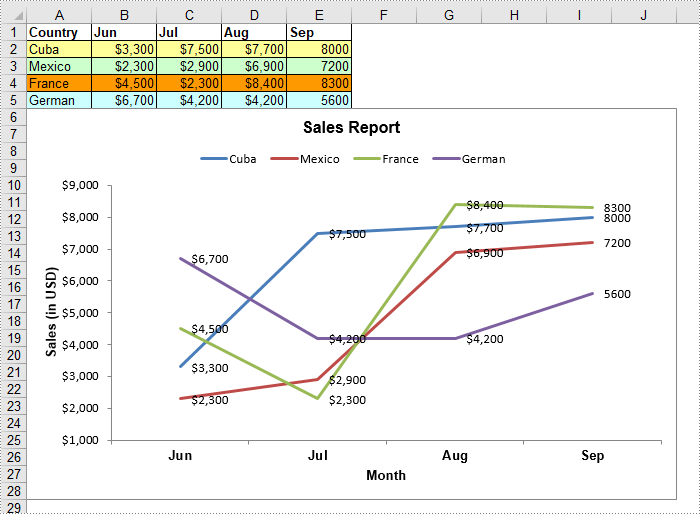
A line chart, also known as a line graph, is a type of chart that displays information as a series of data points connected by straight line segments. It is generally used to show the changes of information over a period of time, such as years, months or days. In this article, you will learn how to create a line chart in Excel in C# and VB.NET using Spire.XLS for .NET.
Install Spire.XLS for .NET
To begin with, you need to add the DLL files included in the Spire.XLS for .NET package as references in your .NET project. The DLL files can be either downloaded from this link or installed via NuGet.
PM> Install-Package Spire.XLS
Create a Line Chart in Excel using C# and VB.NET
The following are the main steps to create a line chart:
- Create an instance of Workbook class.
- Get the first worksheet by its index (zero-based) though Workbook.Worksheets[sheetIndex] property.
- Add some data to the worksheet.
- Add a line chart to the worksheet using Worksheet.Charts.Add(ExcelChartType.Line) method.
- Set data range for the chart through Chart.DataRange property.
- Set position, title, category axis title and value axis title for the chart.
- Loop through the data series of the chart, show data labels for the data points of each data series by setting the ChartSerie.DataPoints.DefaultDataPoint.DataLabels.HasValue property as true.
- Set the position of chart legend through Chart.Legend.Position property.
- Save the result file using Workbook.SaveToFile() method.
- C#
- VB.NET
using Spire.Xls;
using Spire.Xls.Charts;
using System.Drawing;

namespace CreateLineChart
{
    class Program
    {
        static void Main(string[] args)
        {
            //Create a Workbook instance
            Workbook workbook = new Workbook();

            //Get the first worksheet
            Worksheet sheet = workbook.Worksheets[0];
            //Set sheet name
            sheet.Name = "Line Chart";
            //Hide gridlines
            sheet.GridLinesVisible = false;

            //Add some data to the the worksheet
            sheet.Range["A1"].Value = "Country";
            sheet.Range["A2"].Value = "Cuba";
            sheet.Range["A3"].Value = "Mexico";
            sheet.Range["A4"].Value = "France";
            sheet.Range["A5"].Value = "German";

            sheet.Range["B1"].Value = "Jun";
            sheet.Range["B2"].NumberValue = 3300;
            sheet.Range["B3"].NumberValue = 2300;
            sheet.Range["B4"].NumberValue = 4500;
            sheet.Range["B5"].NumberValue = 6700;

            sheet.Range["C1"].Value = "Jul";
            sheet.Range["C2"].NumberValue = 7500;
            sheet.Range["C3"].NumberValue = 2900;
            sheet.Range["C4"].NumberValue = 2300;
            sheet.Range["C5"].NumberValue = 4200;

            sheet.Range["D1"].Value = "Aug";
            sheet.Range["D2"].NumberValue = 7700;
            sheet.Range["D3"].NumberValue = 6900;
            sheet.Range["D4"].NumberValue = 8400;
            sheet.Range["D5"].NumberValue = 4200;

            sheet.Range["E1"].Value = "Sep";
            sheet.Range["E2"].NumberValue = 8000;
            sheet.Range["E3"].NumberValue = 7200;
            sheet.Range["E4"].NumberValue = 8300;
            sheet.Range["E5"].NumberValue = 5600;

            //Set font and fill color for specified cells
            sheet.Range["A1:E1"].Style.Font.IsBold = true;
            sheet.Range["A2:E2"].Style.KnownColor = ExcelColors.LightYellow;
            sheet.Range["A3:E3"].Style.KnownColor = ExcelColors.LightGreen1;
            sheet.Range["A4:E4"].Style.KnownColor = ExcelColors.LightOrange;
            sheet.Range["A5:E5"].Style.KnownColor = ExcelColors.LightTurquoise;

            //Set cell borders
            sheet.Range["A1:E5"].Style.Borders[BordersLineType.EdgeTop].Color = Color.FromArgb(0, 0, 128);
            sheet.Range["A1:E5"].Style.Borders[BordersLineType.EdgeTop].LineStyle = LineStyleType.Thin;
            sheet.Range["A1:E5"].Style.Borders[BordersLineType.EdgeBottom].Color = Color.FromArgb(0, 0, 128);
            sheet.Range["A1:E5"].Style.Borders[BordersLineType.EdgeBottom].LineStyle = LineStyleType.Thin;
            sheet.Range["A1:E5"].Style.Borders[BordersLineType.EdgeLeft].Color = Color.FromArgb(0, 0, 128);
            sheet.Range["A1:E5"].Style.Borders[BordersLineType.EdgeLeft].LineStyle = LineStyleType.Thin;
            sheet.Range["A1:E5"].Style.Borders[BordersLineType.EdgeRight].Color = Color.FromArgb(0, 0, 128);
            sheet.Range["A1:E5"].Style.Borders[BordersLineType.EdgeRight].LineStyle = LineStyleType.Thin;

            //Set number format
            sheet.Range["B2:D5"].Style.NumberFormat = "\"$\"#,##0";

            //Add a line chart to the worksheet
            Chart chart = sheet.Charts.Add(ExcelChartType.Line);

            //Set data range for the chart
            chart.DataRange = sheet.Range["A1:E5"];

            //Set position of the chart
            chart.LeftColumn = 1;
            chart.TopRow = 6;
            chart.RightColumn = 11;
            chart.BottomRow = 29;

            //Set and format chart title
            chart.ChartTitle = "Sales Report";
            chart.ChartTitleArea.IsBold = true;
            chart.ChartTitleArea.Size = 12;

            //Set and format category axis title
            chart.PrimaryCategoryAxis.Title = "Month";
            chart.PrimaryCategoryAxis.Font.IsBold = true;
            chart.PrimaryCategoryAxis.TitleArea.IsBold = true;

            //Set and format value axis title
            chart.PrimaryValueAxis.Title = "Sales (in USD)";
            chart.PrimaryValueAxis.HasMajorGridLines = false;
            chart.PrimaryValueAxis.TitleArea.TextRotationAngle = -90;
            chart.PrimaryValueAxis.MinValue = 1000;
            chart.PrimaryValueAxis.TitleArea.IsBold = true;

            //Loop through the data series of the chart
            foreach (ChartSerie cs in chart.Series)
            {
                cs.Format.Options.IsVaryColor = true;
                //Show data labels for data points
                cs.DataPoints.DefaultDataPoint.DataLabels.HasValue = true;
            }

            //Set position of chart legend
            chart.Legend.Position = LegendPositionType.Top;

            //Save the result file
            workbook.SaveToFile("LineChart.xlsx", ExcelVersion.Version2016);
        }
    }
}
Apply for a Temporary License
If you'd like to remove the evaluation message from the generated documents, or to get rid of the function limitations, please request a 30-day trial license for yourself.
Why Export Datatable to RTF?
RTF is a Microsoft specification and certified file format used with DOC and DOCX. It is a core part of the Microsoft Office system. RTF usually used for cut and paste, including paste special and used when opening documents into Word. RTF does not cause document corruption.
RTF allows Workshare tremendous flexibility in successfully translating between any number of document types because of its ubiquity. Workshare products can not only maintain document fidelity, but provide portability advantages when moving around different Microsoft Word systems, or translating to other document types.
How to Export DataTable to RTF through DataGridView?
Download Spire.DataExport (or Spire.Office) with .NET Framework together. Only 2 Simple steps you can finish the whole datatable to RTF exporting process.
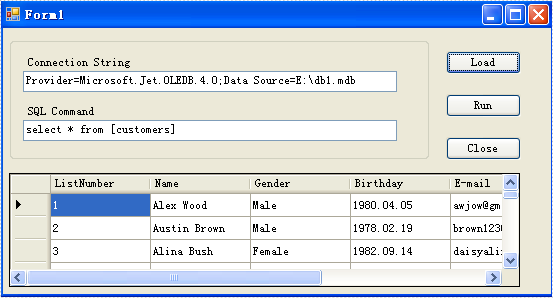
Step 1: Load Data Information
Before exporting data from DataTable, we should load data information from data source. And select which information we need export. Through DataGridVew, we even can preview and modify data information. So, in this step, our job is to prepare data which is about to be exported out.
        private void btnLoad_Click(object sender, EventArgs e)
        {
            oleDbConnection.ConnectionString = this.textBox1.Text;
            OleDbCommand oleDbCommand = new OleDbCommand();
            oleDbCommand.CommandText = this.textBox2.Text;
            oleDbCommand.Connection = oleDbConnection;
            using (OleDbDataAdapter da = new OleDbDataAdapter(oleDbCommand))
            {
                DataTable dt = new DataTable();
                da.Fill(dt);
                dataGridView1.DataSource = dt;
            }
        }
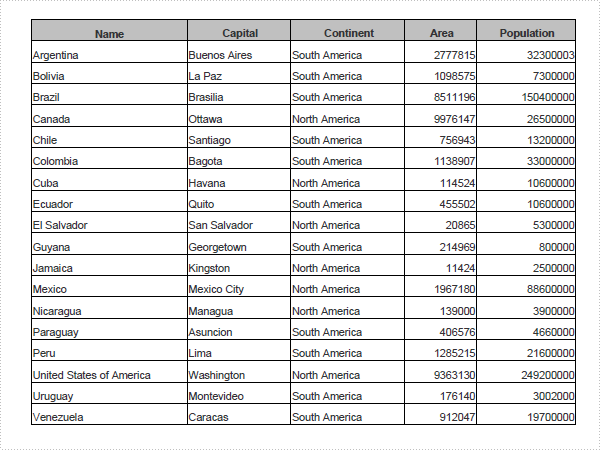
Effect Screenshot
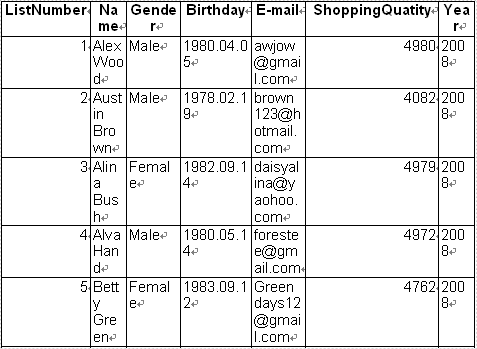
Step 2: Set Export into RTF
Spire.DataExport allows user to export data into most popular file formats including MS Excel, RTF, HTML, PDF, XML, CSV, DBF, DIF, etc. Here we need set it as RTF format. Spire.DataExport will create a new RTF file and through DataGridView export data into RTF file. You also can rename the file as you like.
        private void btnRun_Click(object sender, EventArgs e)
        {
            Spire.DataExport.RTF.RTFExport RTFExport = new Spire.DataExport.RTF.RTFExport();
            RTFExport.DataSource = Spire.DataExport.Common.ExportSource.DataTable;
            RTFExport.DataTable = this.dataGridView1.DataSource as DataTable;
            RTFExport.ActionAfterExport = Spire.DataExport.Common.ActionType.OpenView;
            RTFExport.FileName = "RTF0722.rtf";
            RTFExport.SaveToFile();
        }
Effect Screenshot
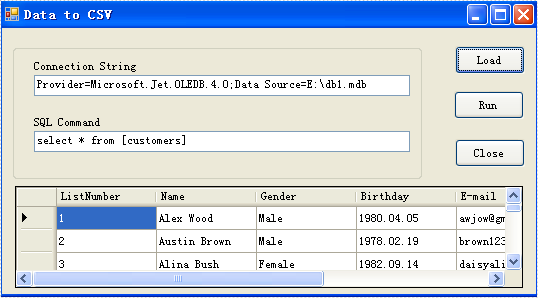
When we export data out from Database we may have requirements of exporting data from Datatable to CSV because CSV is a simple file format that is widely supported. CSV (The comma-separated values) file format is a set of file formats used to store tabular data in which numbers and text are stored in plain textual form that can be read in a text editor. Lines in the text file represent rows of a table, and commas in a line separate what are fields in the table row.
Here we mainly discuss how to Export Datatable to CSV with Spire.DataExport for .NET.
Download Spire.DataExport (or Spire.Office) with .NET Framework together. Only 2 Simple steps you can finish the whole datatable to CSV exporting process.
Step 1: Load Data Information
Before exporting data from DataTable, we should load data information from data source. And select which information we need export. Through DataGridVew, we even can preview and modify data information. So, in this step, our job is to prepare data which is about to be exported out.
private void btnLoad_Click(object sender, EventArgs e)
{
  using (OleDbConnection oleDbConnection = new OleDbConnection())
  {
    oleDbConnection.ConnectionString = this.textBox1.Text;
    OleDbCommand oleDbCommand = new OleDbCommand();
    oleDbCommand.CommandText = this.textBox2.Text;
    oleDbCommand.Connection = oleDbConnection;
    using (OleDbDataAdapter da = new OleDbDataAdapter(oleDbCommand))
      {
      DataTable dt = new DataTable();
      da.Fill(dt);
       dataGridView1.DataSource = dt;
      }
  }
}
Effect Screenshot
Step 2: Set Export into CSV
Spire.DataExport allows user to export data into most popular file formats including MS Excel, MS Word, HTML, PDF, XML, CSV, DBF, DIF, etc. Here we need set it as CSV format. Spire.DataExport will create a new CSV file and through DataGridView export data into CSV file. You also can rename the file as you like.
private void btnRUN_Click(object sender, EventArgs e)
{
  TXTExport CSVExport = new TXTExport();
  CSVExport.DataSource = Spire.DataExport.Common.ExportSource.DataTable;
  CSVExport.DataTable = this.dataGridView1.DataSource as DataTable;
  CSVExport.ActionAfterExport = Spire.DataExport.Common.ActionType.OpenView;
  CSVExport.FileName = "CSV0721.csv";
  CSVExport.SaveToFile();
}
Effect Screenshot