Insert Lines in Excel using JavaScript in React
When creating flowcharts, relationship diagrams, or data annotations, inserting lines into an Excel worksheet is a common requirement. Spire.XLS for JavaScript provides rich line APIs for creating various line types (straight lines, curved lines, elbow connectors, etc.) and arrow-tipped connectors. All operations are performed directly in the browser based on WebAssembly, with no backend service required.
This article covers two core features:
For installation and project configuration, refer to Integrating Spire.XLS for JavaScript in a React Project. The examples below assume Spire.XLS is installed and the WebAssembly module is initialized.
Insert Different Types of Lines
The sheet.Lines.AddLine() method inserts line shapes at a specified position. Using the LineShapeType enum, you can create various line types: straight lines (Line), curved lines (CurveLine), elbow connectors (ElbowLine), and inverted lines (LineInv). The appearance of lines can be customized through properties such as DashStyle (dash style), Color (color), and Weight (thickness).
The main steps are as follows:
- Create a
Workbookobject and get the first worksheet. - Call the
Worksheet.Lines.AddLine()method, passing position parameters andLineShapeTypeto specify the line type. - Customize line appearance through the
DashStyle,Color,Weight, andEndArrowHeadStyleproperties. - Save the workbook with the
Workbook.SaveToFile()method.
Here is a complete code example showing how to insert four different types of lines into Excel in React:
function App() {
  const addLineShapes = async () => {
    // Get the Spire.XLS WASM module
    const xlsModule = window.wasmModule?.spirexls;

    // Check whether the module is ready
    if (!xlsModule) {
      alert('Spire.Xls is not ready yet');
      return;
    }

    // Load the font into the VFS for text measurement and column auto-fit
    await window.spire.FetchFileToVFS('ARIAL.TTF', '/Library/Fonts/', `${process.env.PUBLIC_URL}/font/`);

    // Create a new workbook and get the first worksheet
    const workbook = new xlsModule.Workbook();
    const sheet = workbook.Worksheets.get(0);

    // Add a straight line - solid, CadetBlue, weight 2, with arrow
    let line1 = sheet.Lines.AddLine({ row: 10, column: 2, width: 200, height: 1, lineShapeType: xlsModule.LineShapeType.Line });
    line1.DashStyle = xlsModule.ShapeDashLineStyleType.Solid;
    line1.Color = xlsModule.Color.get_CadetBlue();
    line1.Weight = 2;
    line1.EndArrowHeadStyle = xlsModule.ShapeArrowStyleType.LineArrow;

    // Add a curved line - dotted, OrangeRed, weight 2
    let line2 = sheet.Lines.AddLine({ row: 12, column: 2, width: 200, height: 1, lineShapeType: xlsModule.LineShapeType.CurveLine });
    line2.DashStyle = xlsModule.ShapeDashLineStyleType.Dotted;
    line2.Color = xlsModule.Color.get_OrangeRed();
    line2.Weight = 2;

    // Add an elbow connector - DashDotDot, Purple, weight 2
    let line3 = sheet.Lines.AddLine({ row: 14, column: 2, width: 200, height: 1, lineShapeType: xlsModule.LineShapeType.ElbowLine });
    line3.DashStyle = xlsModule.ShapeDashLineStyleType.DashDotDot;
    line3.Color = xlsModule.Color.get_Purple();
    line3.Weight = 2;

    // Add an inverted line - Dashed, Green, weight 2
    let line4 = sheet.Lines.AddLine({ row: 16, column: 2, width: 200, height: 1, lineShapeType: xlsModule.LineShapeType.LineInv });
    line4.DashStyle = xlsModule.ShapeDashLineStyleType.Dashed;
    line4.Color = xlsModule.Color.get_Green();
    line4.Weight = 2;

    // Save the workbook
    const outputFileName = 'AddLineShapes.xlsx';
    workbook.SaveToFile({ fileName: outputFileName, version: xlsModule.ExcelVersion.Version2010 });

    // Release resources
    workbook.Dispose();

    // Read the saved file from the VFS and trigger the download
    const fileArray = window.dotnetRuntime.Module.FS.readFile(outputFileName);
    const blob = new Blob([fileArray], { type: 'application/vnd.openxmlformats-officedocument.spreadsheetml.sheet' });
    const url = URL.createObjectURL(blob);
    const a = document.createElement('a');
    a.href = url;
    a.download = outputFileName;
    a.click();
    URL.revokeObjectURL(url);
  };

  return (
    <div style={{ textAlign: 'center', height: '300px' }}>
      <h1>Add Line Shapes</h1>
      <button onClick={addLineShapes}>Start</button>
    </div>
  );
}

export default App;
Effect of inserting different line types:

Insert Arrow-Tipped Lines
The sheet.TypedLines.AddLine() method inserts arrow-tipped lines. Unlike Lines.AddLine(), TypedLines supports precise positioning using pixel coordinates or row/column coordinates, and supports setting different arrow head styles on both ends (beginning BeginArrowHeadStyle and end EndArrowHeadStyle).
The main steps are as follows:
- Create a
Workbookobject and get the first worksheet. - Call the
Worksheet.TypedLines.AddLine()method to create a line. - Set line position through the
Top,Left,Width, andHeightproperties (in pixels). - Set arrow styles on both ends through
BeginArrowHeadStyleandEndArrowHeadStyle. - Specify the line type through
LineShapeType(straight, elbow, curved, etc.). - Save the workbook with the
Workbook.SaveToFile()method.
Here is a complete code example showing how to insert six different types of arrow lines into Excel in React:
function App() {
  const addArrowLines = async () => {
    // Get the Spire.XLS WASM module
    const xlsModule = window.wasmModule?.spirexls;

    // Check whether the module is ready
    if (!xlsModule) {
      alert('Spire.Xls is not ready yet');
      return;
    }

    // Load the font into the VFS for text measurement and column auto-fit
    await window.spire.FetchFileToVFS('ARIAL.TTF', '/Library/Fonts/', `${process.env.PUBLIC_URL}/font/`);

    // Create a new workbook and get the first worksheet
    const workbook = new xlsModule.Workbook();
    const sheet = workbook.Worksheets.get(0);

    // Add a double-arrow line - solid blue
    let line = sheet.TypedLines.AddLine();
    line.Top = 10;
    line.Left = 20;
    line.Width = 100;
    line.Height = 0;
    line.Color = xlsModule.Color.get_Blue();
    line.BeginArrowHeadStyle = xlsModule.ShapeArrowStyleType.LineArrow;
    line.EndArrowHeadStyle = xlsModule.ShapeArrowStyleType.LineArrow;

    // Add a single-arrow line - solid red
    let line_1 = sheet.TypedLines.AddLine();
    line_1.Top = 50;
    line_1.Left = 30;
    line_1.Width = 100;
    line_1.Height = 100;
    line_1.Color = xlsModule.Color.get_Red();
    line_1.BeginArrowHeadStyle = xlsModule.ShapeArrowStyleType.LineNoArrow;
    line_1.EndArrowHeadStyle = xlsModule.ShapeArrowStyleType.LineArrow;

    // Add an elbow arrow connector
    let line3 = sheet.TypedLines.AddLine();
    line3.LineShapeType = xlsModule.LineShapeType.ElbowLine;
    line3.Width = 30;
    line3.Height = 50;
    line3.EndArrowHeadStyle = xlsModule.ShapeArrowStyleType.LineArrow;
    line3.Top = 100;
    line3.Left = 50;

    // Add an elbow double-arrow connector
    let line2 = sheet.TypedLines.AddLine();
    line2.LineShapeType = xlsModule.LineShapeType.ElbowLine;
    line2.Width = 50;
    line2.Height = 50;
    line2.EndArrowHeadStyle = xlsModule.ShapeArrowStyleType.LineArrow;
    line2.BeginArrowHeadStyle = xlsModule.ShapeArrowStyleType.LineArrow;
    line2.Left = 120;
    line2.Top = 100;

    // Add a curved arrow connector
    line3 = sheet.TypedLines.AddLine();
    line3.LineShapeType = xlsModule.LineShapeType.CurveLine;
    line3.Width = 30;
    line3.Height = 50;
    line3.EndArrowHeadStyle = xlsModule.ShapeArrowStyleType.LineArrowOpen;
    line3.Top = 100;
    line3.Left = 200;

    // Add a curved double-arrow connector
    line2 = sheet.TypedLines.AddLine();
    line2.LineShapeType = xlsModule.LineShapeType.CurveLine;
    line2.Width = 30;
    line2.Height = 50;
    line2.EndArrowHeadStyle = xlsModule.ShapeArrowStyleType.LineArrowOpen;
    line2.BeginArrowHeadStyle = xlsModule.ShapeArrowStyleType.LineArrowOpen;
    line2.Left = 250;
    line2.Top = 100;

    // Save the workbook
    const outputFileName = 'AddArrowLines.xlsx';
    workbook.SaveToFile({ fileName: outputFileName, version: xlsModule.ExcelVersion.Version2010 });

    // Release resources
    workbook.Dispose();

    // Read the saved file from the VFS and trigger the download
    const fileArray = window.dotnetRuntime.Module.FS.readFile(outputFileName);
    const blob = new Blob([fileArray], { type: 'application/vnd.openxmlformats-officedocument.spreadsheetml.sheet' });
    const url = URL.createObjectURL(blob);
    const a = document.createElement('a');
    a.href = url;
    a.download = outputFileName;
    a.click();
    URL.revokeObjectURL(url);
  };

  return (
    <div style={{ textAlign: 'center', height: '300px' }}>
      <h1>Add Arrow Lines</h1>
      <button onClick={addArrowLines}>Start</button>
    </div>
  );
}

export default App;
Effect of inserting arrow-tipped lines:

Frequently Asked Questions
How do I retrieve and modify existing lines in a worksheet?
Reason: An Excel file with existing lines was imported, but it's unclear how to read or modify them.
Solution: Traverse the sheet.Shapes collection to retrieve line shape objects, then modify their properties via the ILineShape interface. For example, sheet.Shapes.get(0) gets the first shape, and after confirming it's a line type, you can modify properties like color, dash style, etc.
How do I delete lines from an Excel worksheet?
Reason: Need to remove excess lines that were created or imported.
Solution: Use sheet.Shapes.Remove(index) to delete a line object at a specified index from the shapes collection, or iterate through the Shapes collection to delete them one by one based on name or type conditions.
Get a Free License
Spire.XLS for JavaScript offers a 30-day full-featured free trial license with no functional limitations. Apply here to evaluate before purchasing.
Create Exploded Pie and Doughnut Charts in Excel with JavaScript in React
Pie charts and doughnut charts are the most intuitive chart types for showing the proportion of each data item. An exploded pie chart or exploded doughnut chart pulls all the slices apart, which makes every part stand out more clearly. Spire.XLS for JavaScript completes this directly in the browser based on WebAssembly, managing input/output files through a virtual file system (VFS), with no backend service required.
This article introduces two core features:
For installation and project configuration, refer to Integrating Spire.XLS for JavaScript in a React Project. The examples below assume Spire.XLS is installed and the WebAssembly module is initialized.
Create an Exploded Pie Chart
The slices of an exploded pie chart are separated from each other, which is suitable for highlighting the proportion of each data item. To create an exploded pie chart, follow these steps:
- Create a
Workbookobject and use theLoadFromFile()method to load the Excel file that contains the data. - Use the
Workbook.Worksheets.get()method to get the worksheet that contains the data. - Call the
Charts.Add()method to add a chart and set theChartTypetoExcelChartType.PieExploded. - Use the
Series.CategoryLabelsandSeries.Valuesproperties to specify the categories and values of the chart. - Set properties such as the chart title, position and data labels.
- Use the
Workbook.SaveToFile()method to save the workbook.
Here is a complete code example showing how to create an exploded pie chart from the product sales data in a worksheet in React:
function App() {
  const createExplodedPieChart = async () => {
    // Get the Spire.XLS WASM module
    const xlsModule = window.wasmModule?.spirexls;

    // Check whether the module is ready
    if (!xlsModule) {
      alert('Spire.Xls is not ready yet');
      return;
    }

    // Load the font and Excel file into the VFS
    await window.spire.FetchFileToVFS('ARIAL.TTF', '/Library/Fonts/', `${process.env.PUBLIC_URL}/font/`);
    const inputFileName = 'SalesData.xlsx';
    await window.spire.FetchFileToVFS(inputFileName, '', `${process.env.PUBLIC_URL}data/`);

    // Load the workbook and get the worksheet that contains the data
    const workbook = new xlsModule.Workbook();
    workbook.LoadFromFile({ fileName: inputFileName });
    const sheet = workbook.Worksheets.get(0);

    // Add a chart and set its chart type to an exploded pie chart
    const chart = sheet.Charts.Add();
    chart.ChartType = xlsModule.ExcelChartType.PieExploded;

    // Set the data range and the title of the chart
    chart.DataRange = sheet.Range.get("B2:B7");
    chart.SeriesDataFromRange = false;
    chart.ChartTitle = "Product Sales Share";
    chart.ChartTitleArea.IsBold = true;
    chart.ChartTitleArea.Size = 12;

    // Set the category labels and the values of the chart, and show the value labels
    const cs = chart.Series.get(0);
    cs.CategoryLabels = sheet.Range.get("A2:A7");
    cs.Values = sheet.Range.get("B2:B7");
    cs.DataPoints.DefaultDataPoint.DataLabels.HasValue = true;

    // Set the position of the chart
    chart.LeftColumn = 4;
    chart.TopRow = 1;
    chart.RightColumn = 15;
    chart.BottomRow = 25;

    // Hide the background of the plot area and set the position of the legend
    chart.PlotArea.Fill.Visible = false;
    chart.Legend.Position = xlsModule.LegendPositionType.Right;

    // Save the document
    const outputFileName = 'ExplodedPieChart_output.xlsx';
    workbook.SaveToFile({ fileName: outputFileName });

    // Release resources
    workbook.Dispose();

    // Read the converted file from the VFS and trigger a download
    const fileArray = window.dotnetRuntime.Module.FS.readFile(outputFileName);
    const blob = new Blob([fileArray], { type: 'application/vnd.openxmlformats-officedocument.spreadsheetml.sheet' });
    const url = URL.createObjectURL(blob);
    const a = document.createElement('a');
    a.href = url;
    a.download = outputFileName;
    a.click();
    URL.revokeObjectURL(url);
  };

  return (
    <div style={{ textAlign: 'center', height: '300px' }}>
      <h1>Create Exploded Pie Chart</h1>
      <button onClick={createExplodedPieChart}>
        Start
      </button>
    </div>
  );
}

export default App;
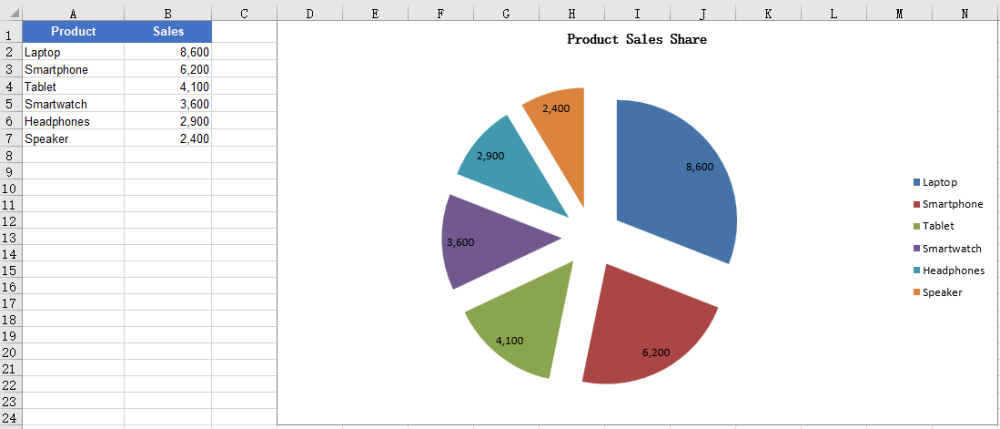
After running the code, you can see the effect of the exploded pie chart:
Create an Exploded Doughnut Chart
A doughnut chart is similar to a pie chart, but it has a hole in the center and can also show the proportion of each part in the whole. An exploded doughnut chart further pulls the slices apart. To create an exploded doughnut chart, follow these steps:
- Create a
Workbookobject and use theLoadFromFile()method to load the Excel file that contains the data. - Use the
Workbook.Worksheets.get()method to get the worksheet that contains the data. - Call the
Charts.Add()method to add a chart and set theChartTypetoExcelChartType.DoughnutExploded. - Use the
Series.CategoryLabelsandSeries.Valuesproperties to specify the categories and values of the chart. - Set properties such as the chart title, position and data labels.
- Use the
Workbook.SaveToFile()method to save the workbook.
Here is a complete code example showing how to create an exploded doughnut chart from the product sales data in a worksheet in React:
function App() {
  const createExplodedDoughnutChart = async () => {
    // Get the Spire.XLS WASM module
    const xlsModule = window.wasmModule?.spirexls;

    // Check whether the module is ready
    if (!xlsModule) {
      alert('Spire.Xls is not ready yet');
      return;
    }

    // Load the font and Excel file into the VFS
    await window.spire.FetchFileToVFS('ARIAL.TTF', '/Library/Fonts/', `${process.env.PUBLIC_URL}/font/`);
    const inputFileName = 'SalesData.xlsx';
    await window.spire.FetchFileToVFS(inputFileName, '', `${process.env.PUBLIC_URL}data/`);

    // Load the workbook and get the worksheet that contains the data
    const workbook = new xlsModule.Workbook();
    workbook.LoadFromFile({ fileName: inputFileName });
    const sheet = workbook.Worksheets.get(0);

    // Add a chart and set its chart type to an exploded doughnut chart
    const chart = sheet.Charts.Add();
    chart.ChartType = xlsModule.ExcelChartType.DoughnutExploded;

    // Set the data range and the title of the chart
    chart.DataRange = sheet.Range.get("B2:B7");
    chart.SeriesDataFromRange = false;
    chart.ChartTitle = "Sales Share by Product";
    chart.ChartTitleArea.IsBold = true;
    chart.ChartTitleArea.Size = 12;

    // Set the category labels and the values of the chart, and show the value labels
    const cs = chart.Series.get(0);
    cs.CategoryLabels = sheet.Range.get("A2:A7");
    cs.Values = sheet.Range.get("B2:B7");
    cs.DataPoints.DefaultDataPoint.DataLabels.HasValue = true;

    // Set the position of the chart
    chart.LeftColumn = 4;
    chart.TopRow = 1;
    chart.RightColumn = 15;
    chart.BottomRow = 25;

    // Hide the background of the plot area and set the position of the legend
    chart.PlotArea.Fill.Visible = false;
    chart.Legend.Position = xlsModule.LegendPositionType.Right;

    // Save the document
    const outputFileName = 'ExplodedDoughnutChart_output.xlsx';
    workbook.SaveToFile({ fileName: outputFileName });

    // Release resources
    workbook.Dispose();

    // Read the converted file from the VFS and trigger a download
    const fileArray = window.dotnetRuntime.Module.FS.readFile(outputFileName);
    const blob = new Blob([fileArray], { type: 'application/vnd.openxmlformats-officedocument.spreadsheetml.sheet' });
    const url = URL.createObjectURL(blob);
    const a = document.createElement('a');
    a.href = url;
    a.download = outputFileName;
    a.click();
    URL.revokeObjectURL(url);
  };

  return (
    <div style={{ textAlign: 'center', height: '300px' }}>
      <h1>Create Exploded Doughnut Chart</h1>
      <button onClick={createExplodedDoughnutChart}>
        Start
      </button>
    </div>
  );
}

export default App;
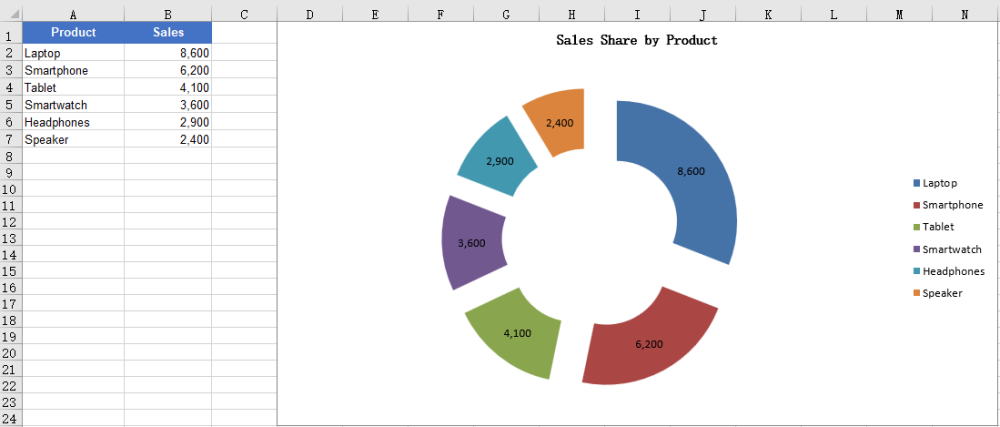
After running the code, you can see the effect of the exploded doughnut chart:
FAQ
The created chart is blank with no slices
Cause: The chart has no valid data series. For example, the DataRange or Values points to an empty range or a range without numbers, so the chart has no data to draw.
Solution: Assign a data range that contains the data to the chart, for example:
chart.DataRange = sheet.Range.get("A1:B7");

const cs = chart.Series.get(0);
cs.CategoryLabels = sheet.Range.get("A2:A7");
cs.Values = sheet.Range.get("B2:B7");
Want to show percentages instead of values in the data labels
Cause: Pie and doughnut charts are usually used to show proportions, but the data labels show values by default, or the percentage labels are not enabled.
Solution: Disable the value labels and enable the percentage labels, for example:
const cs = chart.Series.get(0);
cs.DataPoints.DefaultDataPoint.DataLabels.HasValue = false;
cs.DataPoints.DefaultDataPoint.DataLabels.HasPercentage = true;
Obtain a Free License
Spire.XLS for JavaScript offers a 30-day full-featured free trial license with no functional limitations. Apply here to evaluate before purchasing.
Different Headers and Footers in Excel with JavaScript in React
By default, Excel displays the same header and footer at the top and bottom of every page. However, when printing formal reports, manuals, or theses, it is often necessary for different pages to show different headers and footers — for example, odd and even pages can use different headers, or the first page can have no header/footer while only the body pages show the page number. Spire.XLS for JavaScript completes this directly in the browser based on WebAssembly, managing input/output files through a virtual file system (VFS), with no backend service required.
This article introduces two core features:
- Set Different Headers and Footers for Odd and Even Pages
- Set a Different Header and Footer on the First Page
For installation and project configuration, refer to Integrating Spire.XLS for JavaScript in a React Project. The examples below assume Spire.XLS is installed and the WebAssembly module is initialized.
Set Different Headers and Footers for Odd and Even Pages
In books, papers or reports printed on both sides of the page, odd and even pages usually use different headers and footers, for example the header of odd pages shows the chapter name and the header of even pages shows the book title. To set different headers and footers for odd and even pages with Spire.XLS for JavaScript, follow these steps:
- Create a
Workbookobject and use theLoadFromFile()method to load the Excel file. - Use the
Workbook.Worksheets.get()method to get the specified worksheet. - Set the
PageSetup.DifferentOddEvenproperty to1to enable different headers and footers for odd and even pages. - Use the
PageSetup.OddHeaderStringandPageSetup.OddFooterStringproperties to set the header and footer of odd pages. - Use the
PageSetup.EvenHeaderStringandPageSetup.EvenFooterStringproperties to set the header and footer of even pages. - Use the
Workbook.SaveToFile()method to save the workbook.
Here is a complete code example showing how to set different headers and footers for the odd and even pages of a worksheet in React (the sample input file contains data that spans multiple pages, making it easy to observe the effect on different pages):
function App() {
  const setOddEvenHeaderFooter = async () => {
    // Get the Spire.XLS WASM module
    const xlsModule = window.wasmModule?.spirexls;

    // Check whether the module is ready
    if (!xlsModule) {
      alert('Spire.Xls is not ready yet');
      return;
    }

    // Load the font and Excel file into the VFS
    await window.spire.FetchFileToVFS('ARIAL.TTF', '/Library/Fonts/', `${process.env.PUBLIC_URL}/font/`);
    const inputFileName = 'DifferentHeaderFooter.xlsx';
    await window.spire.FetchFileToVFS(inputFileName, '', `${process.env.PUBLIC_URL}data/`);

    // Load the workbook
    const workbook = new xlsModule.Workbook();
    workbook.LoadFromFile({ fileName: inputFileName });

    // Get the first worksheet
    const sheet = workbook.Worksheets.get(0);

    // Enable different headers and footers for odd and even pages
    sheet.PageSetup.DifferentOddEven = 1;

    // Set the header and footer for odd pages (orange, bold)
    sheet.PageSetup.OddHeaderString = "&\"Arial\"&12&B&KFFC000Odd Page Header";
    sheet.PageSetup.OddFooterString = "&\"Arial\"&12&B&KFFC000Odd Page Footer";

    // Set the header and footer for even pages (red, bold)
    sheet.PageSetup.EvenHeaderString = "&\"Arial\"&12&B&KFF0000Even Page Header";
    sheet.PageSetup.EvenFooterString = "&\"Arial\"&12&B&KFF0000Even Page Footer";

    // Switch to Page Layout view to preview the header and footer
    sheet.ViewMode = xlsModule.ViewMode.Layout;

    // Save the document
    const outputFileName = 'DifferentHeaderFooterOddEven_output.xlsx';
    workbook.SaveToFile({ fileName: outputFileName, version: xlsModule.ExcelVersion.Version2010 });

    // Release resources
    workbook.Dispose();

    // Read the converted file from the VFS and trigger a download
    const fileArray = window.dotnetRuntime.Module.FS.readFile(outputFileName);
    const blob = new Blob([fileArray], { type: 'application/vnd.openxmlformats-officedocument.spreadsheetml.sheet' });
    const url = URL.createObjectURL(blob);
    const a = document.createElement('a');
    a.href = url;
    a.download = outputFileName;
    a.click();
    URL.revokeObjectURL(url);
  };

  return (
    <div style={{ textAlign: 'center', height: '300px' }}>
      <h1>Set Different Header and Footer for Odd and Even Pages</h1>
      <button onClick={setOddEvenHeaderFooter}>
        Start
      </button>
    </div>
  );
}

export default App;
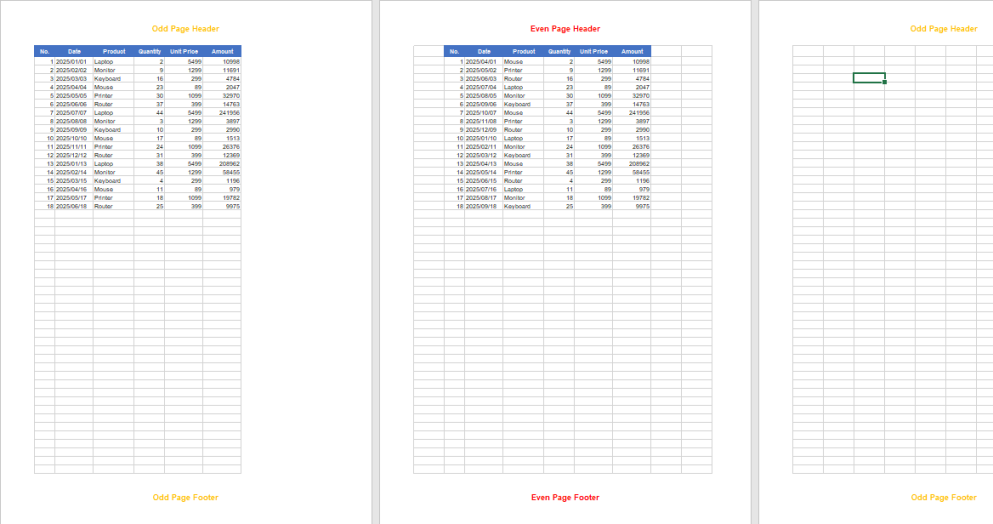
After this setting, different headers and footers are applied to odd and even pages.
Set a Different Header and Footer on the First Page
Many formal documents require the first page (cover page) to display no header/footer or a dedicated header/footer, while the body pages display a header and footer carrying document information. In this case, you can enable "different first page" and set the header and footer of the first page separately. The steps are as follows:
- Create a
Workbookobject and use theLoadFromFile()method to load the Excel file. - Use the
Workbook.Worksheets.get()method to get the specified worksheet. - Set the
PageSetup.DifferentFirstproperty to1to enable a header and footer on the first page that differ from those on the other pages. - Use the
PageSetup.FirstHeaderStringandPageSetup.FirstFooterStringproperties to set the header and footer of the first page. - Use properties such as
PageSetup.LeftHeaderandPageSetup.CenterFooterto set the header and footer of the other pages. - Use the
Workbook.SaveToFile()method to save the workbook.
Here is a complete code example showing how to set a different header and footer on the first page of a worksheet in React:
function App() {
  const setFirstPageHeaderFooter = async () => {
    // Get the Spire.XLS WASM module
    const xlsModule = window.wasmModule?.spirexls;

    // Check whether the module is ready
    if (!xlsModule) {
      alert('Spire.Xls is not ready yet');
      return;
    }

    // Load the font and Excel file into the VFS
    await window.spire.FetchFileToVFS('ARIAL.TTF', '/Library/Fonts/', `${process.env.PUBLIC_URL}/font/`);
    const inputFileName = 'DifferentHeaderFooter.xlsx';
    await window.spire.FetchFileToVFS(inputFileName, '', `${process.env.PUBLIC_URL}data/`);

    // Load the workbook
    const workbook = new xlsModule.Workbook();
    workbook.LoadFromFile({ fileName: inputFileName });

    // Get the first worksheet
    const sheet = workbook.Worksheets.get(0);

    // Enable a different header and footer on the first page
    sheet.PageSetup.DifferentFirst = 1;

    // Set the header and footer for the first page (blue, bold)
    sheet.PageSetup.FirstHeaderString = "&\"Arial\"&16&B&K4253E2First Page Header";
    sheet.PageSetup.FirstFooterString = "&\"Arial\"&16&B&K4253E2First Page Footer";

    // Set the header and footer for the other pages (gray, bold)
    sheet.PageSetup.LeftHeader = "&\"Arial\"&12&B&K808080Other Pages Header";
    sheet.PageSetup.CenterFooter = "&\"Arial\"&12&B&K808080Other Pages Footer";

    // Switch to Page Layout view to preview the header and footer
    sheet.ViewMode = xlsModule.ViewMode.Layout;

    // Save the document
    const outputFileName = 'DifferentHeaderFooterFirstPage_output.xlsx';
    workbook.SaveToFile({ fileName: outputFileName, version: xlsModule.ExcelVersion.Version2010 });

    // Release resources
    workbook.Dispose();

    // Read the converted file from the VFS and trigger a download
    const fileArray = window.dotnetRuntime.Module.FS.readFile(outputFileName);
    const blob = new Blob([fileArray], { type: 'application/vnd.openxmlformats-officedocument.spreadsheetml.sheet' });
    const url = URL.createObjectURL(blob);
    const a = document.createElement('a');
    a.href = url;
    a.download = outputFileName;
    a.click();
    URL.revokeObjectURL(url);
  };

  return (
    <div style={{ textAlign: 'center', height: '300px' }}>
      <h1>Set Different Header and Footer on the First Page</h1>
      <button onClick={setFirstPageHeaderFooter}>
        Start
      </button>
    </div>
  );
}

export default App;
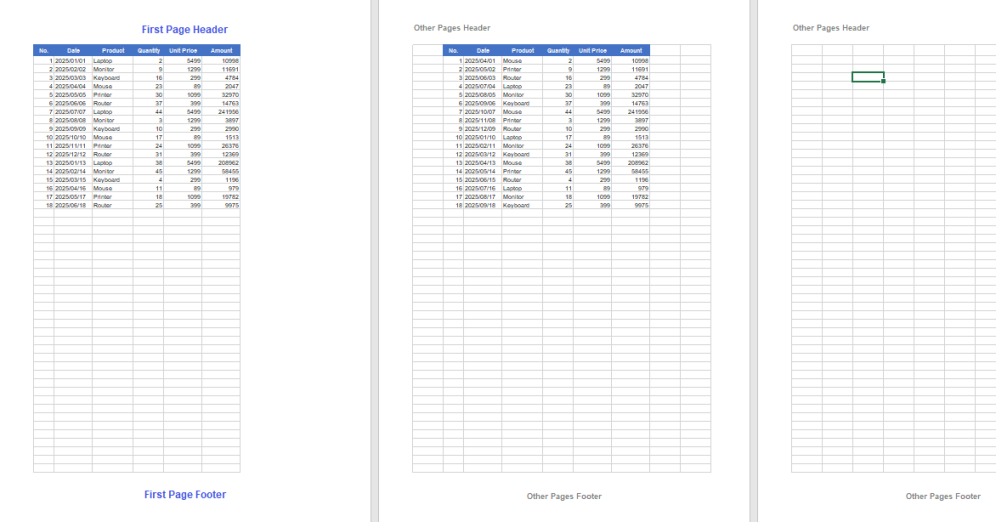
After this setting, the first page uses a different header and footer from the other pages.
FAQ
The header and footer on the first page is not applied
Cause: The "different first page" option was not enabled. If only FirstHeaderString/FirstFooterString are set without setting PageSetup.DifferentFirst to 1, Excel ignores the first-page header and footer.
Solution: Enable sheet.PageSetup.DifferentFirst = 1; before setting the header and footer of the first page.
Header/footer text shows as garbled characters or boxes
Cause: Browser-side Excel processing depends on font files. If the font used by the text (such as ARIAL.TTF) has not been loaded into the virtual file system (VFS), the text may not render correctly.
Solution: Load the font into the VFS with FetchFileToVFS() before calling Workbook.LoadFromFile(), for example:
await window.spire.FetchFileToVFS(
  'ARIAL.TTF', '/Library/Fonts/', `${process.env.PUBLIC_URL}/font/`
);
Obtain a Free License
Spire.XLS for JavaScript offers a 30-day full-featured free trial license with no functional limitations. Apply here to evaluate before purchasing.
Accept or Reject Tracked Changes in Excel with JavaScript in React
When multiple users collaborate on an Excel document with tracking changes (Track Changes) enabled, every insertion, modification and deletion made to cells is recorded. When reviewing these changes, you often need to accept all tracked changes (to formally merge the changes of others into the document) or reject all tracked changes (to revert all changes and restore the state before the edits). Handling these changes one by one in Excel is tedious and error-prone, while processing them in bulk through code in a web application is far more efficient. Spire.XLS for JavaScript completes this directly in the browser based on WebAssembly, and manages input/output files through a virtual file system (VFS), with no backend service required.
Spire.XLS for JavaScript provides revision-handling capabilities through the workbook object: after loading a workbook that contains revision records, call the AcceptAllTrackedChanges() method to accept all tracked changes in the document, or call the RejectAllTrackedChanges() method to reject all tracked changes in the document.
This article covers two core features:
For installation and project configuration, refer to Integrating Spire.XLS for JavaScript in a React Project. The examples below assume Spire.XLS is installed and the WebAssembly module is initialized.
Accept All Tracked Changes in Excel
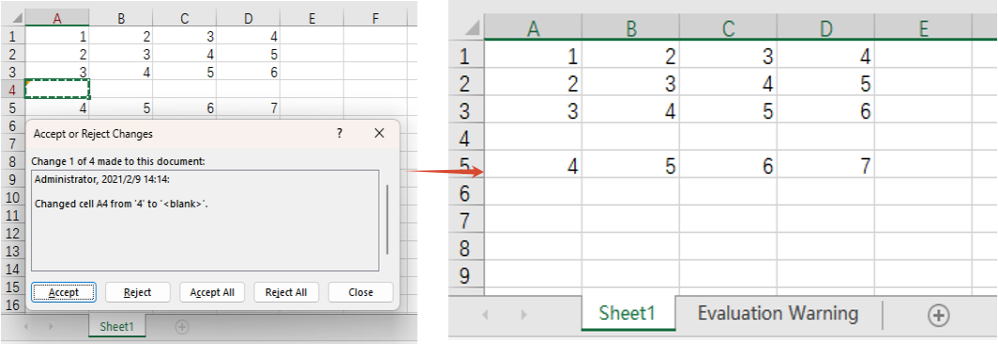
When a workbook containing revision records has been edited by multiple users and passes review, all the changes need to be formally merged into the document, that is, the tracked changes are "accepted". After the changes are accepted, they become the official content of the document and the revision records are cleared. The main steps are as follows:
- Create a
Workbookobject. - Load the workbook containing revision records with the
Workbook.LoadFromFile()method. - Call the
Workbook.AcceptAllTrackedChanges()method to accept all tracked changes in the document. - Save the workbook with the
Workbook.SaveToFile()method.
Here is a complete code example showing how to accept all tracked changes in an Excel workbook in React:
function App() {
  const acceptTrackedChanges = async () => {
    // Get the Spire.XLS WASM module
    const xlsModule = window.wasmModule?.spirexls;

    // Check whether the module is ready
    if (!xlsModule) {
      alert('Spire.Xls is not ready yet');
      return;
    }

    // Load the font and the Excel file into the VFS
    await window.spire.FetchFileToVFS('ARIAL.TTF', '/Library/Fonts/', `${process.env.PUBLIC_URL}/font/`);
    const inputFileName = 'TrackChanges.xlsx';
    await window.spire.FetchFileToVFS(inputFileName, '', `${process.env.PUBLIC_URL}data/`);

    // Create a Workbook object and load the workbook containing tracked changes
    const workbook = new xlsModule.Workbook();
    workbook.LoadFromFile({ fileName: inputFileName });

    // Accept all tracked changes in the document
    workbook.AcceptAllTrackedChanges();

    // Save the document
    const outputFileName = 'AcceptTrackedChanges_output.xlsx';
    workbook.SaveToFile({ fileName: outputFileName, version: xlsModule.ExcelVersion.Version2010 });

    // Release resources
    workbook.Dispose();

    // Read the converted file from the VFS and trigger a download
    const fileArray = window.dotnetRuntime.Module.FS.readFile(outputFileName);
    const blob = new Blob([fileArray], { type: 'application/vnd.openxmlformats-officedocument.spreadsheetml.sheet' });
    const url = URL.createObjectURL(blob);
    const a = document.createElement('a');
    a.href = url;
    a.download = outputFileName;
    a.click();
    URL.revokeObjectURL(url);
  };

  return (
    <div style={{ textAlign: 'center', height: '300px' }}>
      <h1>Accept All Tracked Changes</h1>
      <button onClick={acceptTrackedChanges}>
        Start
      </button>
    </div>
  );
}

export default App;
Effect of accepting all tracked changes
Reject All Tracked Changes in Excel
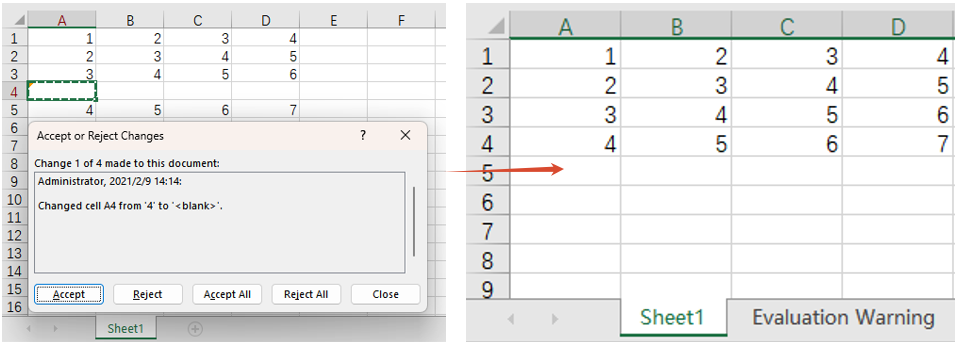
When the tracked changes are disputed or no longer needed, the reviewer can reject all of them at once so that the document returns to the state before the edits. The main steps are as follows:
- Create a
Workbookobject. - Load the workbook containing revision records with the
Workbook.LoadFromFile()method. - Call the
Workbook.RejectAllTrackedChanges()method to reject all tracked changes in the document. - Save the workbook with the
Workbook.SaveToFile()method.
Here is a complete code example showing how to reject all tracked changes in an Excel workbook in React:
function App() {
  const rejectTrackedChanges = async () => {
    // Get the Spire.XLS WASM module
    const xlsModule = window.wasmModule?.spirexls;

    // Check whether the module is ready
    if (!xlsModule) {
      alert('Spire.Xls is not ready yet');
      return;
    }

    // Load the font and the Excel file into the VFS
    await window.spire.FetchFileToVFS('ARIAL.TTF', '/Library/Fonts/', `${process.env.PUBLIC_URL}/font/`);
    const inputFileName = 'TrackChanges.xlsx';
    await window.spire.FetchFileToVFS(inputFileName, '', `${process.env.PUBLIC_URL}data/`);

    // Create a Workbook object and load the workbook containing tracked changes
    const workbook = new xlsModule.Workbook();
    workbook.LoadFromFile({ fileName: inputFileName });

    // Reject all tracked changes in the document
    workbook.RejectAllTrackedChanges();

    // Save the document
    const outputFileName = 'RejectTrackedChanges_output.xlsx';
    workbook.SaveToFile({ fileName: outputFileName, version: xlsModule.ExcelVersion.Version2010 });

    // Release resources
    workbook.Dispose();

    // Read the converted file from the VFS and trigger a download
    const fileArray = window.dotnetRuntime.Module.FS.readFile(outputFileName);
    const blob = new Blob([fileArray], { type: 'application/vnd.openxmlformats-officedocument.spreadsheetml.sheet' });
    const url = URL.createObjectURL(blob);
    const a = document.createElement('a');
    a.href = url;
    a.download = outputFileName;
    a.click();
    URL.revokeObjectURL(url);
  };

  return (
    <div style={{ textAlign: 'center', height: '300px' }}>
      <h1>Reject All Tracked Changes</h1>
      <button onClick={rejectTrackedChanges}>
        Start
      </button>
    </div>
  );
}

export default App;
Effect of rejecting all tracked changes
FAQ
The content is not restored to its pre-edit state after rejecting tracked changes
Cause: RejectAllTrackedChanges() rejects only the cell changes that were recorded by the Track Changes feature. If some changes were made before tracking was enabled, or were written by other means and never recorded, they are not revisions that can be rejected, so they keep their current values and the document will not fully return to the original baseline.
Can I accept or reject only part of the tracked changes instead of all of them
Cause: AcceptAllTrackedChanges() and RejectAllTrackedChanges() process all the revisions of a whole workbook at once. They do not provide APIs for filtering individual revisions by user, time or cell range.
Obtain a Free License
Spire.XLS for JavaScript offers a 30-day full-featured free trial license with no functional limitations. Apply here to evaluate before purchasing.