
JSON is one of the most widely used formats for storing and exchanging structured data. APIs, configuration files, and many modern applications use JSON to represent datasets.
However, JSON is not always convenient for analysis, reporting, or sharing with non-technical users. In many cases, converting JSON data into an Excel spreadsheet makes it easier to view, filter, sort, and present the information.
This guide shows five practical methods to convert JSON to Excel, ranging from no-code solutions to programmatic approaches.
Overview of methods covered:
- Method 1 — Excel Power Query (No Code)
- Method 2 — Online JSON Converter (Quick One-Off)
- Method 3 — Python with pandas (Automation Friendly)
- Method 4 — Python with Spire.XLS (Formatted Excel Reports)
- Method 5 — Node.js with SheetJS (JavaScript Workflow)
Prepare Your JSON Structure
Before converting JSON to Excel, it’s important to understand how the structure of your JSON data affects the conversion process. Many conversion tools assume a specific format, and mismatched structures can cause unexpected results or errors.
Root Array vs. Root Object
Many JSON-to-Excel tools expect the data to be a root array of objects, like this:
[
  {"id":1,"name":"Alice"},
  {"id":2,"name":"Bob"}
]
This structure maps naturally to an Excel table:
| id | name |
|---|---|
| 1 | Alice |
| 2 | Bob |
Each object becomes a row, and the keys become column headers.
However, many real-world APIs and datasets wrap the array inside a root object:
{
  "employees":[
    {"id":1,"name":"Alice"},
    {"id":2,"name":"Bob"}
  ]
}
In this case, the actual tabular dataset is stored inside the "employees" property.
Why Some Tools Fail on Root Objects
Some converters cannot automatically determine which property contains the tabular dataset. They expect the JSON file to start directly with an array.
When the data is wrapped inside a root object, these tools may fail to parse the file correctly or produce empty results.
Therefore, you may need to extract the relevant array manually before performing the conversion. For example, you might restructure the JSON so the array becomes the root element for an online converter, or access it directly in code.
Accessing the Array in Python
For example, if the dataset is stored under "employees", you can load and extract it like this:
data = json.load(f)["employees"]
After this step, data becomes a list of objects, which can be easily written to Excel as rows and columns.
Method 1 — Excel Power Query (No Code)
If you already have Microsoft Excel installed, you can import JSON data directly without writing any code. Excel’s Power Query feature allows users to load JSON files and automatically convert them into a tabular format. This approach is ideal for analysts or business users who want to quickly view JSON data inside a spreadsheet environment.
Steps
- Launch Microsoft Excel on your computer.
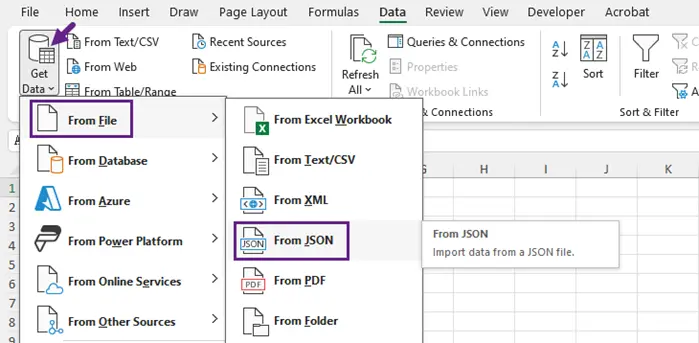
- Click on the Data tab located in the top menu of Excel.
- In the Data tab, navigate to Get Data, then select From File, and choose From JSON from the dropdown menu.
- When prompted, locate and select your JSON file, then click Import.
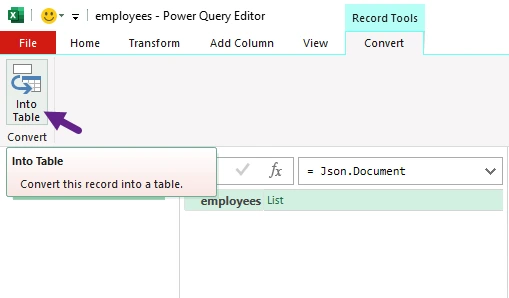
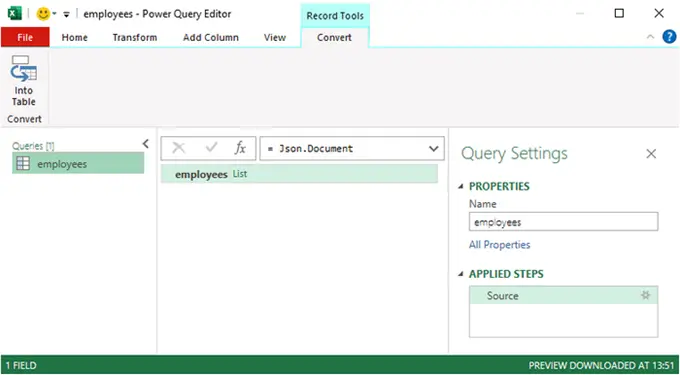
- The Power Query Editor will launch.
-
If the file opens as a list of records:
- Click To Table to convert the list into a table format.
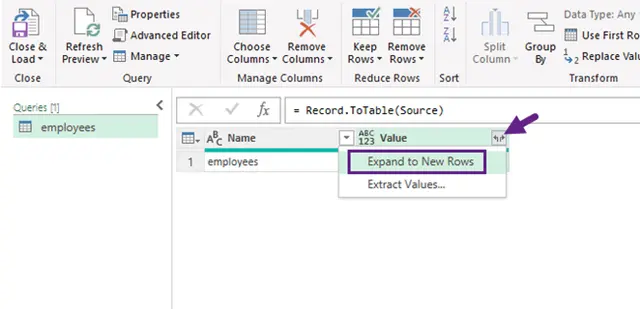
- Then, click the Expand (⇄) icon in the column header to reveal column names. If columns still show "List" or "Record," click the expand icon again to flatten further.
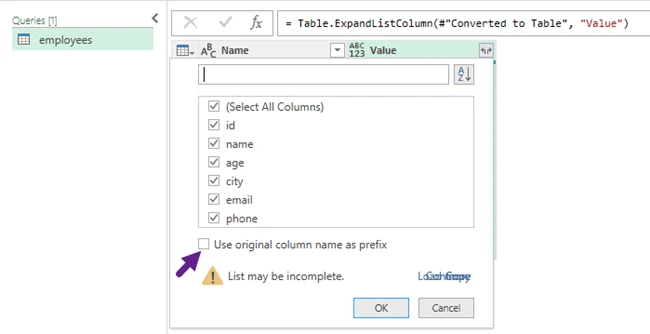
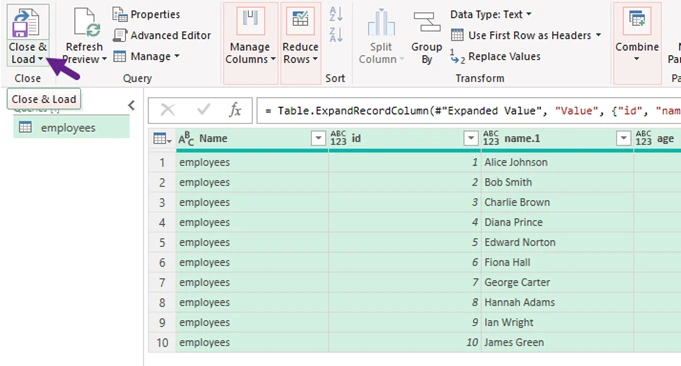
- A dialog box will appear, allowing you to select which fields you want to include in the table. Choose the necessary fields, uncheck "Use original column name as prefix" for cleaner headers, and then click OK.
- Click Close & Load to import the structured data into your Excel worksheet.
- Save your Excel file in .xlsx format, ensuring your data is preserved for future use.
When to use this method
Best for small datasets and users who prefer a visual interface rather than programming.
Method 2 — Online JSON Converter (Quick One-Off)
Online JSON converters provide one of the fastest ways to turn JSON files into Excel spreadsheets. These tools typically require only a file upload and automatically generate a downloadable Excel file. Platforms like those offered by jsontoexcel.net can complete the conversion in seconds without installing any software.
Steps
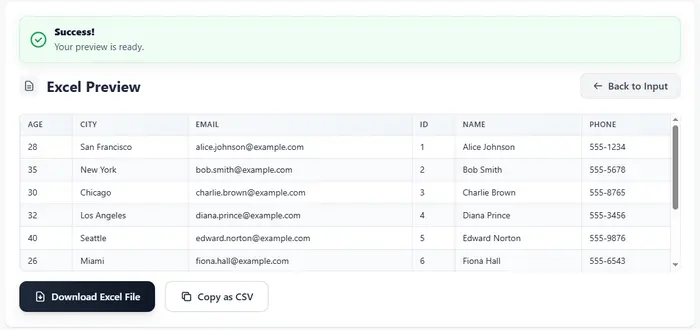
- Open a JSON-to-Excel converter website.
- Copy and paste your JSON data directly into the text editor, or upload a file from your computer.
- Click Convert to Excel button to initiate the conversion process.
- Download the generated Excel file.

Important Note
Most online converters expect a root array of objects; otherwise, they may fail silently or produce unexpected results. This format converts most reliably to Excel.
When to use this method
Best for quick, one-time conversions or testing sample datasets.
Method 3 — Python with pandas (Automation Friendly)
For developers and data engineers, Python provides a powerful way to automate JSON-to-Excel conversions. The popular data analysis library pandas can easily load JSON files, transform them into a structured DataFrame, and export the results to Excel. This method is particularly useful when the conversion needs to be integrated into scripts, ETL workflows, or automated reporting pipelines.
Install Dependencies
pip install pandas openpyxl
Convert JSON to Excel
import pandas as pd
import json
with open("employees.json") as f:
data = json.load(f)["employees"]
df = pd.json_normalize(data)
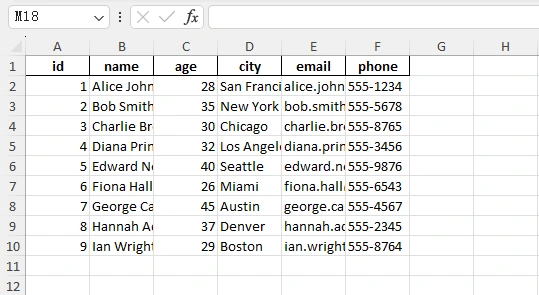
df.to_excel("output.xlsx", index=False)
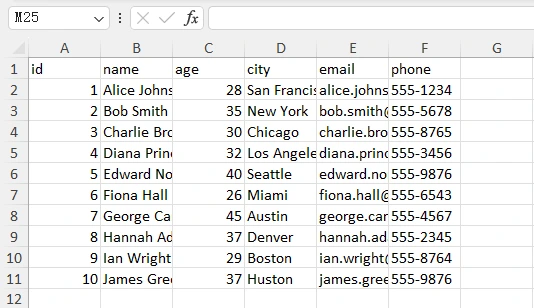
Output:
When to use this method
Ideal for automated data processing, analytics workflows, and large datasets.
Method 4 — Python with Spire.XLS (Formatted Excel Reports)
If your goal is to generate well-formatted Excel reports, Python can work with Spire.XLS to create spreadsheets programmatically. Unlike simple data export libraries, Spire.XLS provides extensive control over Excel formatting, including fonts, colors, alignment, and column sizing. This makes it suitable for producing professional spreadsheets that are ready to share with stakeholders.
Install the Library
pip install spire.xls
Example Code
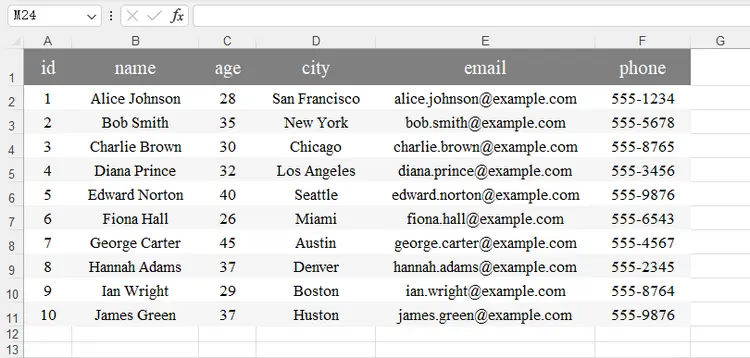
The following script reads JSON employee data, dynamically generates column headers, writes rows into Excel, and applies formatting such as header styling, alternating row colors, and auto-fitted columns.
import json
from spire.xls import *

# Load JSON data
with open('C:/Users/Administrator/Desktop/employees.json') as f:
    data = json.load(f)["employees"]

if not data:
    raise ValueError("JSON data is empty!")

# Create workbook and worksheet
workbook = Workbook()
sheet = workbook.Worksheets[0]

# Extract headers dynamically
headers = list(data[0].keys())
num_cols = len(headers)

# Write headers
for col, header in enumerate(headers, start=1):
    sheet.Range[1, col].Value = header

# Write rows
for row_index, item in enumerate(data, start=2):
    for col_index, key in enumerate(headers, start=1):
        value = item.get(key, "")
        sheet.Range[row_index, col_index].Value = str(value) if value is not None else ""

# Header formatting
header_row = sheet.Range[1, 1, 1, num_cols]
header_row.RowHeight = 30
header_style = header_row.Style
header_style.Font.FontName = "Times New Roman"
header_style.Font.Size = 16
header_style.Font.Color = Color.get_White()
header_style.Color = Color.FromArgb(255, 128, 128, 128)
header_style.HorizontalAlignment = HorizontalAlignType.Center
header_style.VerticalAlignment = VerticalAlignType.Center

# Data formatting
locatedRange = sheet.AllocatedRange
for rowNum in range(2, locatedRange.RowCount + 1):
    data_row = sheet.Range[rowNum, 1, rowNum, num_cols]
    data_row.RowHeight = 20
    row_style = data_row.Style
    row_style.Font.FontName = "Times New Roman"
    row_style.Font.Size = 13
    row_style.HorizontalAlignment = HorizontalAlignType.Center
    row_style.VerticalAlignment = VerticalAlignType.Center
    row_style.Color = Color.get_White() if rowNum % 2 == 0 else Color.FromArgb(255, 245, 245, 245)

# Auto-fit columns
extra_width = 3
for col in range(1, num_cols + 1):
    sheet.AutoFitColumn(col)
    current_width = sheet.Columns[col - 1].ColumnWidth
    sheet.Columns[col - 1].ColumnWidth = current_width + extra_width

workbook.SaveToFile("JsonToExcel.xlsx", ExcelVersion.Version2016)
workbook.Dispose()
Output:
When to use this method
Best for automated report generation, applications that require precise Excel formatting, and workflows where Excel files are the final deliverable.
You May Also Like: Convert JSON to/from Excel in Python – Full Guide with Examples
Method 5 — Node.js with SheetJS (JavaScript Workflow)
JavaScript developers can convert JSON to Excel using libraries such as SheetJS. This library provides utilities for transforming JSON objects into spreadsheet worksheets and writing them to .xlsx files. Because it works well in Node.js environments, it is commonly used in backend services and data-processing scripts.
Install
npm install xlsx
Example
const XLSX = require("xlsx");
const fs = require("fs");

const data = JSON.parse(fs.readFileSync("employees.json")).employees;

const worksheet = XLSX.utils.json_to_sheet(data);
const workbook = XLSX.utils.book_new();

XLSX.utils.book_append_sheet(workbook, worksheet, "Employees");
XLSX.writeFile(workbook, "output.xlsx");
Output:
When to use this method
Best for web applications, Node.js backends, and JavaScript-based automation workflows.
Quick Comparison of the 5 Methods
Each method for converting JSON to Excel serves a different type of user and workflow. Some approaches focus on simplicity and speed, while others provide automation and formatting control for more advanced scenarios. The table below summarizes the key differences to help you choose the most suitable option.
| Method | Skill Level | Automation | Best For | Limitations |
|---|---|---|---|---|
| Excel (Power Query) | Beginner | No | Quick manual conversion and data exploration | Requires manual steps; limited for repeated workflows |
| Online Converter | Beginner | No | One-time conversions and quick testing | File size limits; potential privacy concerns |
| Python with pandas | Intermediate | Yes | Data pipelines, analytics, and large datasets | Limited control over advanced Excel formatting |
| Python with Spire.XLS | Intermediate | Yes | Generating professional Excel reports | Requires additional library setup |
| Node.js with SheetJS | Intermediate | Yes | JavaScript applications and backend automation | Requires Node.js environment |
Best Practices for Converting JSON to Excel
Converting JSON to Excel may seem straightforward, but real-world datasets often contain nested structures, inconsistent keys, or large volumes of data. Following a few best practices can help ensure reliable and readable results.
- Flatten Nested JSON Structures
-
Consider File Size and Performance
Large JSON datasets can contain thousands or millions of records, which may cause performance issues when converting directly to Excel. A few tips:
- Use programmatic solutions (Python or Node.js) for large files.
- Process the data in batches if necessary.
- Avoid loading extremely large datasets directly into Excel.
Excel itself has limits (for example, around 1,048,576 rows per sheet), so very large datasets may need to be split across multiple worksheets.
- Use Multiple Sheets for Complex Data
-
Apply Formatting for Better Readability
If the Excel file will be shared with colleagues or stakeholders, formatting can significantly improve readability.
Useful formatting practices include:
- Bold header rows
- Adjusted column widths
- Alternating row colors
- Consistent fonts and alignment
Libraries like Spire.XLS allow programmatic control over these elements, making it possible to generate presentation-ready reports automatically.
Many JSON files contain nested objects or arrays. While JSON supports hierarchical data, Excel works best with flat, tabular structures.
For example, JSON like this:
{
  "id": 1,
  "name": "Alice",
  "address": {
    "city": "San Francisco",
    "zip": "94105"
  }
}
may need to be flattened into:
| id | name | address.city | address.zip |
|---|---|---|---|
| 1 | Alice | San Francisco | 94105 |
Libraries such as pandas provide tools like json_normalize() to flatten nested data automatically. When working with more complex JSON, preprocessing the structure before exporting to Excel often produces cleaner results.
Some APIs return JSON with multiple related arrays, such as:
{
  "customers": [...],
  "orders": [...],
  "products": [...]
}
Instead of forcing everything into one worksheet, consider exporting each dataset into separate Excel sheets. This preserves the logical structure of the original data and makes analysis easier.
Conclusion
JSON is widely used for storing and exchanging structured data, but it is not always ideal for analysis or sharing with non-technical users. Converting JSON to Excel makes the data easier to read, filter, and organize in a familiar spreadsheet format.
For simple, one-time conversions, tools like Excel or online converters are often sufficient. However, developers working with data pipelines or automated reports will benefit from programmatic solutions such as pandas, Spire.XLS, or SheetJS, which offer greater flexibility and control over the output.
FAQs
Q1. Why do some online converters reject valid JSON?
Many online converters expect a root array of objects as the dataset. If the JSON file starts with a root object containing nested arrays, the tool may not know which property represents the table. Extracting the relevant array before uploading the file usually resolves this issue.
Q2. What is the difference between a JSON array and a JSON object?
A JSON array is an ordered list of values enclosed in square brackets [], while a JSON object is a collection of key-value pairs enclosed in curly braces {}.
Q3. How can I convert nested JSON to Excel?
Nested JSON often requires flattening before exporting to Excel. Tools like pandas provide functions such as json_normalize() that automatically expand nested fields into columns. Alternatively, you can manually extract nested objects or arrays before writing the data.
Q4. Can Excel open JSON files directly?
Yes. Excel includes a feature called Power Query , which can import JSON files and convert them into tables. However, the process may require expanding nested structures manually to obtain a clean tabular dataset.