How to Insert Sparklines in Excel (4 Easy Methods)
2026-03-09 05:42:32 alice yangTable of Contents
- What are Sparklines and Why Use Them
- Understand the Types of Sparklines in Excel
- Method 1. Insert Sparklines through the Excel Ribbon (Quick and Simple)
- Method 2. Create Sparklines with Google Sheets (Cloud-based Solution)
- Method 3. Add Sparklines with Excel VBA (Automated Approach)
- Method 4. Insert Sparklines in Multiple Excel Files with C# (Batch Processing)
- Comparison Summary: Which Method Should You Choose
- Practical Tips for Better Sparklines
Data visualization doesn't always require a massive, screen-filling chart. Sometimes, the most powerful insights come from seeing a trend right next to the data point it represents. This is where Excel Sparklines-miniature charts that fit inside a single cell-become invaluable.
This article explains how to insert sparklines in Excel using both manual and automated techniques, so you can choose the method that best fits your workflow and environment.
- What are Sparklines and Why Use Them
- Understand the Types of Sparklines in Excel
- Method 1. Insert Sparklines through the Excel Ribbon (Quick and Simple)
- Method 2. Create Sparklines with Google Sheets (Cloud-based Solution)
- Method 3. Add Sparklines with Excel VBA (Automated Approach)
- Method 4. Insert Sparklines in Multiple Excel Files with C# (Batch Processing)
- Comparison Summary: Which Method Should You Choose
- Practical Tips for Better Sparklines
What are Sparklines and Why Use Them?
Introduced by data visualization pioneer Edward Tufte, Sparklines are "intense, simple, word-sized graphics." In Excel, they live within the background of a cell, allowing you to see data patterns without losing sight of the raw numbers.
Key Benefits:
- Contextual Clarity: Spot trends (seasonal spikes, steady declines) instantly.
- Space Efficiency: Ideal for large tables where a standard chart would be too cluttered.
- Data Integrity: Because they are linked to specific cells, they update automatically when your data changes.
Understand the Types of Sparklines in Excel
Excel offers three distinct Sparkline styles, each suited for different data stories:
| Sparkline Type | Visual Representation | Best For | Example Use Case |
|---|---|---|---|
| Line | Continuous line graph | Showing trends over time | Stock prices, temperature, or monthly sales |
| Column | Bar chart within each cell | Comparing discrete values | Monthly sales, quarterly performance |
| Win/Loss | Bars showing win (positive) vs. loss (negative) | Visualizing binary outcomes (positive/negative) | Financial performance, sports results |
Understanding these options helps you choose the right type for your needs.
Method 1. Insert Sparklines through the Excel Ribbon (Quick and Simple)
Inserting sparklines through the Excel ribbon is the most straightforward and intuitive method. It requires no advanced skills and is widely used.
How to Insert a Sparkline in Excel:
-
Launch Microsoft Excel, click File > Open, then browse and select your Excel file.
-
Click the destination cell where you want to insert the sparkline.
-
In the Excel Ribbon at the top, click on the Insert tab.
-
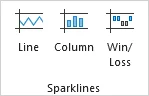
In the Sparklines group, choose your preferred sparkline style: Line, Column, or Win/Loss.
-
In the Create Sparklines dialog box, select the data range you want to visualize (e.g., B2:G2).
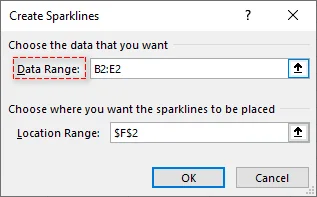
-
Click OK. Excel will insert the sparkline into the destination cell.
-
(Optional) Once inserted, the Sparkline tab will appear in the ribbon. Here you can adjust the color, style, and highlight specific points like "High Point" or "Negative Point".
Pro Tip:
- To apply the sparkline to multiple rows, simply click and drag the Fill Handle (the small square at the bottom-right of the cell) downward to instantly populate the rest of the cells.
When to use: This method is ideal for beginners or anyone who has Excel installed and works great for small-to-medium-sized datasets.
You may also like: How to Insert Objects in Excel: Embedding and Linking Files
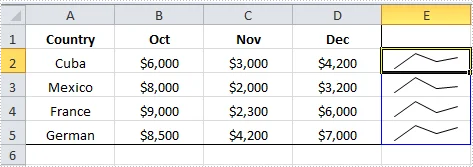
Method 2. Create Sparklines with Google Sheets (Cloud-based Solution)
If you're working in a cloud environment or collaborating with others on the web, Google Sheets can be a good alternative to Excel for creating sparklines. Unlike Excel, Google Sheets works directly in web browsers and does not require installation.
How to Create Sparklines via Google Sheets:
-
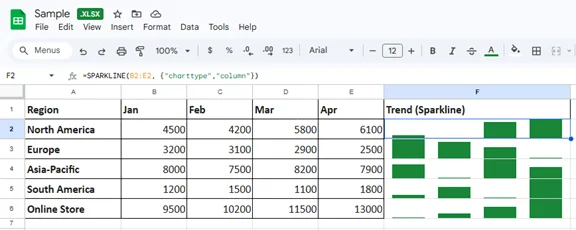
Open your Excel file in Google Sheets.
-
Click the cell where you want the sparkline to appear, type the following SPARKLINE formula:
=SPARKLINE(B2:E2, {"charttype","column"})This formula generates a column sparkline based on the data in B2:E2.
-
Press Enter, and the sparkline will appear in the selected cell.
-
(Optional) Auto-fill the formula in other cells by dragging the Handle.
Tips:
- Remember to replace "B2:E2" with your own data range.
- You can also change "column" to "line" or "winloss" depending on your preferred sparkline type, and customize the appearance by adding additional arguments for colors, axis visibility, etc. See SPARKLINE - Google Docs Editors Help for more details.
When to use: Ideal for collaborative teams and remote organizations that require real-time, shared data trends visualization.
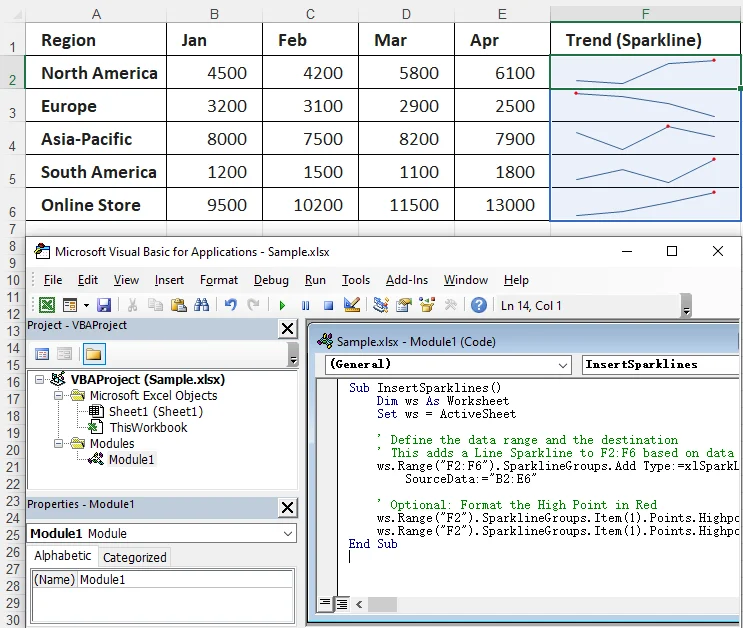
Method 3. Add Sparklines with Excel VBA (Automated Approach)
For analysts dealing with hundreds of rows, manual insertion is tedious. You can use a simple VBA macro to loop through a dataset and apply sparklines to an entire column at once.
Example VBA Code to Insert Sparklines in Excel:
Sub InsertSparklines()
    Dim ws As Worksheet
    Set ws = ActiveSheet

    ' Define the data range and the destination
    ' This adds a Line Sparkline to F2:F6 based on data in B2:E6
    ws.Range("F2:F6").SparklineGroups.Add Type:=xlSparkLine, _
        SourceData:="B2:E6"

    ' Optional: Format the High Point in Red
    ws.Range("F2").SparklineGroups.Item(1).Points.Highpoint.Visible = True
    ws.Range("F2").SparklineGroups.Item(1).Points.Highpoint.Color.Color = RGB(255, 0, 0)
End Sub
This script adds line-type sparklines to the range F2:F6 based on the data in B2:E6. You can adjust the sparkline type and data ranges as needed. For more details on the SparklineGroups.Add method, check the official Microsoft documentation.
How to use:
-
Press Alt + F11 to open the VBA Editor.
-
Go to Insert > Module to insert a new module.
-
Paste the code into the module and press F5 to run.
Important Notes:
- This approach requires saving the file as an .xlsm (Macro-Enabled) file, which can be blocked by corporate security settings.
- Macro operations cannot be undone, so be sure to back up your files before executing a macro to avoid unexpected updates.
When to use: Ideal for large datasets or recurring reports where the data structure is identical every time.
Method 4. Insert Sparklines in Multiple Excel Files with C# (Batch Processing)
For developers or enterprise users who need to insert sparklines into multiple Excel files at once, C# offers an efficient solution. Using the Spire.XLS for .NET library, you can batch create sparklines for a large volume of Excel files without installing and opening the Excel application.
What is Spire.XLS for .NET?
Spire.XLS for .NET is a versatile library designed for creating, modifying, and converting Excel files (.xlsx, .xls, and more) in .NET applications.
Key Features:
- Create and Edit Excel Files: Easily create new workbooks or modify existing ones, including support for inserting sparklines and complex formulas.
- Convert Excel to Multiple Formats: Convert Excel files to PDF, TXT, HTML, and more.
- No Dependency on Microsoft Excel: does not require Excel to be installed, which makes it suitable for server-side environments where Excel is unavailable or impractical.
How to Batch Insert Sparklines in Excel with C# and Spire.XLS
-
First, create a C# console application in an IDE like Visual Studio.
-
Next, install the required library via NuGet:
Install-Package Spire.XLSThis command will automatically download and reference the DLL of the library into your project.
-
Add the following code to batch insert sparklines into multiple Excel files:
using Spire.Xls;
using System;

namespace InsertSparkline
{
    class Program
    {
        static void Main(string[] args)
        {
            // Specify the input and output folder paths
            string inputFolder = @"C:\YourFolderPath";  // Modify the input folder path as needed
            string outputFolder = @"C:\YourOutputFolder"; // Modify the output folder path as needed

            // Loop through all Excel files in the input folder
            foreach (var file in Directory.GetFiles(inputFolder, "*.xlsx"))
            {
                // Load each file
                var wb = new Workbook();
                wb.LoadFromFile(file);

                // Get the first sheet
                var ws = wb.Worksheets[0];

                // Add a sparkline group to the sheet
                var sparklineGroup = ws.SparklineGroups.AddGroup(SparklineType.Line);
                // Set the data ranges for the sparklines and the destination cells where the sparklines will be placed
                string[,] ranges = { { "A2:D2", "E2" }, { "A3:D3", "E3" }, { "A4:D4", "E4" }, { "A5:D5", "E5" } };

                // Add sparklines using a loop
                for (int i = 0; i < ranges.GetLength(0); i++)
                    sparklineGroup.Add(ws[ranges[i, 0]], ws[ranges[i, 1]]);

                // Save the modified workbook to the output folder
                wb.SaveToFile(Path.Combine(outputFolder, Path.GetFileName(file)), ExcelVersion.Version2010);
                wb.Dispose();
            }
        }
    }
}
This script iterates over all Excel files in the specified input folder, inserts sparklines in the first sheet, and saves the modified files in the output folder.
-
Press F5 to run the code.
Considerations:
- This method requires proper environment setup and basic knowledge of C# programming, which may be challenging for beginners.
When to use: Ideal for developers or enterprise teams who need to automate Sparkline insertion tasks or process multiple Excel files in bulk in environments where Excel is not available.
Comparison Summary: Which Method Should You Choose
Choosing the right method for inserting sparklines in Excel depends on your specific needs, such as ease of use, batch processing requirements, and technical skill level. Here's a brief comparison to help you decide:
| Method | Ease of Use | Software Installation Needs | Batch Support | Skill Requirements |
|---|---|---|---|---|
| Excel Ribbon | Very Easy | Yes (Excel) | No | Low |
| Google Sheets | Easy | No | No | Moderate |
| Excel VBA | Moderate | Yes (Excel) | Yes | High |
| C# (Spire.XLS) | Moderate | No (but requires spire.xls.dll) | Yes | High |
Quick Selection Guide:
- For simplicity and small datasets: Use the Excel Ribbon method.
- For cloud-based or collaborative work: Try Google Sheets.
- For repetitive tasks or large datasets: Go with Excel VBA.
- For batch processing across multiple files in environments without Excel: C# with Spire.XLS is the most efficient solution.
Practical Tips for Better Sparklines
- Standardize the Axis: By default, Excel scales each Sparkline to its own data. If you are comparing different departments, go to Sparkline Design > Axis and select Same for All Sparklines so the relative heights are accurate.
- Handle Empty Cells: Use the Hidden & Empty Cells settings to decide if gaps in data should be shown as zero or as a connected line.
- Color Strategy: Use a neutral color (grey/blue) for the line and a high-contrast color (red) only for the High Point or Negative Point.
Frequently Asked Questions about Inserting Sparklines in Excel
Q1: Can I put multiple sparklines in one cell?
A1: No, a single cell can only host one sparkline group. However, you can merge cells to create more space for a larger sparkline.
Q2: Why are my sparklines not showing up?
A2: Check if your data range contains "Numbers stored as Text." Sparklines require actual numerical values to render.
Q3: Can I insert sparklines into multiple sheets at once?
A3: Yes, using VBA or C#, you can automate the process of adding sparklines to multiple sheets or files.
Q4: What's the difference between sparklines and charts?
A4: Sparklines are miniature charts embedded in a cell, without axes or labels, making them ideal for compact data visualization. Charts, on the other hand, are larger and come with axes, labels, and titles.
Q5: Are sparklines available in all versions of Excel?
A5: Sparklines are available in Excel 2010 and later versions. If you are using Excel 2007 or earlier, you'll need to upgrade to access sparklines.