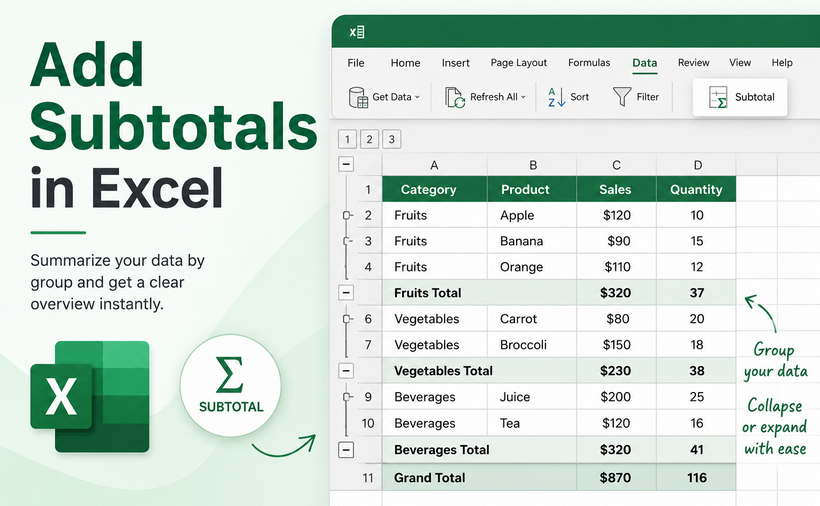
A spreadsheet with thousands of rows can quickly become unreadable without structural summaries. For effective data organization in Excel, the Subtotal feature stands out as one of the most powerful, high-impact tools available.
Whether you are an accountant balancing ledgers, a sales manager analyzing regional performance, or a marketer tracking campaign metrics, learning how to add subtotals in Excel can save you hours of manual work.
In this guide, we will explore four distinct methods to create subtotals in Excel:
- The Built-in Subtotal Tool (The quickest way).
- The Excel Subtotal Function (For dynamic calculations).
- The PivotTable (The modern alternative).
- The Python Automation (For batch processing).
What Are Subtotals in Excel?
Subtotals are summary calculations inserted between groups of related data in a worksheet. They allow you to:
- Break large, unorganized datasets into logical, readable categories
- View sums, averages, counts, and other aggregations at a glance
- Expand or collapse groups to focus on specific sections
- Maintain both detail-level and summary-level data in one sheet
Method 1: Use the Built-in Subtotal Tool
The Subtotal feature in Excel is the fastest way to add subtotals for most basic reporting needs. It automatically inserts summary rows and creates an outline view, allowing you to collapse and expand your data for different levels of detail.
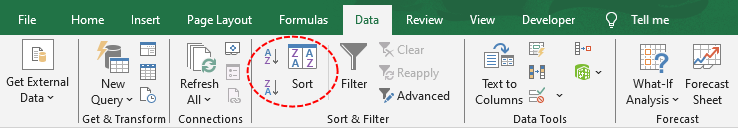
Step 1: Sort Your Data
Since subtotals group data based on value changes in a specific column, you must sort that column first.
- Click on the column you want to group by (e.g., "Region").
- Go to the Data tab and click Sort A to Z or Sort Z to A.
Step 2: Open the Subtotal Tool
- Select any cell within your dataset
- Navigate to the Data tab again and click Subtotal (in the Outline group)
Step 3: Configure the Subtotal Settings
A Subtotal dialog box will pop up with three crucial options:
- At each change in: Select the column you sorted by (e.g., "Region")
- Use function: Choose your calculation — Sum, Count, Average, Max, Min, etc.
- Add subtotal to: Check the box for the numeric column(s) you want to summarize
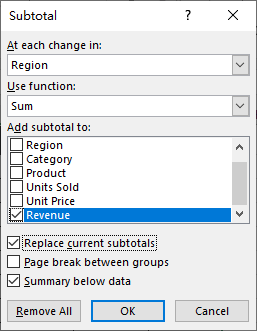
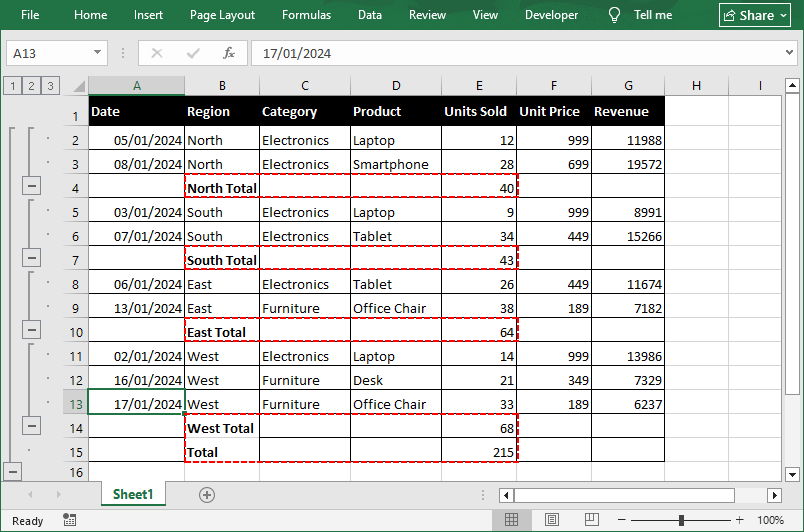
Click OK. Excel will immediately insert a "Total" row after each group, plus a "Grand Total" row at the bottom of the dataset.
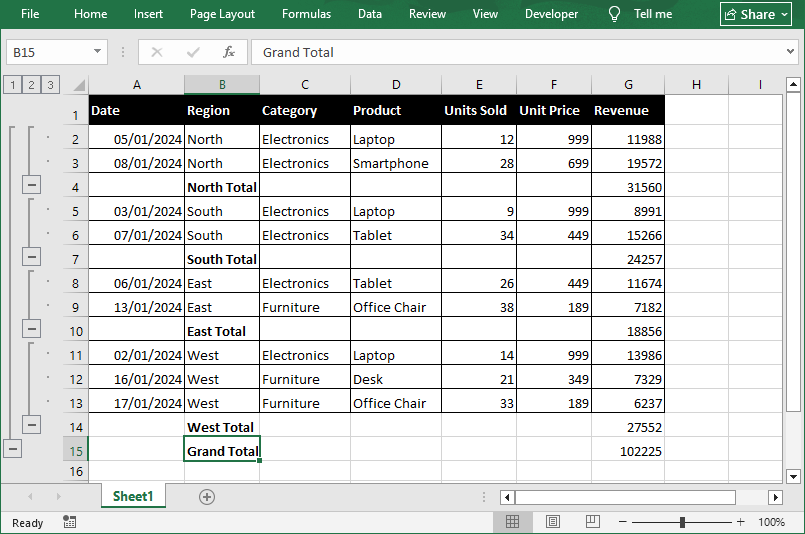
Pro Tip: Work with Outline Levels
Look at the left edge of the worksheet, you will see outline buttons (1, 2, 3). You can:
- Click 1 to show only the grand total
- Click 2 to show group subtotals and grand total
- Click 3 to show all detail rows plus subtotals
- Use the + / - buttons to expand or collapse individual groups
⚠️ Note: The Subtotal button on the Data tab doesn't work inside formatted Excel tables. Use the SUBTOTAL function in a total row (Table Design → Total Row) or convert the table to a range first.
Method 2: Use the Excel SUBTOTAL Function
While the built-in tool is static, the SUBTOTAL function is a dynamic formula that recalculates in real-time as your data changes. It is heavily used by financial analysts who build templates that are reused month after month.
The Syntax:
=SUBTOTAL(function_num, ref1, [ref2], ...)
-
function_num (Required): A numeric code that tells Excel exactly which math operation to perform.
- Basic codes (include manually hidden rows): 1 = AVERAGE, 2 = COUNT, 4 = MAX, 5 = MIN, 9 = SUM (most commonly used)
- Add 100 to the base code to ignore manually hidden rows (e.g., 109 = SUM that excludes manually hidden rows)
- ref1 (Required): The range of cells to subtotal
- [ref2] (Optional): Additional ranges you can add if your data is non-contiguous.
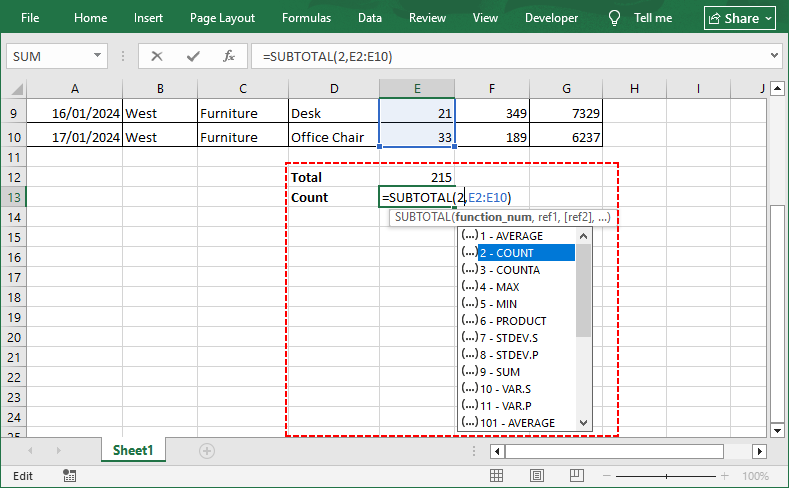
Subtotal Formula Example
If you have data in cells E2:E10:
- To sum values in a filtered list, use =SUBTOTAL(9, E2:E10).
- To count entries, use =SUBTOTAL(2, E2:E10).
Why Use SUBTOTAL Instead of SUM?
The key advantage is that SUBTOTAL automatically ignores other SUBTOTAL results within the range, preventing double-counting. It also respects Excel filters — when you filter data, only visible rows are included in the calculation.
Method 3: The Modern Alternative - PivotTables
PivotTables are essentially dynamic summarization engines that create a brand-new table (separate from your raw data) to display summaries. They're especially useful when you need more flexibility than the Subtotal tool provides.
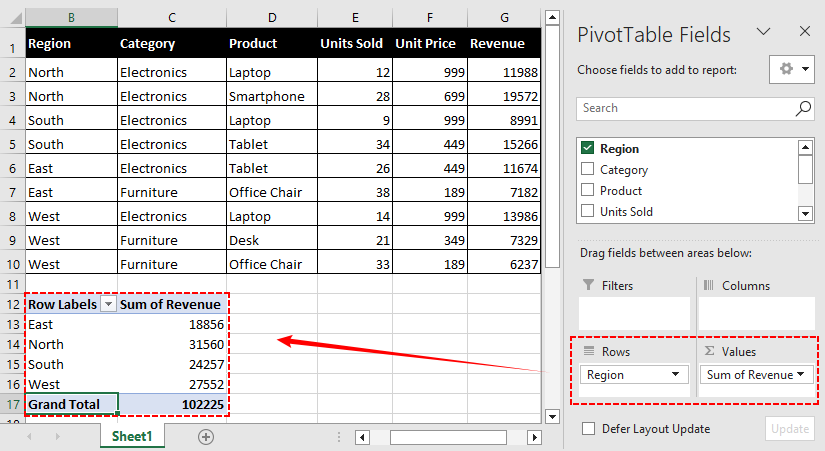
How to create a pivot table in Excel:
- Select your full dataset.
- Go to the Insert tab and click PivotTable.
- Drag your category (e.g., "Region") to the Rows field.
- Drag your numeric value (e.g., "Revenue") to the Values field.
Excel defaults to "Sum" for numeric fields and "Count" for text fields.
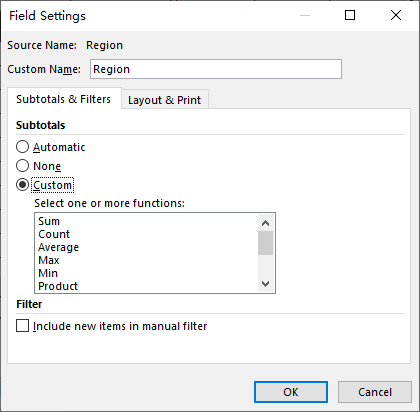
Customize the Subtotal Behavior
By default, PivotTables show a Subtotal for every top-level Row field. However, you have granular control:
- Right-click on the Row label (e.g., "Region").
- Select Field Settings.
- Under "Subtotals", you can choose:
- Automatic: Shows default subtotals.
- Custom: Allows you to select specific functions (e.g., show both Sum and Average for the same field).
- None: Removes subtotals entirely if you just want the grand total.
✅ Advantage: Unlike the traditional Subtotal tool, PivotTables do not require you to sort data in Excel first. They also refresh automatically when your source data updates, and you can easily add multiple grouping layers and calculation types without rewriting formulas.
Method 4: Add Subtotals Programmatically with Python
For users who need to automate subtotal generation, for example, in batch processing or within a data pipeline, the Free Spire.XLS for Python library provides a powerful way to insert subtotals programmatically.
This method replicates the behavior of the built-in Subtotal tool (Method 1) entirely via code, allowing you to process hundreds of files without opening Excel manually.
Prerequisites
First, ensure you have Python installed (3.7 or higher). Open your terminal or command prompt and run:
pip install Spire.Xls.Free
Python Code to Insert Subtotals in Excel
The following script loads an Excel workbook, applies subtotals to a specified data range, and saves the result as a new file:
from spire.xls import *
from spire.xls.common import *

# Create a Workbook object and load the Excel file
workbook = Workbook()
workbook.LoadFromFile("Regional.xlsx")
sheet = workbook.Worksheets[0]

# Define the data range for subtotal calculation
# Range covers B2 to E10 (data rows only, excluding header)
data_range = sheet.Range["B2:E10"]

# Call the Subtotal method with full parameters
sheet.Subtotal(data_range, 0, [3], SubtotalTypes.Sum, True, False, True)

# Save the result file
workbook.SaveToFile("AddSubtotals.xlsx", ExcelVersion.Version2016)
workbook.Dispose()
Output: Within range B2:E10, we apply a Sum subtotal grouped by the first column ("Region") on the fourth column ("Units Sold").
Parameter Breakdown
The Subtotal() method accepts seven parameters that give you full control over the output:
| Parameter | Type | Description |
|---|---|---|
| range | IXLSRange | The cell range containing the source data to subtotal. |
| groupByIndex | int | 0-based column index within the selected range used to group data. |
| totalFields | int[] | A list of 0‑based column indexes (within the range) indicating which fields to calculate subtotals for. |
| subtotalType | SubtotalTypes | Calculation type: Sum, Average, Count, Max, Min, etc. |
| replace | bool | Whether to replace the existing subtotals in the range. |
| addPageBreak | bool | Whether to insert a page break after each group (useful for printing). |
| addsummaryBelowData | bool | Whether to place the subtotal row below the group details. |
⚠️ Note: Just like the Excel interface, your source data must be sorted by the grouping column before calling Subtotal(). Unsorted data will generate a subtotal row at every value change, creating many small, unintended groups.
ALSO READ: Group or Ungroup Rows and Columns in Excel Using Python
Frequently Asked Questions (FAQs)
Q: Can I add multiple subtotals to the same column?
Yes, you can apply more than one calculation (e.g., both Sum and Average) to the same column:
- Insert the first subtotal as usual
- Open the Subtotal dialog again
- Choose a different function
- Uncheck "Replace current subtotals"
- Click OK
In Python, you would call the Subtotal() method twice with replace=False on the second call.
Q: What is the shortcut for subtotals in Excel?
There is no direct keyboard shortcut, but you can use Alt + A + B to open the Subtotal dialog box.
Q: How to remove Subtotals?
If you make a mistake or want to revert to raw data, go back to Data > Subtotal. In the dialog box, click the Remove All button at the bottom left. This instantly deletes all subtotal rows and outline symbols, restoring your data to its original sorted state.
Q: Can I copy subtotals only?
Yes. If you click the outline button 2 to show only the totals, you can press Alt + ; (semicolon) to select visible cells only, and then copy/paste to a new sheet.
Final Thoughts
Learning how to add subtotals in Excel is a non-negotiable skill for data analysis, and the right method depends entirely on your workflow. For a quick, one-off analysis, the built-in Subtotal tool works best. While the SUBTOTAL function supports dynamic, filter-friendly calculations, and PivotTables excel at flexible, multi-dimensional reporting,
When you need to automate repetitive tasks and process files at scale, Python with Free Spire.XLS is an ideal option. Mastering all four methods will make you significantly faster and more confident when working with large datasets.