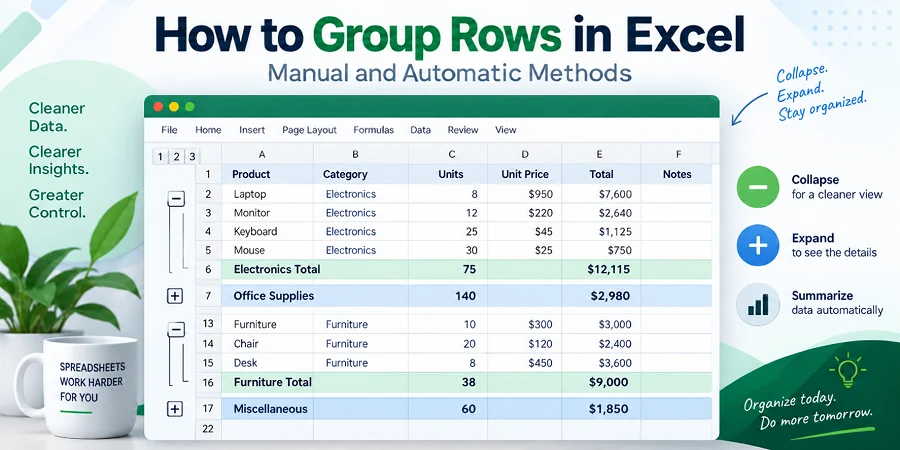
When an Excel worksheet contains hundreds of rows, scrolling through raw data makes reports difficult to read. Grouping rows in Excel organizes large datasets into expandable and collapsible sections so you can navigate summaries without losing detail. Depending on how your data is structured, you can group rows manually, use automatic tools, or apply grouping in PivotTables.
Quick Answer
- Group a few rows manually: Select the target rows, then go to Data > Outline > Group or press Alt + Shift + Right Arrow.
- Group rows automatically by category: Sort the data by the target column, then use Data > Outline > Subtotal.
- Create multi-level row groups: Build the innermost sub-groups first, then create the outer parent group.
- Group data in a PivotTable: Right-click a date, number, or selected field item and choose Group.
- Multiple Excel files: Use Python to apply the same row-grouping rules across workbooks automatically.
What Does Grouping Rows in Excel Mean?
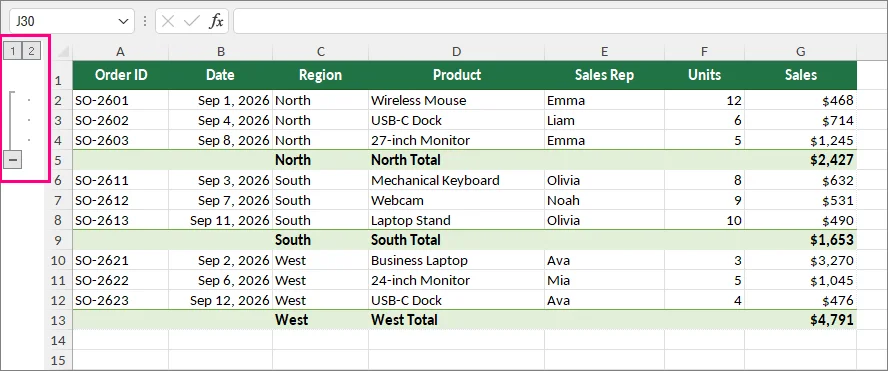
Grouping rows creates an expandable and collapsible section for related data, adding an outline control bar with plus (+) and minus (-) symbols to the left of your row numbers.
For example, in a sales report, you can collapse hundreds of daily transaction rows to show only the monthly totals, and expand them whenever you need a closer inspection.
To better understand row grouping, here is how it differs from other Excel tools:
- vs. Merging Cells: Merging combines adjacent cells into a single larger cell, whereas grouping keeps individual rows intact and controls whether their details are visible.
- vs. Hiding Rows: Hidden rows are simply hidden from view, while grouped rows include outline controls that make them easier to expand and collapse.
How to Group Rows in Excel Manually
Manually grouping rows is the most precise way to organize custom datasets. Excel allows you to collapse selected ranges with just a few clicks or by using a quick keyboard shortcut.
Step-by-Step Guide to Manual Grouping
-
Select detailed rows: Drag across the row numbers you want to group on the far left (do not include summary/total rows).
-
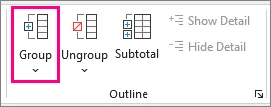
Apply Grouping: On the Data tab, click Group in the Outline section (or press Alt + Shift + Right Arrow on Windows / Command + Shift + K on Mac).
Once applied, you will immediately see an outline bar and a minus (-) button appear on the left margin, indicating your row group is active and ready to collapse.
Expand/Collapse Buttons Appear in the Wrong Position?
By default, Excel expects summary rows to appear below the detail rows they summarize. If your summary row appears above the detail rows, the outline controls may appear on the opposite side of the summary structure. You can change the outline setting to match your worksheet layout.
To adjust the layout:
-
Go to the Data tab.
-
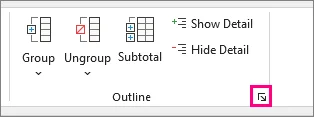
In the Outline group, click the small dialog launcher arrow (Settings) in the bottom-right corner.
-
Clear Summary rows below detail and click OK.
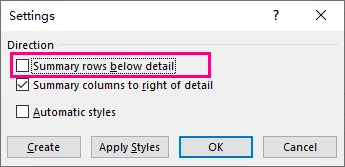
Your toggle buttons will now align properly next to your top summary row.
How to Automatically Group Rows in Excel
When dealing with large, structured datasets, manually selecting rows to group can be tedious. Excel offers two built-in tools to automate row grouping based on categories or summary formulas: Subtotal and Auto Outline.
Method 1: Using the Subtotal Tool
Use the Subtotal tool when you want Excel to automatically identify groups, insert calculation rows (like SUM or AVERAGE), and build an expandable outline in one step.
Step-by-Step Guide
-
Ensure your continuous data range is sorted by the grouping column (e.g., sort by Region so all matching entries are grouped together).
-
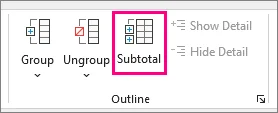
Select any cell inside your data range, then go to the Data tab > Outline group > Subtotal.
-
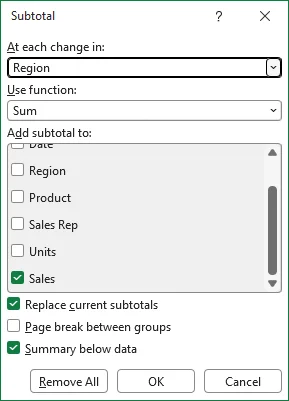
Configure the settings:
- At each change in: Select your grouping column (e.g., Region).
- Use function: Select your desired calculation (e.g., Sum).
- Add subtotal to: Check the columns containing values you want to calculate (e.g., Sales).
-
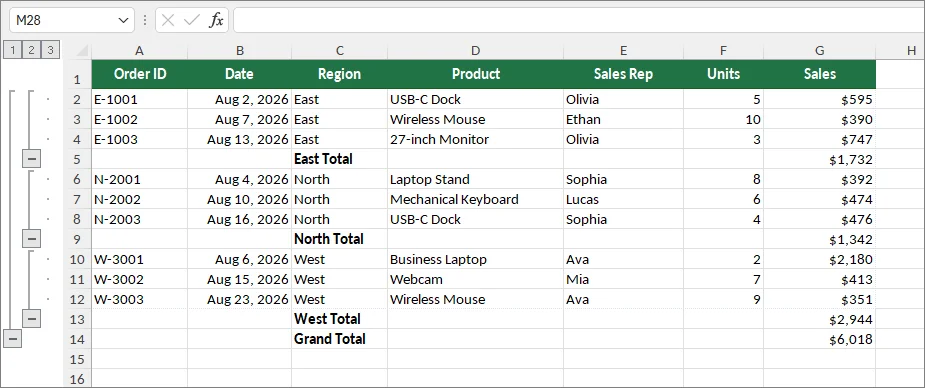
Click OK. Excel will automatically insert subtotal rows and build multi-level outline buttons on the left margin.
⚠️ Warning: Excel Table Limitation
The Subtotal feature is disabled inside official Excel Tables (Ctrl + T). If your data is formatted as a Table, go to Table Design > Convert to Range first to restore standard cell functionality, or use a PivotTable instead.
Method 2: Using Auto Outline
If your spreadsheet already contains summary rows or total formulas above or below detailed data, you can use Auto Outline to generate row groups instantly.
Step-by-Step Guide
-
Ensure your summary rows contain standard Excel formulas (such as
=SUM()or=AVERAGE()) pointing directly to detail rows above or below. -
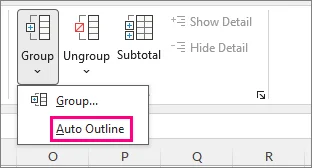
Click any cell within your data range, go to the Data tab > click the arrow next to Group > select Auto Outline.
⚡ Pro Tip:
Auto Outline requires functional summary formulas (such as =SUM()) referencing detail data. It cannot detect a hierarchy from simple labels or static values alone. If Excel fails to recognize the structure, check your formulas or create the groups manually.
How to Create Nested (Multi-level) Row Groups in Excel
When managing complex datasets with hierarchical categories (such as Year > Quarter > Month), a single outline level is often not enough. Excel allows you to nest row groups inside one another, creating up to 8 levels of collapsible depth.
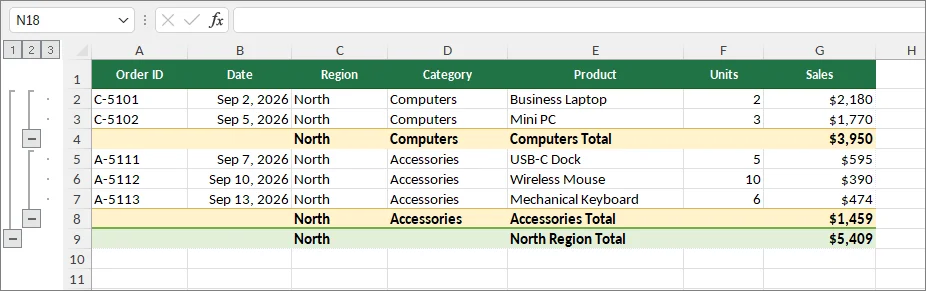
Step-by-Step Guide to Nesting Row Groups
To build a clean multi-level outline, start with the smallest sub-groups, then group the broader parent range around them.
-
Create the innermost group:
- Select only the detail rows for the smallest category. Do not include the category subtotal row.
- On the Data tab, click Group in the Outline section (or press Alt + Shift + Right Arrow / Command + Shift + K).
-
Create the outer parent group:
- Ensure inner subgroups are fully expanded, then select the broader range that contains the existing inner groups. Do not include the higher-level total row.
- Click Group again (or press the shortcut).
-
Repeat for higher categories:
- Repeat this process from smaller categories to larger parent categories. Excel dynamically assigns level numbers (1, 2, 3...) on the far-left margin (supporting up to 8 nested outline levels).
How to Expand or Collapse Grouped Rows in Excel
Once your rows are grouped, use the outline controls on the left of the worksheet to choose how much detail to display.
- Expand or collapse one group: Click minus (-) to hide its detail rows, or plus (+) to show them again.
- Collapse all grouped details: Click the 1 button above the outline to show the outermost level.
- Expand all grouped details: Click the highest-numbered outline button. For nested groups, select an intermediate number to show that level while keeping deeper details hidden.
⚠️ Note: Expanding or collapsing groups only changes row visibility (hiding/showing rows)—it does not delete your underlying data or existing formulas.
How to Group Rows in Excel PivotTables
PivotTable grouping is different from worksheet row grouping.
Worksheet row grouping adds outline controls to rows in the original worksheet. PivotTable grouping combines field items inside a PivotTable for analysis and summarization.
You can group:
- Dates into months, quarters, or years
- Numbers into ranges
- Selected text items into custom categories
1. Group Dates by Month, Quarter, or Year
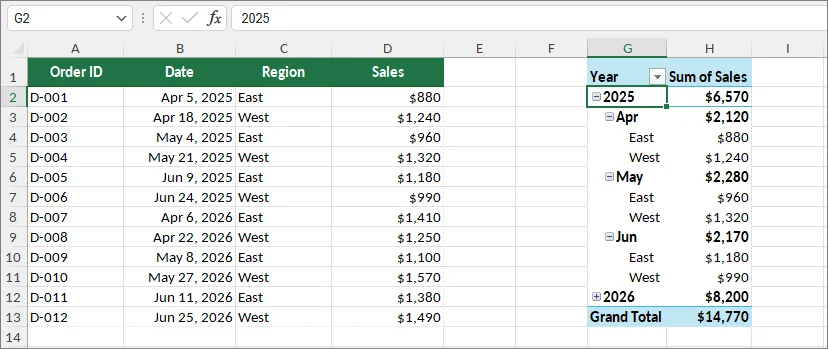
In newer versions of Excel, PivotTables may automatically group date fields when they are added. If you need to customize or change the intervals, follow these steps:
- Ensure your date field is added to the Rows area of the PivotTable.
- Right-click any valid date inside the PivotTable.
- Select Group.
- Choose one or more intervals, such as:
- Months
- Quarters
- Years
- Click OK.
To group by Weeks, select only Days in the dialog box, and change the "Number of days" setting at the bottom to 7.
2. Group Numbers into Ranges
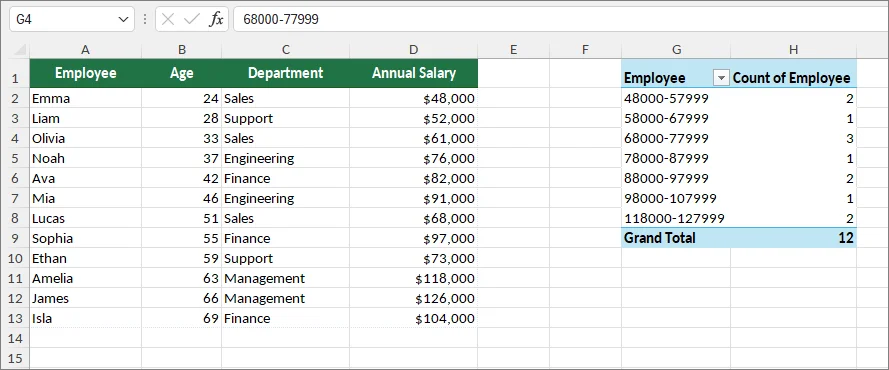
If you want to turn individual numeric entries into structured ranges (like $0–$10,000, $10,001–$20,000), do this:
- Make sure your numeric field is added to the Rows area of the PivotTable Fields pane.
- Right-click any number in that row and select Group....
- In the Grouping box, define your boundaries:
- Starting at: Your lowest limit (e.g., 0).
- Ending at: Your maximum limit (e.g., 100,000).
- By: The size of each interval/bucket (e.g., 10,000).
- Click OK.
3. Group Text Items into Custom Categories
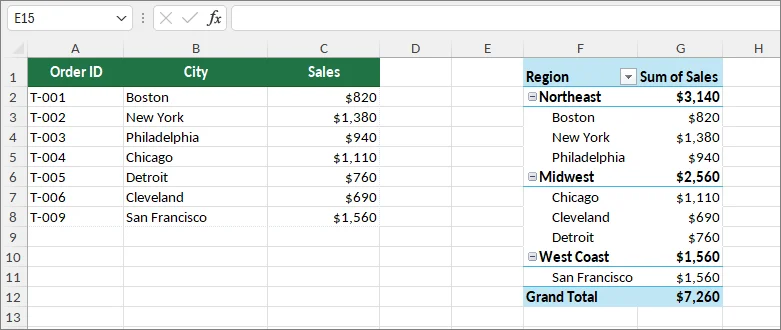
You can manually combine selected PivotTable items into custom categories.
- Select the PivotTable items you want to combine. Hold Ctrl (Windows) or Command (Mac) while selecting non-adjacent items.
- Right-click one of the selected items.
- Select Group.
- (Optional) Rename the generated group label by clicking on it (e.g., Group1) and typing your new category name into the Formula Bar at the top of Excel.
For example, several product or city names can be grouped into a broader regional category.
Troubleshooting: "Cannot Group That Selection" Error
This error usually occurs when the source field contains values Excel cannot group correctly. Common causes include:
- Blank cells
- Text values in a date or number field
-
Error values (
#N/A,#VALUE!, etc.) - Inconsistent data types
How to fix: Check the source field, correct or remove invalid values, refresh the PivotTable (Data > Refresh All), and try grouping again.
Automate Row Grouping Across Multiple Excel Files with Python
When working with dozens or hundreds of Excel workbooks—such as monthly financial models or regional sales reports—manually grouping rows in every single file is tedious and prone to human error. Using Python, you can apply the same row-grouping logic across multiple Excel files automatically.
The example below demonstrates how to programmatically create row groups and configure outline settings using Spire.XLS for Python.
Step 1: Install Required Library
Before running the script, install the document processing library via pip:
pip install Spire.XLS
Step 2: Python Script to Batch Group Rows in a Folder
The following script automatically loops through a specified directory, opens each Excel file, applies nested row grouping, and saves the updated files to an output folder:
import os
from spire.xls import *
from spire.xls.common import *

# Define input and output directory paths
input_folder = "./excel_files/"
output_folder = "./grouped_files/"

# Create output folder if it doesn't exist
if not os.path.exists(output_folder):
    os.makedirs(output_folder)

# Loop through all .xlsx files in the folder
for file_name in os.listdir(input_folder):
    if file_name.endswith(".xlsx"):
        file_path = os.path.join(input_folder, file_name)

        # Load workbook
        workbook = Workbook()
        workbook.LoadFromFile(file_path)

        # Access the target worksheet
        sheet = workbook.Worksheets[0]

        # Group rows 3 through 6 (Nested Sub-Group)
        sheet.GroupByRows(3, 6, False)

        # Group rows 2 through 10 (Parent Group)
        sheet.GroupByRows(2, 10, False)

        # Save the updated file to the output directory
        save_path = os.path.join(output_folder, file_name)
        workbook.SaveToFile(save_path, FileFormat.Version2016)

        # Release memory resources
        workbook.Dispose()

print("Batch row grouping completed successfully!")
Optional Advanced Group Settings in Python
You can also customize outline positions and collapse states programmatically during the batch process:
1. Change Expand/Collapse Button Direction
To align toggle buttons next to top summary rows instead of bottom rows, set the summary direction:
sheet.PageSetup.IsSummaryRowBelow = False
2. Collapse Groups by Default
To create grouped rows that are collapsed when the workbook opens, set the third parameter of GroupByRows() to True:
sheet.GroupByRows(2, 10, True)
3. Collapse an Existing Group
To collapse an existing row group, use the range-level collapse method:
sheet.Range["A2:A10"].CollapseGroup(GroupByType.ByRows)
Final Thoughts
Grouping rows in Excel is a simple way to make large worksheets easier to read and navigate.
Use:
- Group for manually organizing rows
- Subtotal for category-based summaries
- PivotTables for data analysis
- Python automation for repeated workflows
Choosing the right method depends on whether you need organization, calculations, analysis, or automation. Once you understand the differences, Excel row grouping becomes a practical tool for managing both small reports and large datasets.
FAQs
Can I Group Rows with the Same Value Automatically?
Yes. Sort by that value and use Subtotal when you also need summary rows. Auto Outline relies on existing summaries; it does not discover matching labels by itself. The Python example above uses predefined row ranges, not value-based detection.
Can I Group Rows Without Adding Subtotals?
Yes. Use the manual Group command. Summary formulas are optional for manual grouping.
Can I Group Rows in Excel for the Web?
Yes. Excel for the web supports row grouping, nested groups, and expanding or collapsing details. Some desktop outline settings, such as positioning summary rows, are not available in the web version.