Java (485)
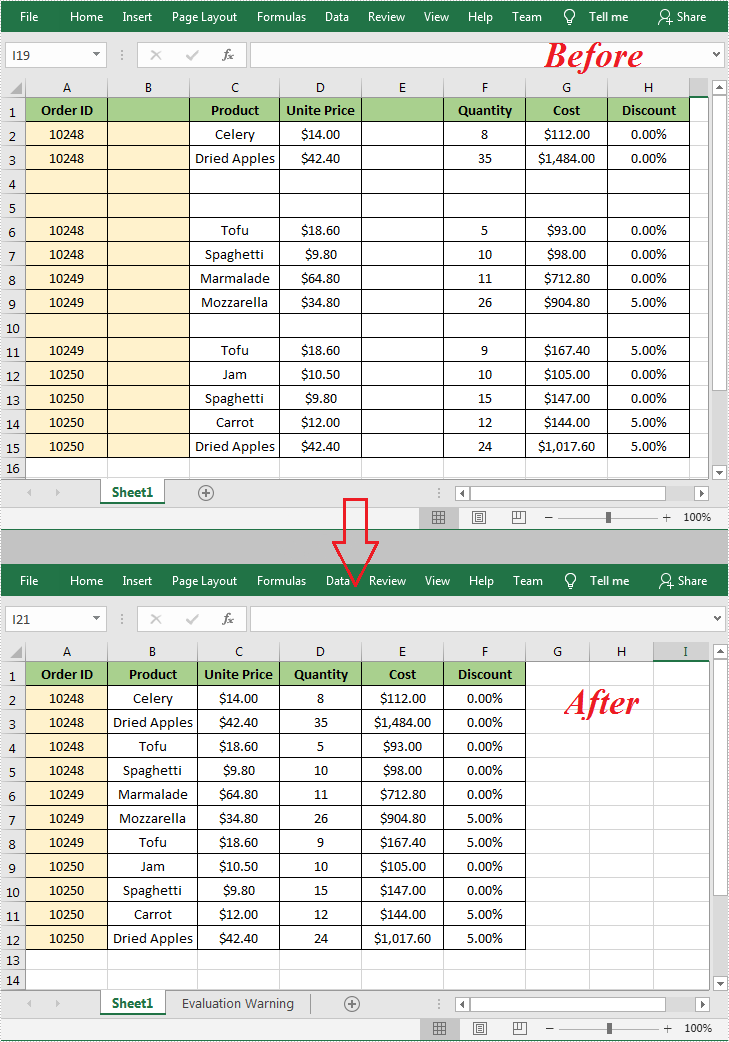
In Microsoft Excel, the blank rows or columns usually indicate the boundaries of data ranges. Therefore, if a blank row or blank column appears in the wrong place will prevent Excel from recognizing the data range correctly when applying some built-in features such as sorting, removing duplicates and subtotals. In such a case, you can delete the blank rows or columns to create a tidy dataset that fit for further processing and analysis. This article will introduce how to programmatically delete blank rows and columns in an Excel document using Spire.XLS for Java.
Install Spire.XLS for Java
First of all, you're required to add the Spire.Xls.jar file as a dependency in your Java program. The JAR file can be downloaded from this link. If you use Maven, you can easily import the JAR file in your application by adding the following code to your project's pom.xml file.
<repositories>
    <repository>
        <id>com.e-iceblue</id>
        <name>e-iceblue</name>
        <url>https://repo.e-iceblue.com/nexus/content/groups/public/</url>
    </repository>
</repositories>
<dependencies>
    <dependency>
        <groupId>e-iceblue</groupId>
        <artifactId>spire.xls</artifactId>
        <version>16.6.5</version>
    </dependency>
</dependencies>
Delete Blank Rows and Columns in Excel
The detailed steps are as follows.
- Create a Workbook object.
- Load a sample Excel document using Workbook.loadFromFile() method.
- Get a specified worksheet using Workbook.getWorksheets().get() method.
- Loop through all used rows in the specified worksheet and determine whether the row is blank using XlsRange.isBlank() method.
- Delete the blank rows using Worksheet.deleteRow() method.
- Loop through all used columns in the specified worksheet and determine whether the column is blank using XlsRange.isBlank() method.
- Delete the blank columns using Worksheet.deleteColumn() method.
- Save the result to another file using Workbook.saveToFile() method.
- Java
import com.spire.xls.ExcelVersion;
import com.spire.xls.Workbook;
import com.spire.xls.Worksheet;

public class DeleteBlankRowsAndColumns {

    public static void main(String[] args) {

        //Create a Workbook object.
        Workbook wb = new Workbook();

        //Load a sample Excel document
        wb.loadFromFile("sample.xlsx ");

        //Get the first worksheet
        Worksheet sheet = wb.getWorksheets().get(0);

        //Loop through all used rows
        for (int i = sheet.getLastRow(); i >= 1; i--)
        {
            //Detect if a row is blank
            if (sheet.getRows()[i-1].isBlank())
            {
                //Remove blank rows
                sheet.deleteRow(i);
            }
        }

        //Loop through all used columns
        for (int j = sheet.getLastColumn(); j >= 1; j--)
        {
            //Detect if a column is blank
            if (sheet.getColumns()[j-1].isBlank())
            {
                //Remove blank columns
                sheet.deleteColumn(j);
            }
        }

        //Save the document
        wb.saveToFile("DeleteBlankRowsAndColumns.xlsx", ExcelVersion.Version2016);
    }
}
Apply for a Temporary License
If you'd like to remove the evaluation message from the generated documents, or to get rid of the function limitations, please request a 30-day trial license for yourself.
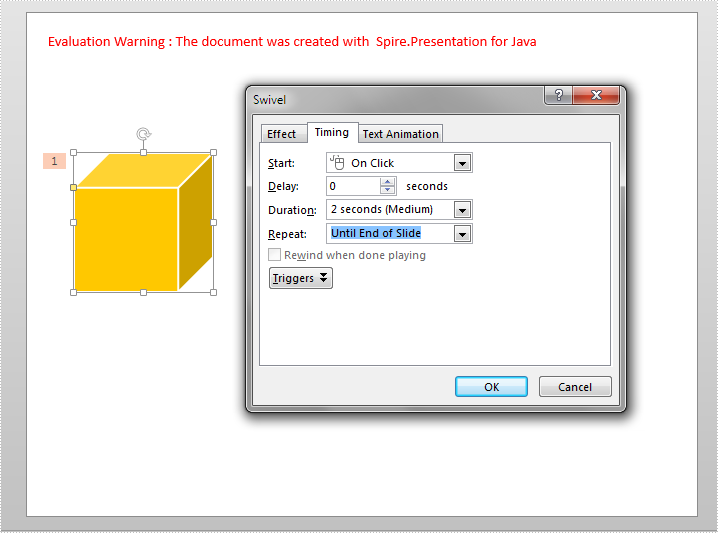
By default, an animation plays only one time and does not repeat. However, we can make the animation to play more than once by setting the repeat type of it. This article demonstrates how to accomplish this function using Spire.Presentation for Java.
import com.spire.presentation.*;
import com.spire.presentation.drawing.animation.AnimationEffect;

public class RepeatAnimation {
    public static void main(String[] args) throws Exception {
        //Create a Presentation instance
        Presentation ppt = new Presentation();
        //Load a PowerPoint document
        ppt.loadFromFile("Animation.pptx");

        //Get the first slide
        ISlide slide = ppt.getSlides().get(0);

        //Get the first animation effect on the slide
        AnimationEffect animation = slide.getTimeline().getMainSequence().get(0);
        //Set the animation effect to repeat forever until the end of slide.
        animation.getTiming().setAnimationRepeatType(AnimationRepeatType.UtilEndOfSlide);

        //Save the result document
        ppt.saveToFile("RepeatAnimation.pptx", FileFormat.PPTX_2013);
    }
}
Output:
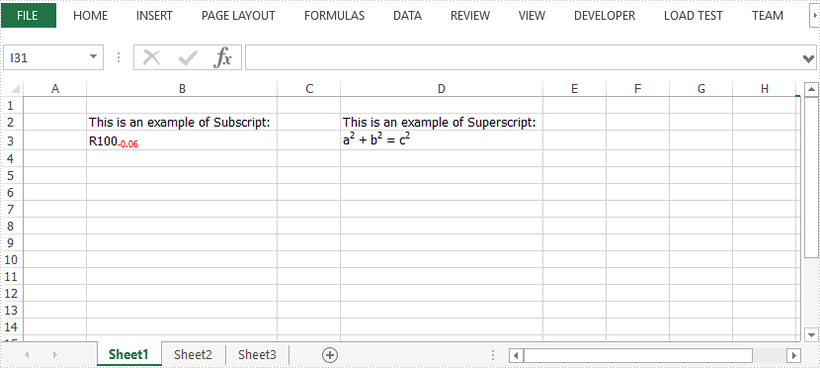
This article demonstrates how to insert subscript and superscript in an Excel document using Spire.XLS for Java.
import com.spire.xls.*;

import java.awt.*;

public class InsertSubscriptSuperscript {

    public static void main(String[] args) {

        //Create a Workbook instance
        Workbook workbook = new Workbook();

        //Get the first worksheet
        Worksheet sheet = workbook.getWorksheets().get(0);

        //Insert text to B2 and D2
        sheet.getCellRange("B2").setText("This is an example of Subscript:");
        sheet.getCellRange("D2").setText("This is an example of Superscript:");

        //Insert text to B3 and apply subscript effect
        CellRange range = sheet.getCellRange("B3");
        range.getRichText().setText("R100-0.06");
        ExcelFont font = workbook.createFont();
        font.isSubscript(true);
        font.setColor(Color.red);
        range.getRichText().setFont(4, 8, font);

        //Insert text to D3 and apply superscript effect
        range = sheet.getCellRange("D3");
        range.getRichText().setText("a2 + b2 = c2");
        font = workbook.createFont();
        font.isSuperscript(true);
        range.getRichText().setFont(1, 1, font);
        range.getRichText().setFont(6, 6, font);
        range.getRichText().setFont(11, 11, font);

        //Auto fit column width
        sheet.getAllocatedRange().autoFitColumns();

        //Save the docuemnt
        workbook.saveToFile("output/SubSuperScript.xlsx", ExcelVersion.Version2016);
    }
}