Java (485)
PDF file format makes the presentation of documents consistent across devices. However, when you need to put PDF documents on web pages, it's better to convert them to HTML files. In this way, all the content of your document can be displayed in the browser directly, with no need for downloading files. And the loading of large PDF documents takes a long time, while HTML files can be rendered in the browser very quickly. In addition, compared to PDF files, it is much easier for search engines to crawl HTML web pages to get information, which will give your website more exposure. This article will show how to convert PDF documents into HTML files in Java using Spire.PDF for Java.
- Convert a PDF document to an HTML file in Java
- Convert a PDF document to an HTML file with SVG Embedded
- Convert a PDF document to HTML Stream in Java
Install Spire.PDF for Java
First of all, you're required to add the Spire.Pdf.jar file as a dependency in your Java program. The JAR file can be downloaded from this link. If you use Maven, you can easily import the JAR file in your application by adding the following code to your project's pom.xml file.
<repositories>
    <repository>
        <id>com.e-iceblue</id>
        <name>e-iceblue</name>
        <url>https://repo.e-iceblue.com/nexus/content/groups/public/</url>
    </repository>
</repositories>
<dependencies>
    <dependency>
        <groupId>e-iceblue</groupId>
        <artifactId>spire.pdf</artifactId>
        <version>12.7.0</version>
    </dependency>
</dependencies>
Convert a PDF document to an HTML file in Java
The conversion from a PDF document to an HTML file can be directly done by loading a PDF document and saving it as an HTML file using PdfDocument.saveToFile(String filename, FileFormat.HTML) method provided by Spire.PDF for Java. The detailed steps are as follows.
- Create an object of PdfDocument.
- Load a PDF file using PdfDocument.loadFromFile() method.
- Save the PDF file as an HTML file using PdfDocument.saveToFle() method.
- Java
Java
import com.spire.pdf.*;

public class convertPDFToHTML {
    public static void main(String[] args) {

        //Create an object of PdfDocument
        PdfDocument pdf = new PdfDocument();

        //Load a PDF file
        pdf.loadFromFile("C:/Guide to a Foreign Past.pdf");

        //Save the PDF file as an HTML file
        pdf.saveToFile("PDFToHTML.html",FileFormat.HTML);
        pdf.close();
    }
}
Convert a PDF document to an HTML file with SVG Embedded
Spire.PDF for Java also provides the PdfDocument.getConvertOptions().setPdfToHtmlOptions(true) method to enable embedding SVG while converting. The detailed steps for converting a PDF file to an HTML file with SVG embedded are as follows.
- Create an object of PdfDocument.
- Load a PDF file using PdfDocument.loadFromFile() method.
- Enable embedding SVG using PdfDocument.getConvertOptions().setPdfToHtmlOptions(true) method.
- Save the PDF file as an HTML file using PdfDocument.saveToFle() method.
- Java
import com.spire.pdf.*;

public class convertPDFToHTMLEmbeddingSVG {
    public static void main(String[] args) {

        //Create an object of PdfDocument
        PdfDocument doc = new PdfDocument();

        //Load a PDF file
        doc.loadFromFile("C:/Guide to a Foreign Past.pdf");

        //Set embedding SVG
        doc.getConvertOptions().setPdfToHtmlOptions(true);

        //Save the PDF file as an HTML file
        doc.saveToFile("PDFToHTMLEmbeddingSVG.html", FileFormat.HTML);
        doc.close();
    }
}
Convert a PDF document to HTML Stream in Java
Spire.PDF for Java also supports converting PDF documents to HTML stream. The detailed steps are as follows.
- Create an object of PdfDocument.
- Load a PDF file using PdfDocument.loadFromFile() method.
- Save the PDF file as HTML stream using PdfDocument.saveToStream() method.
- Java
import com.spire.pdf.*;

import java.io.*;


public class convertPDFToHTMLStream {
    public static void main(String[] args) throws FileNotFoundException {

        //Create an object of PdfDocument
        PdfDocument pdf = new PdfDocument();

        //Load a PDF file
        pdf.loadFromFile("C:/Guide to a Foreign Past.pdf");

        //Save the PDF file as HTML stream
        File outFile = new File("PDFToHTMLStream.html");
        OutputStream outputStream = new FileOutputStream(outFile);
        pdf.saveToStream(outputStream, FileFormat.HTML);
        pdf.close();
    }
}

Apply for a Temporary License
If you'd like to remove the evaluation message from the generated documents, or to get rid of the function limitations, please request a 30-day trial license for yourself.
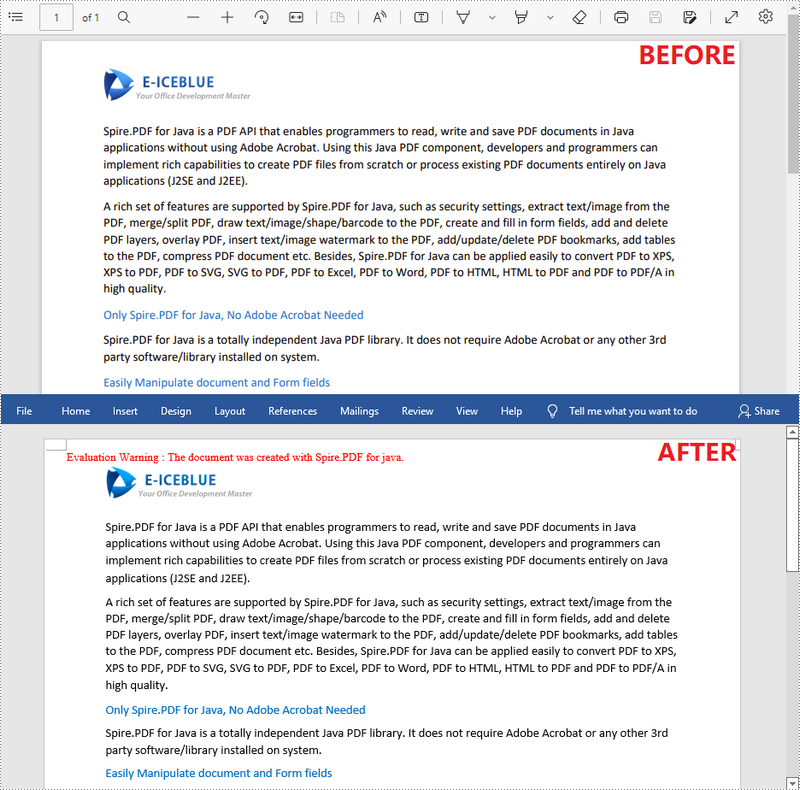
Nowadays, it is not difficult to convert PDF documents into Word files using a software. However, if you want to maintain the layout and even the font formatting while converting, it is not something that every software can accomplish. Spire.PDF for Java does it well and offers you the following two modes when converting PDF to Word in Java.
Fixed Layout mode has fast conversion speed and is conducive to maintaining the original appearance of PDF files to the greatest extent. However, the editability of the resulting document will be limited since each line of text in PDF will be presented in a separate frame in the generated Word document.
Flowable Structure is a full recognition mode. The converted content will not be presented in frames, and the structure of the resulting document is flowable. The generated Word document is easy to re-edit but may look different from the original PDF file.
Install Spire.PDF for Java
First, you're required to add the Spire.Pdf.jar file as a dependency in your Java program. The JAR file can be downloaded from this link. If you use Maven, you can easily import the JAR file in your application by adding the following code to your project's pom.xml file.
<repositories>
    <repository>
        <id>com.e-iceblue</id>
        <name>e-iceblue</name>
        <url>https://repo.e-iceblue.com/nexus/content/groups/public/</url>
    </repository>
</repositories>
<dependencies>
    <dependency>
        <groupId>e-iceblue</groupId>
        <artifactId>spire.pdf</artifactId>
        <version>12.7.0</version>
    </dependency>
</dependencies>
Convert PDF to Doc/Docx with Fixed Layout
The following are the steps to convert PDF to Doc or Docx with fixed layout.
- Create a PdfDocument object.
- Load a PDF file using PdfDocument.loadFromFile() method.
- Convert the PDF document to a Doc or Docx format file using PdfDocument.saveToFile(String fileName, FileFormat fileFormat) method.
- Java
import com.spire.pdf.FileFormat;
import com.spire.pdf.PdfDocument;

public class ConvertPdfToWordWithFixedLayout {

    public static void main(String[] args) {

        //Create a PdfDocument object
        PdfDocument doc = new PdfDocument();

        //Load a sample PDF document
        doc.loadFromFile("C:\\Users\\Administrator\\Desktop\\sample.pdf");

        //Convert PDF to Doc and save it to a specified path
        doc.saveToFile("output/ToDoc.doc", FileFormat.DOC);

        //Convert PDF to Docx and save it to a specified path
        doc.saveToFile("output/ToDocx.docx", FileFormat.DOCX);
        doc.close();
    }
}
Convert PDF to Doc/Docx with Flowable Structure
The following are the steps to convert PDF to Doc or Docx with flowable structure.
- Create a PdfDocument object.
- Load a PDF file using PdfDocument.loadFromFile() method.
- Set the conversion mode as flow using PdfDocument. getConvertOptions().setConvertToWordUsingFlow() method.
- Convert the PDF document to a Doc or Docx format file using PdfDocument.saveToFile(String fileName, FileFormat fileFormat) method.
- Java
import com.spire.pdf.FileFormat;
import com.spire.pdf.PdfDocument;

public class ConvertPdfToWordWithFlowableStructure {

    public static void main(String[] args) {

        //Create a PdfDocument object
        PdfDocument doc = new PdfDocument();

        //Load a sample PDF document
        doc.loadFromFile("C:\\Users\\Administrator\\Desktop\\sample.pdf");

        //Convert PDF to Word with flowable structure
        doc.getConvertOptions().setConvertToWordUsingFlow(true);

        //Convert PDF to Doc
        doc.saveToFile("output/ToDoc.doc", FileFormat.DOC);

        //Convert PDF to Docx
        doc.saveToFile("output/ToDocx.docx", FileFormat.DOCX);
        doc.close();
    }
}
Apply for a Temporary License
If you'd like to remove the evaluation message from the generated documents, or to get rid of the function limitations, please request a 30-day trial license for yourself.
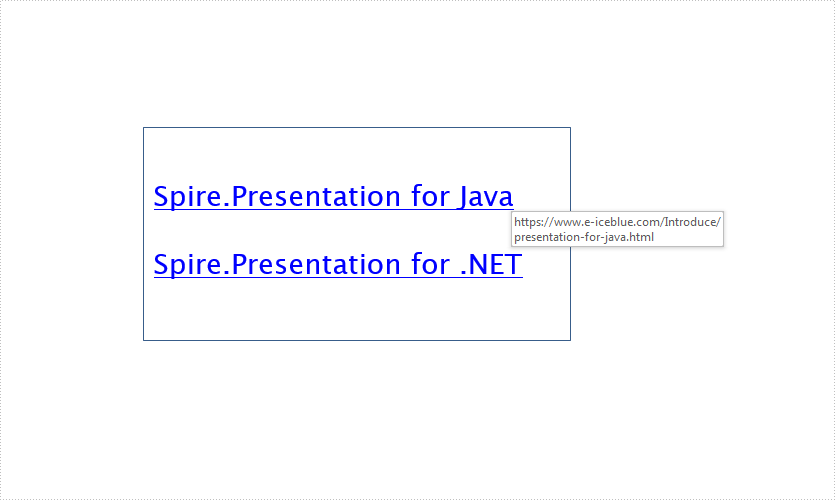
This article demonstrate how to add hyperlinks to a PowerPoint slide using Spire.Presentation for Java.
import com.spire.presentation.*;
import com.spire.presentation.drawing.FillFormatType;

import java.awt.geom.Rectangle2D;

public class AddHyperlink {
    public static void main(String[] args) throws Exception {
        //Create a Presentation instance
        Presentation presentation = new Presentation();

        //Add a shape
        Rectangle2D.Double rec = new Rectangle2D.Double(presentation.getSlideSize().getSize().getWidth() / 2 - 255, 120, 300, 150);
        IAutoShape shape = presentation.getSlides().get(0).getShapes().appendShape(ShapeType.RECTANGLE, rec);
        shape.getFill().setFillType(FillFormatType.NONE);
        shape.getLine().setWidth(0);
        shape.getTextFrame().getParagraphs().clear();

        //Add some paragraphs with hyperlinks to the shape
        ParagraphEx para1 = new ParagraphEx();
        PortionEx tr1 = new PortionEx();
        tr1.setText("Spire.Presentation for Java");
        tr1.getClickAction().setAddress("https://www.e-iceblue.com/Introduce/presentation-for-java.html");
        tr1.setLatinFont(new TextFont("Lucida Sans Unicode"));
        tr1.setFontHeight(20);
        para1.getTextRanges().append(tr1);
        shape.getTextFrame().getParagraphs().append(para1);
        shape.getTextFrame().getParagraphs().append(new ParagraphEx());

        ParagraphEx para2 = new ParagraphEx();
        PortionEx tr2 = new PortionEx();
        tr2.setText("Spire.Presentation for .NET");
        tr2.getClickAction().setAddress("https://www.e-iceblue.com/Introduce/presentation-for-net-introduce.html");
        tr2.setLatinFont(new TextFont("Lucida Sans Unicode"));
        tr2.setFontHeight(20);
        para2.getTextRanges().append(tr2);
        shape.getTextFrame().getParagraphs().append(para2);

        //Save the document
        presentation.saveToFile("AddHyperlink.pptx", FileFormat.PPTX_2010);
    }
}
Output: