
.NET (1327)
Children categories
How to Convert a word processing document from the DOCM to the DOCX file format
2016-01-13 07:50:45 Written by Koohji
class Program
    {
        static void Main(string[] args)
        {
            string filename = "WithMacros.docm";
            ConvertDOCMtoDOCX(filename);
        }
        // Given a .docm file (with macro storage), remove the VBA
        // project, reset the document type, and save the document with a new name.
        public static void ConvertDOCMtoDOCX(string fileName)
        {
            bool fileChanged = false;

            using (WordprocessingDocument document =
                WordprocessingDocument.Open(fileName, true))
            {
                // Access the main document part.
                var docPart = document.MainDocumentPart;

                // Look for the vbaProject part. If it is there, delete it.
                var vbaPart = docPart.VbaProjectPart;
                if (vbaPart != null)
                {
                    // Delete the vbaProject part and then save the document.
                    docPart.DeletePart(vbaPart);
                    docPart.Document.Save();

                    // Change the document type to
                    // not macro-enabled.
                    document.ChangeDocumentType(
                        WordprocessingDocumentType.Document);

                    // Track that the document has been changed.
                    fileChanged = true;
                }
            }

            // If anything goes wrong in this file handling,
            // the code will raise an exception back to the caller.
            if (fileChanged)
            {
                // Create the new .docx filename.
                var newFileName = Path.ChangeExtension(fileName, ".docx");

                // If it already exists, it will be deleted!
                if (File.Exists(newFileName))
                {
                    File.Delete(newFileName);
                }

                // Rename the file.
                File.Move(fileName, newFileName);
            }
        }
    }
class Program
    {
        static void Main(string[] args)
        {
            string fileName = "Word10.docx";
            CreateTable(fileName);
        }
        // Insert a table into a word processing document.
        public static void CreateTable(string fileName)
        {
            using (WordprocessingDocument doc = WordprocessingDocument.Create(fileName, WordprocessingDocumentType.Document))
            {
                MainDocumentPart mainPart = doc.AddMainDocumentPart();
                mainPart.Document = new Document();
                Body body = mainPart.Document.AppendChild(new Body());
                Table tb = new Table();
                TableRow row = new TableRow();
                TableCell cel = new TableCell(new Paragraph(new Run(new Text("OpenXML"))));
                row.AppendChild(cel);
                tb.AppendChild(row);
                body.Append(tb);
            }
        }
class Program
    {
        static void Main(string[] args)
        {
            string docName = "OpenXML.docx";
            string authorName = "Gary zhang";
            AcceptRevisions(docName, authorName);
        }
        public static void AcceptRevisions(string fileName, string authorName)
        {
            // Given a document name and an author name, accept revisions.
            using (WordprocessingDocument wdDoc = WordprocessingDocument.Open(fileName, true))
            {
                Body body = wdDoc.MainDocumentPart.Document.Body;

                // Handle the formatting changes.
                List changes =
                    body.Descendants()
                    .Where(c => c.Author.Value == authorName).Cast().ToList();

                foreach (OpenXmlElement change in changes)
                {
                    change.Remove();
                }

                // Handle the deletions.
                List deletions =
                    body.Descendants()
                    .Where(c => c.Author.Value == authorName).Cast().ToList();

                deletions.AddRange(body.Descendants()
                    .Where(c => c.Author.Value == authorName).Cast().ToList());

                deletions.AddRange(body.Descendants()
                    .Where(c => c.Author.Value == authorName).Cast().ToList());

                foreach (OpenXmlElement deletion in deletions)
                {
                    deletion.Remove();
                }

                // Handle the insertions.
                List insertions =
                    body.Descendants()
                    .Where(c => c.Author.Value == authorName).Cast().ToList();

                insertions.AddRange(body.Descendants()
                    .Where(c => c.Author.Value == authorName).Cast().ToList());

                insertions.AddRange(body.Descendants()
                    .Where(c => c.Author.Value == authorName).Cast().ToList());

                foreach (OpenXmlElement insertion in insertions)
                {
                    // Found new content.
                    // Promote them to the same level as node, and then delete the node.
                    foreach (var run in insertion.Elements())
                    {
                        if (run == insertion.FirstChild)
                        {
                            insertion.InsertAfterSelf(new Run(run.OuterXml));
                        }
                        else
                        {
                            insertion.NextSibling().InsertAfterSelf(new Run(run.OuterXml));
                        }
                    }
                    insertion.RemoveAttribute("rsidR",
                        "http://schemas.openxmlformats.org/wordprocessingml/2006/main");
                    insertion.RemoveAttribute("rsidRPr",
                        "http://schemas.openxmlformats.org/wordprocessingml/2006/main");
                    insertion.Remove();
                }
            }
        }
    }
class Program
{
static void Main(string[] args)
{
	CreateWordprocessingDocument("Create a word processing document.doc");
}
public static void CreateWordprocessingDocument(string filepath)
{
	// Create a document by supplying the filepath.
	using (WordprocessingDocument wordDocument =
		WordprocessingDocument.Create(filepath, WordprocessingDocumentType.Document))
	{
		// Add a main document part.
		MainDocumentPart mainPart = wordDocument.AddMainDocumentPart();

		// Create the document structure and add some text.
		mainPart.Document = new Document();
		Body body = mainPart.Document.AppendChild(new Body());
		Paragraph para = body.AppendChild(new Paragraph());
		Run run = para.AppendChild(new Run());
		run.AppendChild(new Text("Create text in body - CreateWordprocessingDocument"));
	}
}
}
Spire.PDF is a PDF component which contains an incredible wealth of features to create, read, edit and manipulate PDF documents on .NET, Silverlight and WPF Platform. As an independent PDF library, it does not need users to install Adobe Acrobat or any other third party libraries. Spire.PDF for .NET is completely written in C#, but also supports VB.NET, Windows Forms and ASP.NET Applications.
With the Spire.PDF API, developers can quickly save webpage as PDF even there are dynamic content on the webpage, image of different formats and text file all can be automatically compressed to PDF. When read PDF document, text written from right to left such as Herbrew and Arabic can be extracted in minutes. Below sections are designed to provide you functions in detail. Hope it can help you.
Extract/Read |
Image |
Header and Footer |
|
Attachments |
|
Annotation |
Spire.XLS is a versatile Excel library that is designed for software developers to perform a wide range of Excel processing tasks on .NET, Silverlight and WPF Platform. As a combination of APIs and GUI controls, Spire.XLS does not need to install MS Excel or any third party libraries and supports to apply Excel on the formats of either Excel .xls 97-2003 or Excel .xlsx 2007, 2010 and 2013.
This API gives developers powerful tools for performing simple tasks as well as more complex tasks. Basic operation tasks such as create, save, protect and merge Excel files, add/delete/hide worksheets, edit spreadsheet cell data, generate charts can be all realized with high efficiency.
Document Operation |
|
Header and Footer |
|
Spire.Doc, specially designed for developers/programmers to manipulate word proceeding tasks, from Word version 97-2003 to 2010 and 2013 in .NET, Silverlight and WPF Platform, always welcomes any kind of evaluation or test from either organizations or individuals with no charges.
This professional word component enables users to perform a large range of tasks on Word, as document operation (create, open, edit and save), mail merge, security, format (font, paragraph and page settings), objects (text, image, hyperlink, comment, table, bookmark, header/footer, footnote/endnote etc.). The conversion feature stands out of the peers, which enables developers to realize conversion between most popular formats with high fidelity, including Word to PDF, HTML, RTF, XML, Image formats, TEXT and RTF, XML and HTML files also can be converted to Word back. The following sections have been well-organized to show you how these functions work in detail.
Document Operation |
|
Image and Shape |
|
Bookmark |
|
Header and Footer |
Footnote |
Adding a stamp to a PDF document can enhance its visual appeal and convey important information, such as approval, confidentiality, or urgency. This simple process allows users to mark documents with customized images or text, making it easier to communicate key messages. Whether for professional use or personal projects, stamping PDFs ensures clarity and adds a professional touch.
In this article, you will learn how to add a stamp to a PDF document using C# with Spire.PDF for .NET.
Install Spire.PDF for .NET
To begin with, you need to add the DLL files included in the Spire.PDF for .NET package as references in your .NET project. The DLL files can be either downloaded from this link or installed via NuGet.
PM> Install-Package Spire.PDF
Prerequisite Knowledge
In a PDF, a stamp is an annotation or graphical element that adds supplementary information to a document. Spire.PDF for .NET includes the PdfRubberStampAnnotation class, which represents a rubber stamp. To create the appearance for the rubber stamp, you can use the PdfTemplate class, which serves as a canvas for drawing text, images, shapes, and date/time elements.
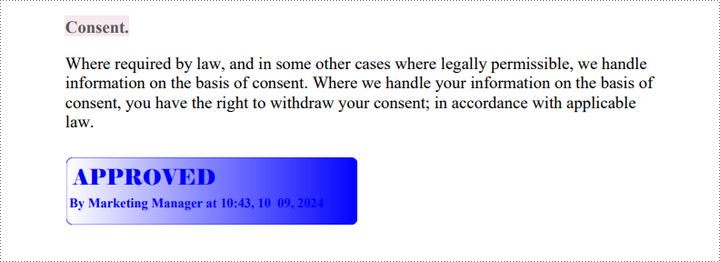
Add a Dynamic Stamp to PDF in C#
A dynamic stamp is a customizable annotation added to a PDF document to convey specific statuses, approvals, or other information. Unlike static stamps, dynamic stamps include variables or fields that can be updated in real time, such as the current date, time, username, or other custom data.
Here are the steps to add a dynamic stamp to a PDF using Spire.PDF for .NET:
- Create a PdfDocument object.
- Load a PDF file using PdfDocument.LoadFromFile() method.
- Create a PdfTemplate object with the desired size.
- Draw strings, including dynamic information like date and time, on the template using PdfTemplate.Graphics.DrawString().
- Create a PdfRubberStampAnnotation object and set the template as its appearance.
- Add the stamp to a specific PDF page using PdfPageBase.Annotations.Add() method.
- Save the document to a different PDF file.
- C#
using System.Drawing;
using Spire.Pdf;
using Spire.Pdf.Graphics;
using Spire.Pdf.Annotations;
using Spire.Pdf.Annotations.Appearance;

namespace AddDynamicStamp
{
    class Program
    {
        static void Main(string[] args)
        {
            // Create a PdfDocument object
            PdfDocument doc = new PdfDocument();

            // Load a PDF document
            doc.LoadFromFile("C:\\Users\\Administrator\\Desktop\\input.pdf");

            // Get a specific page
            PdfPageBase page = doc.Pages[1];

            // Create a PdfTemplate object
            PdfTemplate template = new PdfTemplate(220, 50);

            // Create two fonts
            PdfTrueTypeFont font1 = new PdfTrueTypeFont(new Font("Elephant", 16f, FontStyle.Bold),true);
            PdfTrueTypeFont font2 = new PdfTrueTypeFont(new Font("Times New Roman", 10f, FontStyle.Bold),true);

            // Create a solid brush and a gradient brush
            PdfSolidBrush solidBrush = new PdfSolidBrush(Color.Blue);
            RectangleF rectangle1 = new RectangleF(new PointF(0, 0), template.Size);
            PdfLinearGradientBrush linearGradientBrush = new PdfLinearGradientBrush(rectangle1, new PdfRGBColor(Color.White), new PdfRGBColor(Color.Blue), PdfLinearGradientMode.Horizontal);

            // Create a pen
            PdfPen pen = new PdfPen(solidBrush);

            // Create a rounded rectangle path
            int CornerRadius = 10;
            PdfPath path = new PdfPath();
            path.AddArc(template.GetBounds().X, template.GetBounds().Y, CornerRadius, CornerRadius, 180, 90);
            path.AddArc(template.GetBounds().X + template.Width - CornerRadius, template.GetBounds().Y, CornerRadius, CornerRadius, 270, 90);
            path.AddArc(template.GetBounds().X + template.Width - CornerRadius, template.GetBounds().Y + template.Height - CornerRadius, CornerRadius, CornerRadius, 0, 90);
            path.AddArc(template.GetBounds().X, template.GetBounds().Y + template.Height - CornerRadius, CornerRadius, CornerRadius, 90, 90);
            path.AddLine(template.GetBounds().X, template.GetBounds().Y + template.Height - CornerRadius, template.GetBounds().X, template.GetBounds().Y + CornerRadius / 2);

            // Draw path on the template
            template.Graphics.DrawPath(pen, path);
            template.Graphics.DrawPath(linearGradientBrush, path);

            // Draw text on the template
            String string1 = "APPROVED\n";
            String string2 = "By Marketing Manager at " + DateTime.Now.ToString("HH:mm, MMM dd, yyyy");
            template.Graphics.DrawString(string1, font1, solidBrush, new PointF(5, 5));
            template.Graphics.DrawString(string2, font2, solidBrush, new PointF(2, 28));

            // Create a rubber stamp, specifying its size and location
            RectangleF rectangle2 = new RectangleF(55, page.ActualSize.Height - 55 - 70, 240, 55);
            PdfRubberStampAnnotation stamp = new PdfRubberStampAnnotation(rectangle2);

            // Create a PdfAppearance object and apply the template as its normal state
            PdfAppearance apprearance = new PdfAppearance(stamp);
            apprearance.Normal = template;

            // Apply the appearance to stamp
            stamp.Appearance = apprearance;

            // Add the stamp annotation to annotation collection
            page.Annotations.Add(stamp);

            // Save the file
            doc.SaveToFile("DynamicStamp.pdf", FileFormat.PDF);

            // Dispose resources
            doc.Dispose();
        }
    }
}
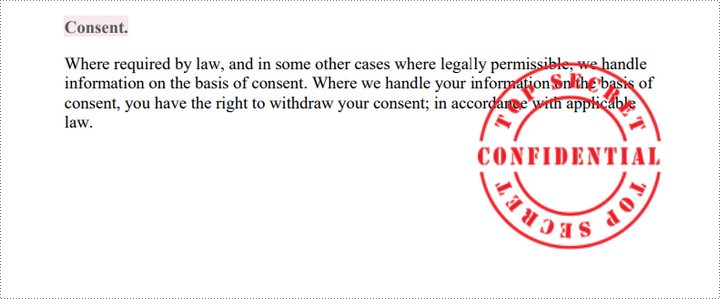
Add an Image Stamp to PDF in C#
An image stamp in a PDF is a graphical element that is added to a document as an annotation or overlay. This stamp typically consists of an image that can be positioned at a specific location on a PDF page.
Here are the steps to add an image stamp to a PDF using Spire.PDF for .NET:
- Create a PdfDocument object.
- Load a PDF file using PdfDocument.LoadFromFile() method.
- Create a PdfTemplate object with the desired size.
- Draw strings, including dynamic information like date and time, on the template using PdfTemplate.Graphics.DrawString().
- Create a PdfRubberStampAnnotation object and set the template as its appearance.
- Add the stamp to a specific PDF page using PdfPageBase.Annotations.Add() method.
- Save the document to a different PDF file.
- C#
using Spire.Pdf;
using Spire.Pdf.Annotations;
using Spire.Pdf.Annotations.Appearance;
using Spire.Pdf.Graphics;
using System.Drawing;

namespace AddImageStamp
{
    class Program
    {
        static void Main(string[] args)
        {
            // Create a PdfDocument object
            PdfDocument doc = new PdfDocument();

            // Load a PDF document
            doc.LoadFromFile("C:\\Users\\Administrator\\Desktop\\input.pdf");

            // Get a specific page
            PdfPageBase page = doc.Pages[1];

            // Load an image file
            PdfImage image = PdfImage.FromFile("C:\\Users\\Administrator\\Desktop\\confidential.png");

            // Get the width and height of the image
            int width = image.Width;
            int height = image.Height;

            // Create a PdfTemplate object based on the size of the image
            PdfTemplate template = new PdfTemplate(width, height, true);

            // Draw image on the template
            template.Graphics.DrawImage(image, 0, 0, width, height);

            // Create a rubber stamp annotation, specifying its location and position
            RectangleF rect = new RectangleF(page.ActualSize.Width - width - 50, page.ActualSize.Height - height - 50, width, height);
            PdfRubberStampAnnotation stamp = new PdfRubberStampAnnotation(rect);

            // Create a PdfAppearance object
            PdfAppearance pdfAppearance = new PdfAppearance(stamp);

            // Set the template as the normal state of the appearance
            pdfAppearance.Normal = template;

            // Apply the appearance to the stamp
            stamp.Appearance = pdfAppearance;

            // Add the stamp annotation to PDF
            page.Annotations.Add(stamp);

            // Save the file
            doc.SaveToFile("ImageStamp.pdf");

            // Dispose resources
            doc.Dispose();
        }
    }
}
Apply for a Temporary License
If you'd like to remove the evaluation message from the generated documents, or to get rid of the function limitations, please request a 30-day trial license for yourself.
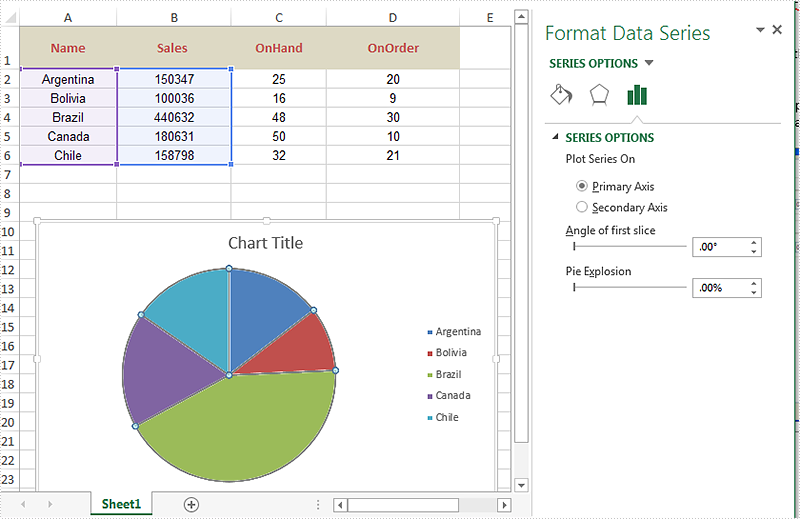
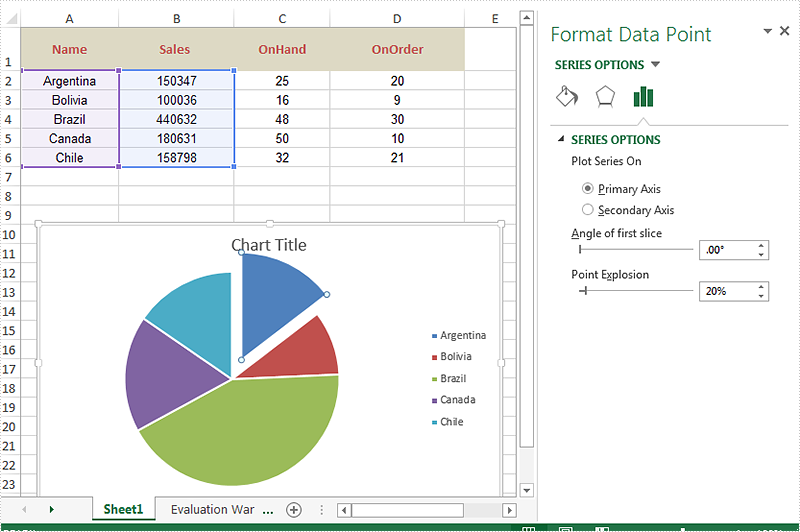
When we work with Excel pie chart, we may need to separate each part of pie chart to make them stand out. Spire.XLS offers a property of Series.DataFormat.Percent to enable developers to pull the whole pie apart. It also offers a property of Series.DataPoints.DataFormat.Percent to pull apart a single slice from the whole pie chart.
This article is going to introduce the method of how to set the separation width between slices in pie chart in C# by using Spire.XLS.
On MS Excel, We can adjust the percentage of "Pie Explosion" on the Series Options at the "format data series" area to control the width between each section in the chart.
Code Snippet of how to set the separation width between slices in pie chart.
using Spire.Xls;
namespace ExplodePieChart
{
class Program
{
static void Main(string[] args)
{
Workbook workbook = new Workbook();
workbook.LoadFromFile("Sample.xlsx");
Worksheet ws = workbook.Worksheets[0];
Chart chart = ws.Charts[0];
// Set the separation width between slices in pie chart.
for (int i = 0; i < chart.Series.Count; i++)
{
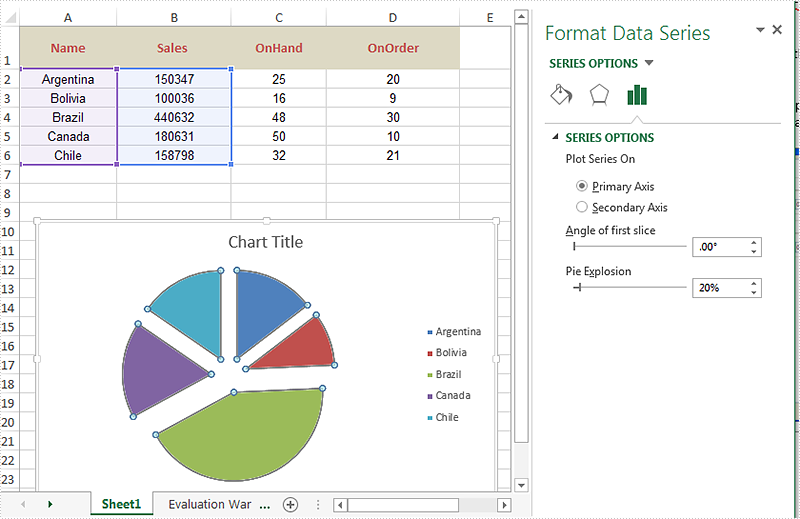
chart.Series[i].DataFormat.Percent = 20;
}
workbook.SaveToFile("result.xlsx", ExcelVersion.Version2010);
}
}
}
Effective screenshot after pull the whole pie apart.
Code Snippet of how to split a single slice from the whole pie chart.
using Spire.Xls;
namespace ExplodePieChart
{

    class Program
    {

        static void Main(string[] args)
        {
            {
                Workbook workbook = new Workbook();
                workbook.LoadFromFile("Sample.xlsx");

                Worksheet ws = workbook.Worksheets[0];
                Chart chart = ws.Charts[0];

                chart.Series[0].DataPoints[0].DataFormat.Percent = 20;

                workbook.SaveToFile("ExplodePieChart.xlsx", ExcelVersion.Version2013);
            }


        }
    }
}
Effective screenshot after pull a single part from the pie chart apart.
How to Set the Play Mode for Video in PowerPoint using C#, VB.NET
2016-01-04 03:15:56 Written by KoohjiVideo is often used to create a more attractive and interesting effect in PowerPoint, there are two modes to play video in PowerPoint: on click and automatically. In general, the video would be played by clicking on it, people who want to play the video automatically needs to set the default play mode as auto style. This article will demonstrate how to set the play mode for video in PowerPoint using C#, VB.NET.
Note: Before start, please download and install Spire.Presentation correctly, after that add the Spire.Presentation.dll file as the reference of your project.
Detail steps overview:
Step 1: Initialize a new presentation instance and load the original document from file.
Presentation presentation = new Presentation();
presentation.LoadFromFile(@"C:\Users\Administrator\Desktop\Sample.pptx");
Step 2: Find the video by looping through all the slides and set its play mode as auto.
foreach (ISlide slide in presentation.Slides)
{
    foreach (IShape shape in slide.Shapes)
        {
            if (shape is IVideo)
            {
                (shape as IVideo).PlayMode = VideoPlayMode.Auto;
            }
        }
}
Step 3: Save the file as Video.pptx.
presentation.SaveToFile("Video.pptx", FileFormat.Pptx2010);
Full codes:
using Spire.Presentation;

namespace Set_Video_Play_Mode
{
    class Program
    {
        static void Main(string[] args)
        {
            Presentation presentation = new Presentation();
            presentation.LoadFromFile(@"C:\Users\Administrator\Desktop\Sample.pptx");
            foreach (ISlide slide in presentation.Slides)
            {
                foreach (IShape shape in slide.Shapes)
                {
                    if (shape is IVideo)
                    {
                        (shape as IVideo).PlayMode = VideoPlayMode.Auto;
                    }
                }
            }
            presentation.SaveToFile("Video.pptx", FileFormat.Pptx2010);
        }
    }
}
Imports Spire.Presentation
Namespace Set_Video_Play_Mode
	Class Program
		Private Shared Sub Main(args As String())
			Dim presentation As New Presentation()
	presentation.LoadFromFile("C:\Users\Administrator\Desktop\Sample.pptx")
			For Each slide As ISlide In presentation.Slides
				For Each shape As IShape In slide.Shapes
					If TypeOf shape Is IVideo Then
						TryCast(shape, IVideo).PlayMode = VideoPlayMode.Auto
					End If
				Next
			Next
			presentation.SaveToFile("Video.pptx", FileFormat.Pptx2010)
		End Sub
	End Class
End Namespace
If you couldn't use Spire.Presentation successfully, please refer the Spire.Presentation Quick Start which will guide you to quickly use the Spire.Presentation.
