Knowledgebase (2370)
Children categories
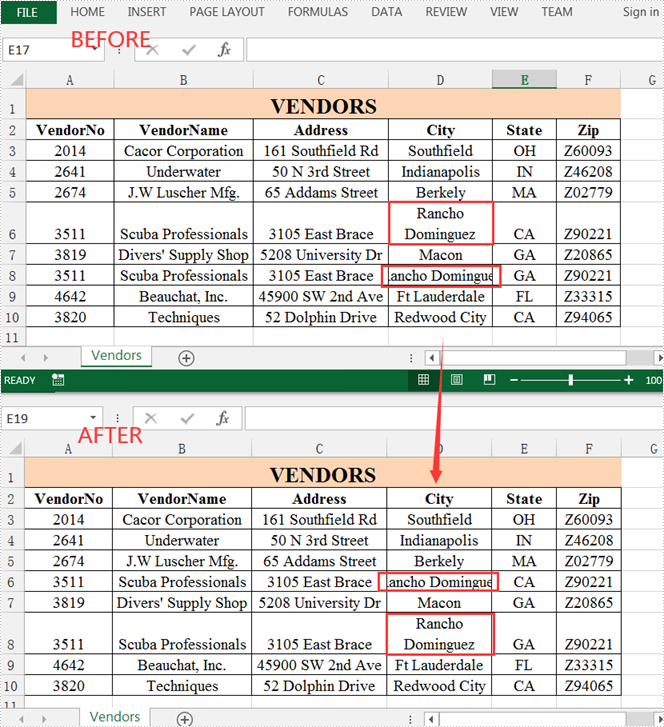
In the process of manipulating Excel worksheets, sometimes you may encounter the situation where the text in a cell is so long that some of it is hidden. At this time, it’s recommended to wrap the extra-long text into multiple lines so you can see it all. This article will demonstrate how to programmatically wrap or unwrap text in Excel cells using Spire.XLS for Java.
Install Spire.XLS for Java
First of all, you're required to add the Spire.Xls.jar file as a dependency in your Java program. The JAR file can be downloaded from this link. If you use Maven, you can easily import the JAR file in your application by adding the following code to your project's pom.xml file.
<repositories>
    <repository>
        <id>com.e-iceblue</id>
        <name>e-iceblue</name>
        <url>https://repo.e-iceblue.com/nexus/content/groups/public/</url>
    </repository>
</repositories>
<dependencies>
    <dependency>
        <groupId>e-iceblue</groupId>
        <artifactId>spire.xls</artifactId>
        <version>16.7.3</version>
    </dependency>
</dependencies>
Wrap or Unwrap Text in Excel cells
Spire.XLS for Java supports wrapping or unwrapping text in Excel cells using the setWrapText() method provided by the IStyle interface. Below are detailed steps for your reference.
- Create a Workbook instance.
- Load a sample Excel document using Workbook.loadFromFile() method.
- Get a specific worksheet of the document using Workbook.getWorksheets().get() method.
- Get a specific cell of the worksheet using Worksheet.getRange().get() method.
- Get the style of the specified cell using XlsRange.getStyle() method and set whether the text is wrapped or not using setWrapText() method provided by IStyle interface.
- Save the document to another file using Workbook.saveToFile() method.
- Java
import com.spire.xls.ExcelVersion;
import com.spire.xls.Workbook;
import com.spire.xls.Worksheet;

public class WrapOrUnwrapText {
    public static void main(String[] args) {
        //Create a Workbook instance
        Workbook workbook = new Workbook();
        //Load a sample Excel document
        workbook.loadFromFile("C:\\Users\\Test1\\Desktop\\sample.xlsx");

        //Get the first worksheet
        Worksheet sheet = workbook.getWorksheets().get(0);

        //Wrap text in the cell "D8"
        sheet.getRange().get("D8").getStyle().setWrapText(true);

        //Unwrap text in the cell "D6"
        sheet.getRange().get("D6").getStyle().setWrapText(false);

        //Save the document to another file
        workbook.saveToFile("output/WrapOrUnwrapText.xlsx", ExcelVersion.Version2013);
    }
}
Apply for a Temporary License
If you'd like to remove the evaluation message from the generated documents, or to get rid of the function limitations, please request a 30-day trial license for yourself.
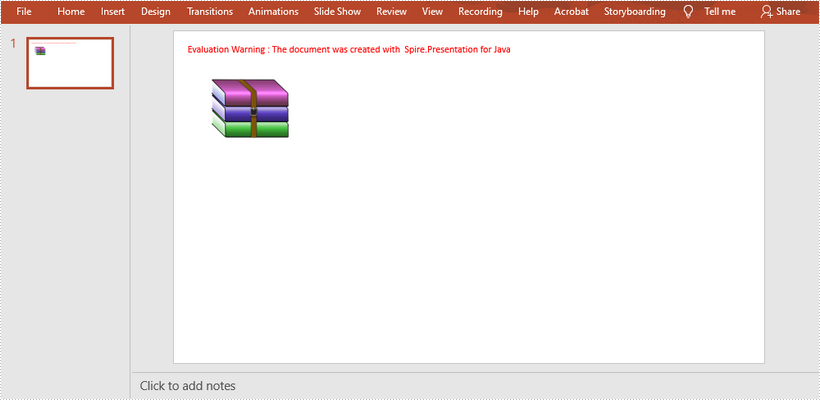
This article shows you how to embed a zip file as an OLE object in a PowerPoint document using Spire.Presentation for Java.
import com.spire.presentation.*;
import com.spire.presentation.drawing.IImageData;

import javax.imageio.ImageIO;
import java.awt.geom.Rectangle2D;
import java.awt.image.BufferedImage;
import java.io.File;
import java.io.FileInputStream;

public class InsertZip {

    public static void main(String[] args) throws Exception {

        //Create a Presentation object
        Presentation presentation = new Presentation();
        presentation.getSlideSize().setType(SlideSizeType.SCREEN_16_X_9);

        //Get the first slide
        ISlide slide = presentation.getSlides().get(0);

        //Load a zip file and convert it to a byte[] object
        String filePath = "C:\\Users\\Administrator\\Desktop\\sample.zip";
        File zipFile = new File(filePath);
        FileInputStream inputStream = new FileInputStream(zipFile);
        byte[] data = new byte[(int) zipFile.length()];
        inputStream.read(data, 0, data.length);

        //Load an image file as the display icon
        File file = new File("C:\\Users\\Administrator\\Desktop\\winrar-icon.png");
        BufferedImage image = ImageIO.read(file);
        IImageData oleImage = presentation.getImages().append(image);

        //Insert the zip file as an OLE object to the first slide
        Rectangle2D rect = new Rectangle2D.Float(60, 60, image.getWidth(), image.getHeight());
        IOleObject oleObject = slide.getShapes().appendOleObject("zip", data, rect);
        oleObject.getSubstituteImagePictureFillFormat().getPicture().setEmbedImage(oleImage);
        oleObject.setProgId("Package");

        //Save to file
        presentation.saveToFile("output/InsertZip.pptx", FileFormat.PPTX_2013);
    }
}
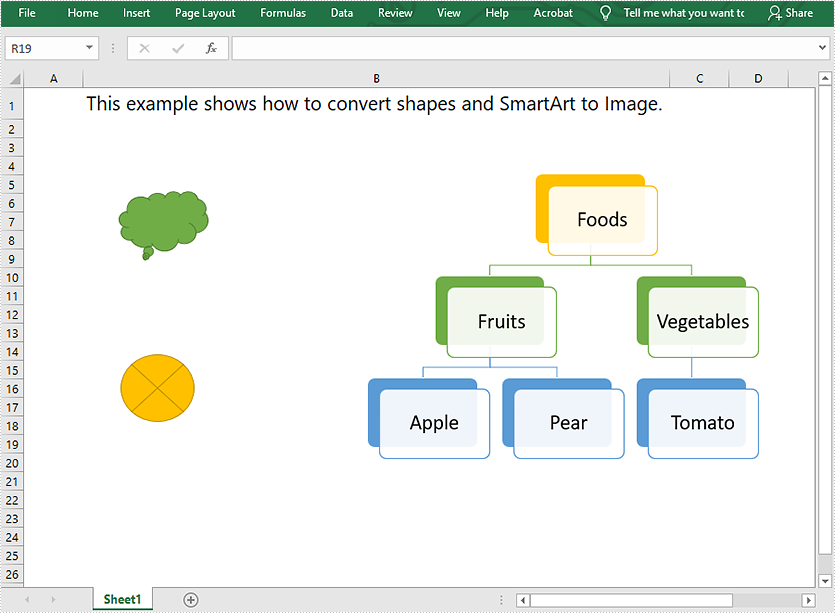
Convert Shapes and SmartArt in Excel to Image in C#, VB.NET
2021-08-10 07:09:45 Written by AdministratorThis article demonstrates how to convert shapes and SmartArt graphics in Excel to Image in C# using Spire.XLS for .NET.
The input Excel file:
using Spire.Xls;
using System.Collections.Generic;
using System.Drawing;
using System.Drawing.Imaging;

namespace Convert_Shapes_and_SmartArt_to_Image
{
    class Program
    {
        static void Main(string[] args)
        {
            //Create a Workbook object
            Workbook workbook = new Workbook();
            //Load the Excel file
            workbook.LoadFromFile("Sample.xlsx");

            //Get the first worksheet
            Worksheet sheet = workbook.Worksheets[0];

            //Create a SaveShapeTypeOption object
            SaveShapeTypeOption shapelist = new SaveShapeTypeOption();
            //Save shapes and SmartArt graphics in the worksheet to images
            List<Bitmap> images = sheet.SaveShapesToImage(shapelist);

            //Save images to file
            int index = 0;
            foreach (Image img in images)
            {
                img.Save("Image/" + "toImage" + index + ".Png", ImageFormat.Png);
                index++;
            }
        }
    }
}
Imports Spire.Xls
Imports System.Collections.Generic
Imports System.Drawing.Imaging

Namespace Convert_Shapes_and_SmartArt_to_Image
    Friend Class Program
        Private Shared Sub Main(ByVal args As String())
            'Create a Workbook object
            Dim workbook As Workbook = New Workbook()
            'Load the Excel file
            workbook.LoadFromFile("Sample.xlsx")

            'Get the first worksheet
            Dim sheet As Worksheet = workbook.Worksheets(0)

            'Create a SaveShapeTypeOption object
            Dim shapelist As SaveShapeTypeOption = New SaveShapeTypeOption()
            'Save shapes and SmartArt graphics in the worksheet to images
            Dim images As List(Of Bitmap) = sheet.SaveShapesToImage(shapelist)

            'Save images to file
            Dim index As Integer = 0

            For Each img As Image In images
                img.Save("Image/" & "toImage" & index & ".Png", ImageFormat.Png)
                index += 1
            Next
        End Sub
    End Class
End Namespace
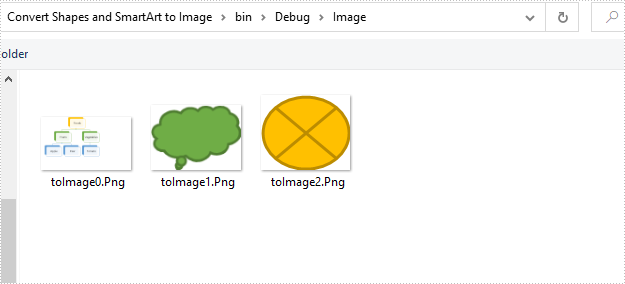
Converted images: