
Knowledgebase (2370)
Children categories
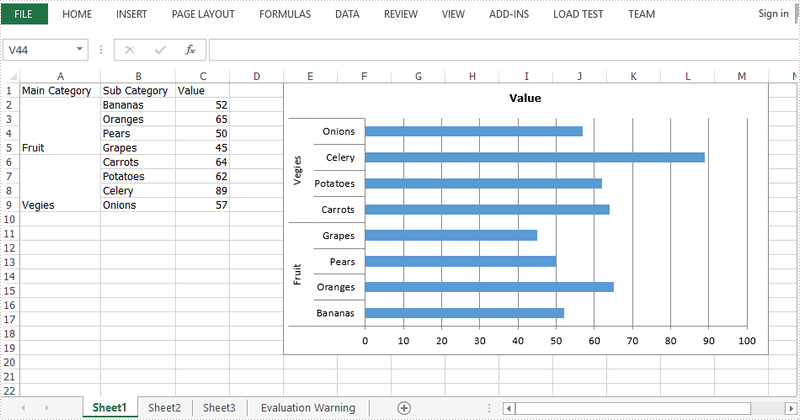
Multi-level category chart is a chart type that has both main category and subcategory labels. This type of chart is useful when you have figures for items that belong to different categories. In this article, you will learn how to create a multi-level category chart in Excel using Spire.XLS with C# and VB.NET.
Step 1: Create a Workbook instance and get the first worksheet.
Workbook wb = new Workbook();
Worksheet sheet = wb.Worksheets[0];
Step 2: Write data to cells.
sheet.Range["A1"].Text = "Main Category";
sheet.Range["A2"].Text = "Fruit";
sheet.Range["A6"].Text = "Vegies";
sheet.Range["B1"].Text = "Sub Category";
sheet.Range["B2"].Text = "Bananas";
sheet.Range["B3"].Text = "Oranges";
sheet.Range["B4"].Text = "Pears";
sheet.Range["B5"].Text = "Grapes";
sheet.Range["B6"].Text = "Carrots";
sheet.Range["B7"].Text = "Potatoes";
sheet.Range["B8"].Text = "Celery";
sheet.Range["B9"].Text = "Onions";
sheet.Range["C1"].Text = "Value";
sheet.Range["C2"].Value = "52";
sheet.Range["C3"].Value = "65";
sheet.Range["C4"].Value = "50";
sheet.Range["C5"].Value = "45";
sheet.Range["C6"].Value = "64";
sheet.Range["C7"].Value = "62";
sheet.Range["C8"].Value = "89";
sheet.Range["C9"].Value = "57";
Step 3: Vertically merge cells from A2 to A5, A6 to A9.
sheet.Range["A2:A5"].Merge();
sheet.Range["A6:A9"].Merge();
Step 4: Add a clustered bar chart to worksheet.
Chart chart = sheet.Charts.Add(ExcelChartType.BarClustered);
chart.ChartTitle = "Value";
chart.PlotArea.Fill.FillType = ShapeFillType.NoFill;
chart.Legend.Delete();
Step 5: Set the data source of series data.
chart.DataRange = sheet.Range["C2:C9"];
chart.SeriesDataFromRange = false;
Step 6: Set the data source of category labels.
ChartSerie serie = chart.Series[0];
serie.CategoryLabels = sheet.Range["A2:B9"];
Step 7: Show multi-level category labels.
chart.PrimaryCategoryAxis.MultiLevelLable = true;
Step 8: Save the file.
wb.SaveToFile("output.xlsx", ExcelVersion.Version2013);
Output:
Full Code:
using Spire.Xls;
using Spire.Xls.Charts;
namespace CreateMutilLevelChart
{

    class Program
    {

        static void Main(string[] args)
        {
            Workbook wb = new Workbook();
            Worksheet sheet = wb.Worksheets[0];

            sheet.Range["A1"].Text = "Main Category";
            sheet.Range["A2"].Text = "Fruit";
            sheet.Range["A6"].Text = "Vegies";
            sheet.Range["B1"].Text = "Sub Category";
            sheet.Range["B2"].Text = "Bananas";
            sheet.Range["B3"].Text = "Oranges";
            sheet.Range["B4"].Text = "Pears";
            sheet.Range["B5"].Text = "Grapes";
            sheet.Range["B6"].Text = "Carrots";
            sheet.Range["B7"].Text = "Potatoes";
            sheet.Range["B8"].Text = "Celery";
            sheet.Range["B9"].Text = "Onions";
            sheet.Range["C1"].Text = "Value";
            sheet.Range["C2"].Value = "52";
            sheet.Range["C3"].Value = "65";
            sheet.Range["C4"].Value = "50";
            sheet.Range["C5"].Value = "45";
            sheet.Range["C6"].Value = "64";
            sheet.Range["C7"].Value = "62";
            sheet.Range["C8"].Value = "89";
            sheet.Range["C9"].Value = "57";
            sheet.Range["A2:A5"].Merge();
            sheet.Range["A6:A9"].Merge();
            sheet.AutoFitColumn(1);
            sheet.AutoFitColumn(2);

            Chart chart = sheet.Charts.Add(ExcelChartType.BarClustered);
            chart.ChartTitle = "Value";
            chart.PlotArea.Fill.FillType = ShapeFillType.NoFill;
            chart.Legend.Delete();
            chart.LeftColumn = 5;
            chart.TopRow = 1;
            chart.RightColumn = 14;
            chart.DataRange = sheet.Range["C2:C9"];
            chart.SeriesDataFromRange = false;
            ChartSerie serie = chart.Series[0];
            serie.CategoryLabels = sheet.Range["A2:B9"];
            chart.PrimaryCategoryAxis.MultiLevelLable = true;
            wb.SaveToFile("output.xlsx", ExcelVersion.Version2013);
        }
    }
}
Imports Spire.Xls
Imports Spire.Xls.Charts
Namespace CreateMutilLevelChart

	Class Program

		Private Shared Sub Main(args As String())
			Dim wb As New Workbook()
			Dim sheet As Worksheet = wb.Worksheets(0)

			sheet.Range("A1").Text = "Main Category"
			sheet.Range("A2").Text = "Fruit"
			sheet.Range("A6").Text = "Vegies"
			sheet.Range("B1").Text = "Sub Category"
			sheet.Range("B2").Text = "Bananas"
			sheet.Range("B3").Text = "Oranges"
			sheet.Range("B4").Text = "Pears"
			sheet.Range("B5").Text = "Grapes"
			sheet.Range("B6").Text = "Carrots"
			sheet.Range("B7").Text = "Potatoes"
			sheet.Range("B8").Text = "Celery"
			sheet.Range("B9").Text = "Onions"
			sheet.Range("C1").Text = "Value"
			sheet.Range("C2").Value = "52"
			sheet.Range("C3").Value = "65"
			sheet.Range("C4").Value = "50"
			sheet.Range("C5").Value = "45"
			sheet.Range("C6").Value = "64"
			sheet.Range("C7").Value = "62"
			sheet.Range("C8").Value = "89"
			sheet.Range("C9").Value = "57"
			sheet.Range("A2:A5").Merge()
			sheet.Range("A6:A9").Merge()
			sheet.AutoFitColumn(1)
			sheet.AutoFitColumn(2)

			Dim chart As Chart = sheet.Charts.Add(ExcelChartType.BarClustered)
			chart.ChartTitle = "Value"
			chart.PlotArea.Fill.FillType = ShapeFillType.NoFill
			chart.Legend.Delete()
			chart.LeftColumn = 5
			chart.TopRow = 1
			chart.RightColumn = 14
			chart.DataRange = sheet.Range("C2:C9")
			chart.SeriesDataFromRange = False
			Dim serie As ChartSerie = chart.Series(0)
			serie.CategoryLabels = sheet.Range("A2:B9")
			chart.PrimaryCategoryAxis.MultiLevelLable = True
			wb.SaveToFile("output.xlsx", ExcelVersion.Version2013)
		End Sub
	End Class
End Namespace
With Spire.Doc, we can copy the content from one word document to another word document in C#. When we need to generate a large amount of documents from a single document, clone the document will be much easier. The clone method speeds up the generation of the word documents and developers only need one single line of code to get the copy of the word document.
Now we will show the code snippet of how to clone a word document in C#.
Step 1: Create a new instance of Document and load the document from file.
Document doc = new Document();
doc.LoadFromFile("Sample.docx",FileFormat.Docx2010);
Step 2: Clone the word document.
doc.Clone();
Step 3: Save the document to file.
doc.SaveToFile("Cloneword.docx", FileFormat.Docx2010);
Effective screenshot of clone the word document:

Full codes of clone a word document:
using Spire.Doc;
namespace CloneWord
{
    class Program
    {
        static void Main(string[] args)
        {
            Document doc = new Document();
            doc.LoadFromFile("Sample.docx", FileFormat.Docx2010);
            doc.Clone();
            doc.SaveToFile("Cloneword.docx", FileFormat.Docx2010);
        }
    }
}
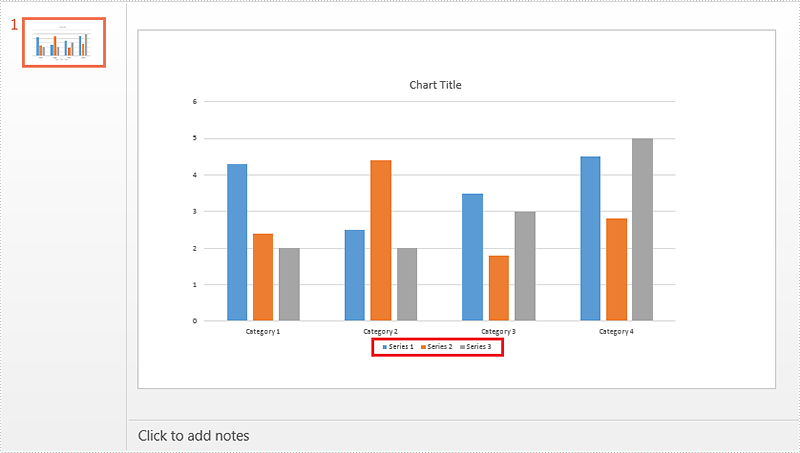
When creating chart, the legend appears by default. If we just need the chart series rather than the legend, we can delete the legend entries after creating the chart. Spire.Presentation supports to delete legend entries from chart by using ChartLegend.DeleteEntry method. This article is going to demonstrate how we can use Spire.Presentation to accomplish this function.
Below screenshot shows the example PowerPoint file which contains 3 chart legend entries:
Detail steps:
Step 1: Initialize an object of Presentation class and load the PowerPoint file.
Presentation ppt = new Presentation();
ppt.LoadFromFile("Input.pptx");
Step 2: Get the chart.
IChart chart = ppt.Slides[0].Shapes[0] as IChart;
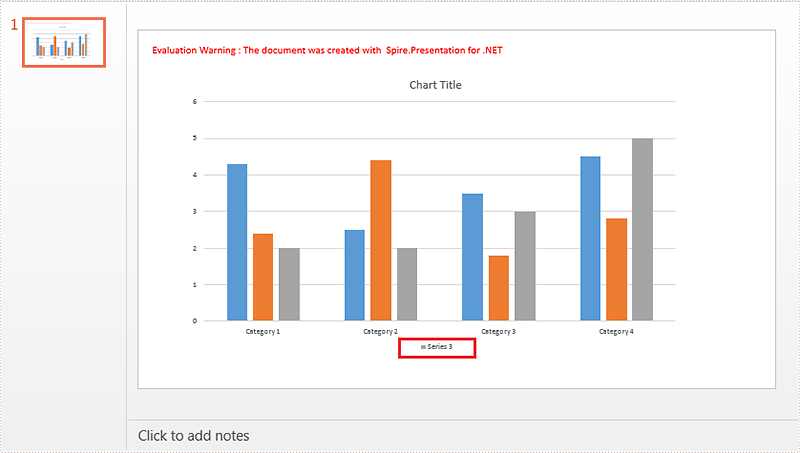
Step 3: Delete the first and the second legend entries from the chart.
chart.ChartLegend.DeleteEntry(0);
chart.ChartLegend.DeleteEntry(1);
Step 4: Save the file.
ppt.SaveToFile("Output.pptx", FileFormat.Pptx2010);
Screenshot:
Full code:
using Spire.Presentation;
using Spire.Presentation.Charts;

namespace Delete_chart_legend_entries_in_PPT
{
    class Program
    {
        static void Main(string[] args)
        {
            Presentation ppt = new Presentation();
            ppt.LoadFromFile("Input.pptx");

            IChart chart = ppt.Slides[0].Shapes[0] as IChart;

            chart.ChartLegend.DeleteEntry(0);
            chart.ChartLegend.DeleteEntry(1);

            ppt.SaveToFile("Output.pptx", FileFormat.Pptx2010);
        }
    }
}
