
Knowledgebase (2370)
Children categories
Efficient C# Image to PDF Guide: Convert JPG/ PNG to PDF with Code Examples
2022-03-30 06:26:00 Written by KoohjiImages (JPG, PNG, BMP, etc.) are common for data capture, but PDFs provide better security, compression, and cross-platform consistency. In .NET development, developers may often need a reliable C# image to PDF solution to streamline workflows like report generation, document archiving, and digital record management.
This guide demonstrates how to efficiently convert images to PDF in C#/ ASP.NET using Spire.PDF for .NET, a powerful library that simplifies this process with robust features and excellent compatibility.
- Set Up Your Project
- How to Convert Image to PDF in C#
- Image to PDF Customization Options
- FAQs (TIFF to PDF, SVG to PDF)
- Conclusion
Set Up Your Project
Before we start writing code to convert images such as PNG to PDF, we need to set up our C# project and add the Spire.PDF library.
Step 1: Create a New C# Project
Open Visual Studio and create a new C# project. You can choose a Console Application, Windows Forms Application, or any other project type depending on your needs.
Step 2: Install Spire.PDF
There are a few ways to add the PDF converter library to your project. One common method is through NuGet Package Manager.
- In Visual Studio, right-click on your project in the Solution Explorer, select "Manage NuGet Packages".
- In the NuGet Package Manager window, search for "Spire.PDF".
- Then, click "Install" to add the latest version of the library to your project.
Once the installation is complete, you'll be able to reference the necessary namespaces in your C# code.
How to Convert Image to PDF in C#
Spire.PDF does not provide a straightforward method to convert images to PDF. But you could create a new PDF document and draw images at the specified locations of a certain page. The following are two code examples for single/multiple image conversion.
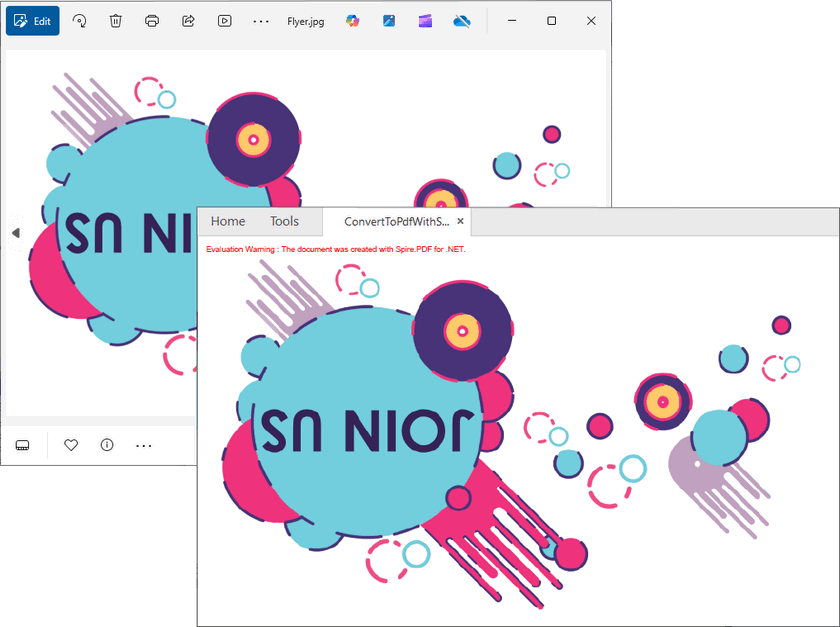
Converting a Single Image to PDF
This example shows how to convert a JPG image to a PDF document, with the PDF page match the exact dimensions of the image.
C# code for JPG to PDF conversion:
using System.Drawing;
using Spire.Pdf;
using Spire.Pdf.Graphics;

namespace ConvertImageToPdf
{
    class Program
    {
        static void Main(string[] args)
        {
            // Create a PdfDocument object
            PdfDocument doc = new PdfDocument();

            // Set the margins to 0
            doc.PageSettings.SetMargins(0);

            // Load an image
            Image image = Image.FromFile(@"C:\Users\Administrator\Desktop\announcement.jpg");

            // Get the image width and height
            float width = image.PhysicalDimension.Width;
            float height = image.PhysicalDimension.Height;

            // Add a page of the same size as the image
            PdfPageBase page = doc.Pages.Add(new SizeF(width, height));

            // Load a JPG image and draw it at (0, 0) of the page
            PdfImage pdfImage = PdfImage.FromImage(image);
            page.Canvas.DrawImage(pdfImage, 0, 0, pdfImage.Width, pdfImage.Height);

            // Save the PDF file
            doc.SaveToFile("ConvertPdfWithSameSize.pdf");
        }
    }
}
Explanation:
- PdfDocument: Represents the PDF file.
- PdfPageBase: A page in the PDF document.
- PdfImage.FromImage: Converts an Image object to a PDF image.
- DrawImage: Renders the image on the PDF page.
Output:
Converting Multiple Images to a Single PDF
If you have multiple images that you want to combine into a single PDF document, the process is similar to the single-image conversion, but with a loop to handle each image.
C# code to convert JPG, PNG, TIFF, BMP to PDF:
using Spire.Pdf;
using Spire.Pdf.Graphics;
using System.Drawing;

namespace ConvertMultipleImagesIntoPdf
{
    class Program
    {
        static void Main(string[] args)
        {
            // Create a PdfDocument object
            PdfDocument pdf = new PdfDocument();

            // Set the page margins to 0
            pdf.PageSettings.SetMargins(0);

            // Specify the images to be converted
            string[] imagePaths = {"Image-1.png", "Image-2.jpg", "Image-3.bmp", "Image-4.tiff"};

            // Iterate through each image
            foreach (string path in imagePaths)
            {
                // Load a particular image
                Image image = Image.FromFile(path);

                // Get the image width and height
                float width = image.PhysicalDimension.Width;
                float height = image.PhysicalDimension.Height;

                // Add a page that has the same size as the image
                PdfPageBase page = pdf.Pages.Add(new SizeF(width, height));

                //Create a PdfImage object based on the image
                PdfImage pdfImage = PdfImage.FromImage(image);

                // Draw image at (0, 0) of the page
                page.Canvas.DrawImage(pdfImage, 0, 0, pdfImage.Width, pdfImage.Height);
            }

            // Save the PDF file
            pdf.SaveToFile("CombinaImagesToPdf.pdf");
            pdf.Dispose();
        }
    }
}
This C# code loops through an array of image files in different formats, loads each image, adds it to a new page in the PDF document, and then saves the final PDF with all the images.
Output:
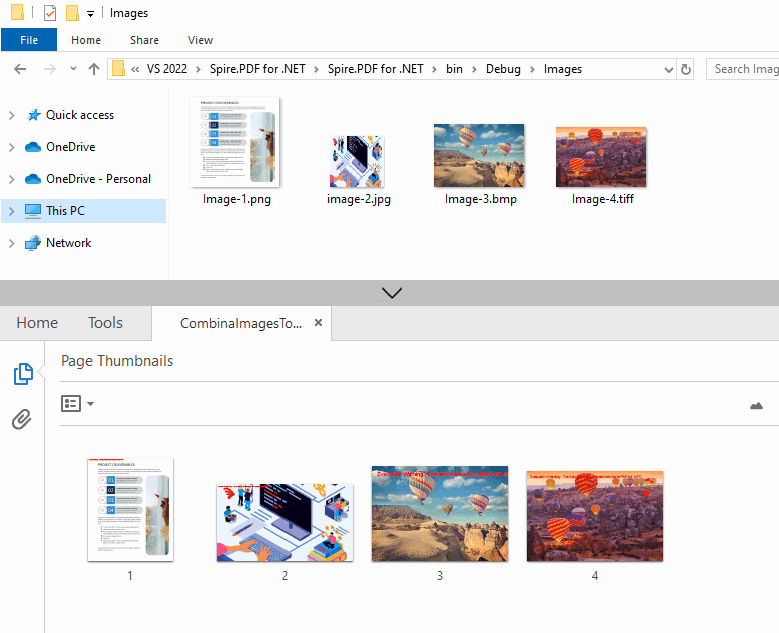
Image to PDF Customization Options
Adjust Page Settings
While conversion, you can customize PDF page properties such as orientation, margins, and size according to the nature of your images:
// Create a PDF document
PdfDocument pdf = new PdfDocument();

// Set page orientation
pdf.PageSettings.Orientation = PdfPageOrientation.Landscape;

// Set page margins (in points, 1 point = 1/72 inch)
pdf.PageSettings.SetMargins(20);

// Set page size
pdf.PageSettings.Size = PdfPageSize.A4;
Resize Images for Optimal Fit
If you need to maintain a fixed PDF page size, you can scale the image to make it fit to page:
// Set fixed page size (e.g., A4)
PdfPageBase page = pdf.Pages.Add(PdfPageSize.A4);

//Load an image
Image image = Image.FromFile("sample.jpg");

// Get the width and heigh of the page
float pageWidth = page.Canvas.ClientSize.Width;
float pageHeight = page.Canvas.ClientSize.Height;

// Scale the image
float scale = Math.Min(pageWidth / image.Width, pageHeight / image.Height);
float scaledWidth = image.Width * scale;
float scaledHeight = image.Height * scale;

// Draw the scaled image on the page
page.Canvas.DrawImage(PdfImage.FromImage(image), 0, 0, scaledWidth, scaledHeight);
FAQs (TIFF to PDF, SVG to PDF)
Q1: What image formats does Spire.PDF support?
A: Spire.PDF seamlessly supports all major image formats:
- JPG/ JPEG
- PNG
- BMP
- TIFF
- GIF
- EMF
- WMF
Ensure your input image is in a supported format for seamless conversion.
Q2: Can I convert a multi-page TIFF image to PDF?
A: Yes! Iterate through TIFF frames to convert. The full code example can be found at: Convert a Multi-Page TIFF Image to a PDF File in C#
Q3: Can I convert SVG image to PDF?
A: Yes! You can load an SVG file with LoadFromSvg() and then save it as a PDF through the SaveToFile(String, FileFormat.PDF) method.
using Spire.Pdf;

namespace SVGtoPDF
{
    class Program
    {
        static void Main(string[] args)
        {
            // Create a PdfDocument object
            PdfDocument doc = new PdfDocument();

            // Load a sample SVG file
            doc.LoadFromSvg("Sample.svg");

            // Save SVG to PDF document
            doc.SaveToFile("SVGtoPDF.pdf", FileFormat.PDF);
            doc.Dispose();
        }
    }
}
Q4: Where can I find the VB.NET demos for image to PDF conversion?
A: Spire.PDF fully supports VB.NET. You can convert the C# code samples provided above to VB.NET via code converter tools (e.g. Telerik Code Converter).
Conclusion
With Spire.PDF for .NET, converting images to PDF in C# becomes simple and flexible. This guide shows you how to:
- Convert a single or multiple images into a PDF document.
- Customize page size, margins, and layout for your PDF output.
By following the examples in this guide, you can seamlessly integrate image-to-PDF conversion into your .NET applications.
For advanced features (encryption, annotation), explore Spire.PDF’s online documentation.
Get a Free License
Need to remove watermarks on output files and get rid of restrictions? You can request a 30-day full-featured trial license. A tutorial on how to use the license file is available here.
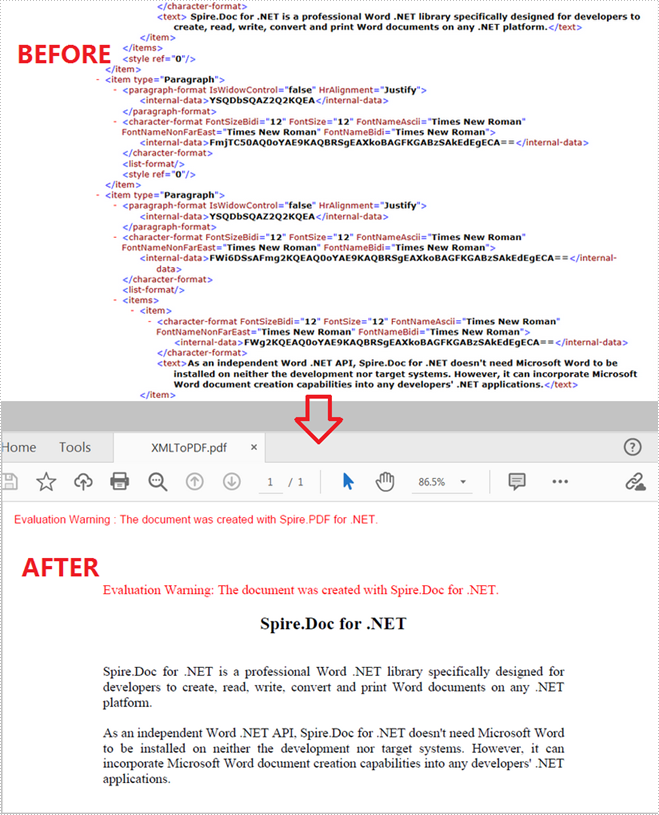
An Extensible Markup Language (XML) file is a standard text file that utilizes customized tags to describe the structure and other features of a document. By converting XML to PDF, you make it easier to share with others since PDF is a more common and ease-to-access file format. This article will demonstrate how to convert XML to PDF in C# and VB.NET using Spire.Doc for .NET.
Install Spire.Doc for .NET
To begin with, you need to add the DLL files included in the Spire.Doc for .NET package as references in your .NET project. The DLL files can be either downloaded from this link or installed via NuGet.
PM> Install-Package Spire.Doc
Convert XML to PDF
The following are steps to convert XML to PDF using Spire.Doc for .NET.
- Create a Document instance.
- Load an XML sample document using Document.LoadFromFile() method.
- Save the document as a PDF file using Document.SaveToFile() method.
- C#
- VB.NET
using Spire.Doc;

namespace XMLToPDF
{
   class Program
    {
        static void Main(string[] args)
        {
            //Create a Document instance
            Document mydoc = new Document();
            //Load an XML sample document
            mydoc.LoadFromFile(@"XML Sample.xml", FileFormat.Xml);
            //Save it to PDF
            mydoc.SaveToFile("XMLToPDF.pdf", FileFormat.PDF);

        }
    }
}
Apply for a Temporary License
If you'd like to remove the evaluation message from the generated documents, or to get rid of the function limitations, please request a 30-day trial license for yourself.
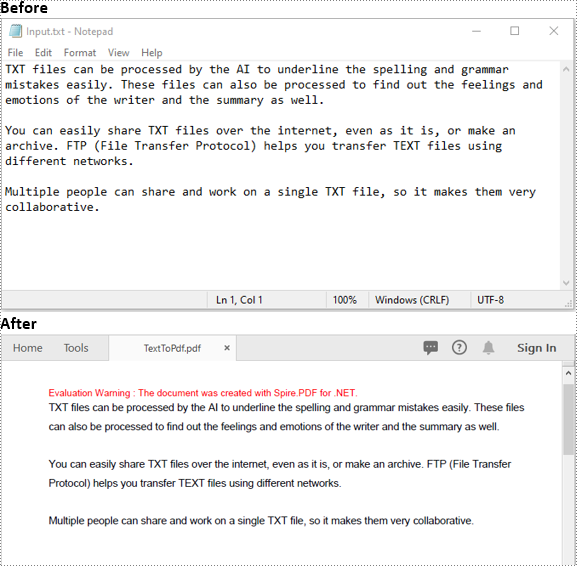
A text file is a type of computer file that contains plain text. It can be viewed on almost any computer but has very basic and limited functionalities. If you would like to perform more manipulations on text files, such as inserting annotations or form fields, you can convert them to PDF. In this article, we will demonstrate how to convert text files to PDF in C# and VB.NET using Spire.PDF for .NET.
Install Spire.PDF for .NET
To begin with, you need to add the DLL files included in the Spire.PDF for.NET package as references in your .NET project. The DLLs files can be either downloaded from this link or installed via NuGet.
PM> Install-Package Spire.PDF
Convert Text Files to PDF in C# and VB.NET
The following are the main steps to convert a text file to PDF using Spire.PDF for .NET:
- Read the text in the text file into a string object using File.ReadAllText() method.
- Create a PdfDocument instance and add a page to the PDF file using PdfDocument.Pages.Add() method.
- Create a PdfTextWidget instance from the text.
- Draw the text onto the PDF page using PdfTextWidget.Draw() method.
- Save the result file using PdfDocument.SaveToFile() method.
- C#
- VB.NET
using Spire.Pdf;
using Spire.Pdf.Graphics;
using System.Drawing;
using System.IO;

namespace ConvertTextToPdf
{
    class Program
    {
        static void Main(string[] args)
        {
            //Read the text from the text file
            string text = File.ReadAllText(@"Input.txt");

            //Create a PdfDocument instance
            PdfDocument pdf = new PdfDocument();
            //Add a page
            PdfPageBase page = pdf.Pages.Add();

            //Create a PdfFont instance
            PdfFont font = new PdfFont(PdfFontFamily.Helvetica, 11);

            //Create a PdfTextLayout instance
            PdfTextLayout textLayout = new PdfTextLayout();
            textLayout.Break = PdfLayoutBreakType.FitPage;
            textLayout.Layout = PdfLayoutType.Paginate;

            //Create a PdfStringFormat instance
            PdfStringFormat format = new PdfStringFormat();
            format.Alignment = PdfTextAlignment.Justify;
            format.LineSpacing = 20f;

            //Create a PdfTextWidget instance from the text
            PdfTextWidget textWidget = new PdfTextWidget(text, font, PdfBrushes.Black);
            //Set string format
            textWidget.StringFormat = format;

            //Draw the text at the specified location of the page
            RectangleF bounds = new RectangleF(new PointF(10, 25), page.Canvas.ClientSize);
            textWidget.Draw(page, bounds, textLayout);

            //Save the result file
            pdf.SaveToFile("TextToPdf.pdf", FileFormat.PDF);
        }
    }
}
Apply for a Temporary License
If you'd like to remove the evaluation message from the generated documents, or to get rid of the function limitations, please request a 30-day trial license for yourself.
