Turn Files into Explainer Videos with Spire.Agent.Office in C#
In corporate training, online courses and academic sharing, turning a course document into an "illustrated, voice-narrated" explainer video normally requires a whole toolchain of presentation, image processing, audio synthesis and video encoding. With the AI capability of Spire.Agent.Office, you only need to upload course documents in Word, PDF, Excel, Markdown or other formats and describe the goal in plain language to get a complete narrated video.
Compared with the traditional SDK API
| Traditional Spire.Office for .NET API | Spire.Agent.Office | |
|---|---|---|
| Driving model | Parse the course document, lay out slides page by page to build a Presentation, then use the API and ffmpeg to convert the Presentation to MP4 | Describe the goal in natural language and the AI understands and orchestrates the execution path |
| Amount of code | A large amount of code is required, and speech narration cannot be added | A simple natural-language instruction |
| Multi-format parsing | Separate parsing logic must be written for each format (Word/PDF/Excel/Markdown) | The AI detects the document format and reads the content automatically |
| Changing requirements | Adjust theme, page count, language or narration style → change code → compile → redeploy | Change the instruction and it takes effect immediately |
From course document to narrated video:
For product installation and SpireToken configuration, please refer to Integrating Spire.Agent.Office in a .NET Project. The examples below assume Spire.Agent.Office is installed and SpireToken is configured.
Step 1: From a course document to a Presentation
Use Spire.Agent.Office to distill the core points and generate a well-designed Presentation automatically.
using Spire.Agent.Office.AI;
using Spire.Agent.Office.Extensions;
using Spire.Presentation;

// Load course documents in Word, PDF, Excel and Markdown (4 formats)
List<string> inputPaths = new List<string>
{
    @"AI-application-course.docx",
    @"research-paper.pdf",
    @"financial-analysis.xlsx",
    @"health-policy.md"
};

string outputDirectory = @"E:\output\";
string key = "**************************";
// Distill the key points of the course document and generate a teaching Presentation.
string instruction =
    "Treat the attached tutorial documents as the processing target : distill the core points of the AI-application tutorial, covering the basics, typical application areas, implementation steps, real cases, and outlook. Theme: use a calm professional gray-blue as the theme color (clean, minimalist, modern AI-tech feel). 1. ensure high-quality layout and typography 2. include appropriate illustrative charts/figures 3. keep a clean, minimalist style 4. generate 12 slides; ";

// Generate a Presentation from each of the Word, PDF, Excel and Markdown course documents in turn
foreach (string inputPath in inputPaths)
{
    if (!System.IO.File.Exists(inputPath)) continue;

    string savePath = System.IO.Path.Combine(outputDirectory,
        $"{System.IO.Path.GetFileNameWithoutExtension(inputPath)}.pptx");

    GeneratePPT(inputPath, instruction, savePath, key);
}

// AI-powered PPT generation
static PPTGenerationResult GeneratePPT(string input, string instruction, string savePath, string key)
{
    //AIOptions options
    AIOptions options = new AIOptions();
    //Set the SpireToken
    options.SpireToken = key;
    //Set the timeout
    options.TimeoutMs = 1000000;
    //If the document content is long, you can customize the token circuit breaker; the default fuse is 3,000,000
    options.TokenCircuitBreakerLimit = 5000000;
    using (Presentation ppt = new Presentation())
    {
        AIDocumentProcessor processor = ppt.AI(options);
        return processor.GeneratePresentation(input, instruction, savePath);
    }
}
Step 2: From a Presentation to a video
Based on the Presentation generated in step 1, a single instruction that asks for "voice narration" automatically produces an MP4 explainer video with spoken commentary.
using Spire.Agent.Office.AI;
using Spire.Agent.Office.Extensions;
using Spire.Presentation;

// Define the paths of the 4 PPT source files generated in the previous step
List<string> inputPaths = new List<string>
{
    @"AI-application-course.pptx",
    @"research-paper.pptx",
    @"financial-analysis.pptx",
    @"health-policy.pptx"
};

string outputDirectory = @"E:\output\";
string key = "**************************";
string instruction = "Create an MP4 explainer video of this presentation with synchronized voice narration in English.";

// Loop over each PPT to generate a video
foreach (string inputPath in inputPaths)
{
    if (!File.Exists(inputPath)) continue;

    string savePath = Path.Combine(outputDirectory,
        $"{Path.GetFileNameWithoutExtension(inputPath)}.mp4");

    ExecuteDemoPPT(instruction, inputPath, savePath, key, null);
}

// Execute the PPT document AI processing (generate a video with voice narration)
static AIResult ExecuteDemoPPT(string instruction, string inputPath, string savePath, string key, string[] attachmentPaths)
{
    //AIOptions options
    AIOptions options = new AIOptions();
    //Set the SpireToken
    options.SpireToken = key;
    //Set the timeout
    options.TimeoutMs = 1000000;
    //Set the token circuit breaker
    options.TokenCircuitBreakerLimit = 5000000;
    using (Presentation ppt = new Presentation())
    {
        if (!string.IsNullOrEmpty(inputPath) && File.Exists(inputPath))
        {
            ppt.LoadFromFile(inputPath);
        }
        AIDocumentProcessor processor = ppt.AI(options);
        return processor.ExecuteInstruction(ppt, instruction, savePath, attachmentPaths);
    }
}
Word document ----> Presentation ----> narrated .mp4 video
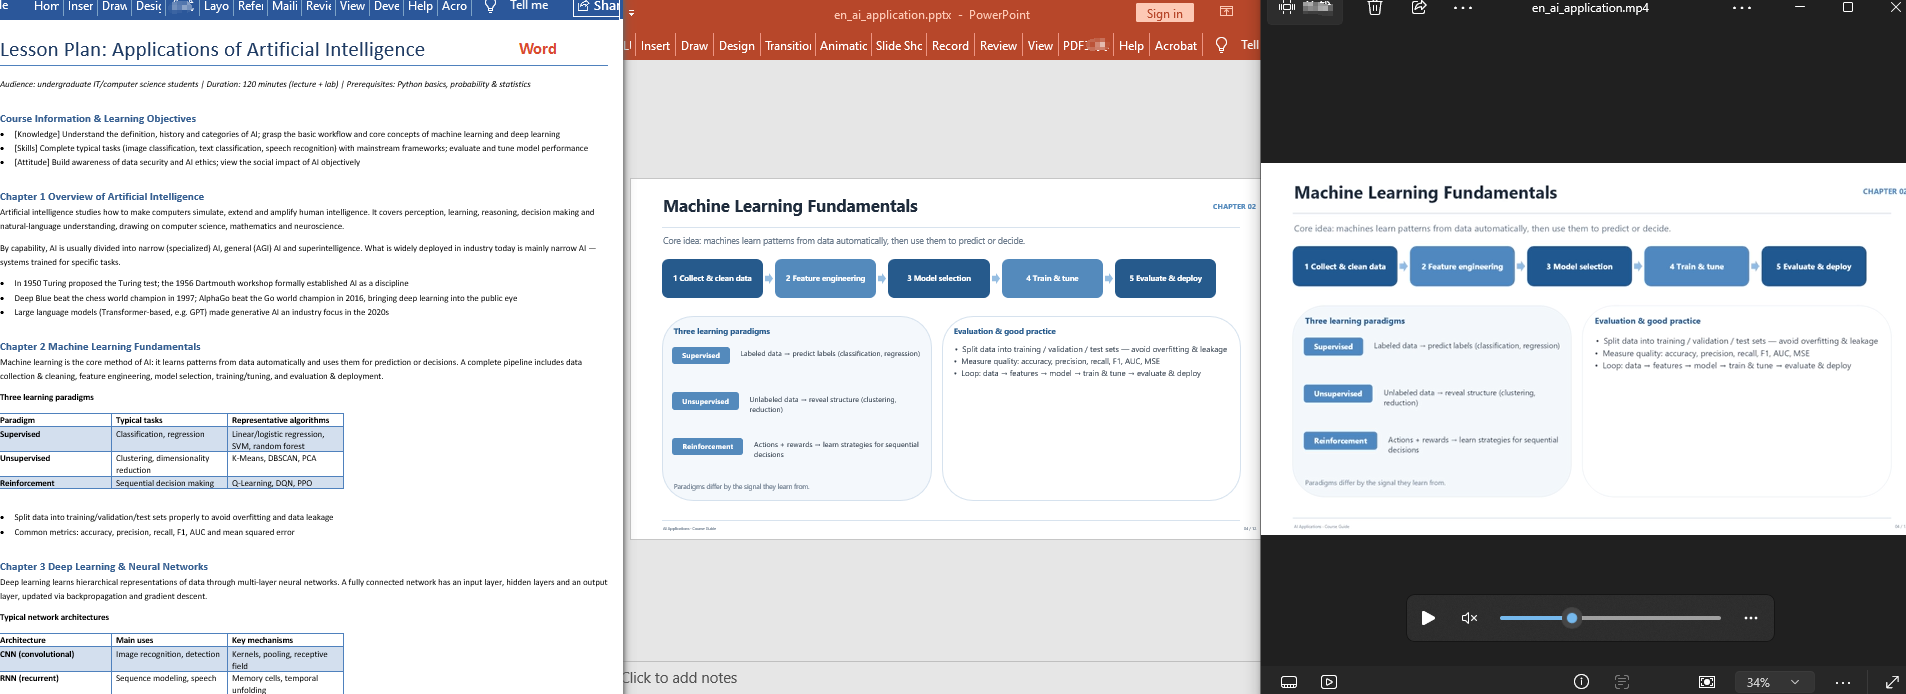 Pdf document ----> Presentation ----> narrated .mp4 video
 Excel document ----> Presentation ----> narrated .mp4 video
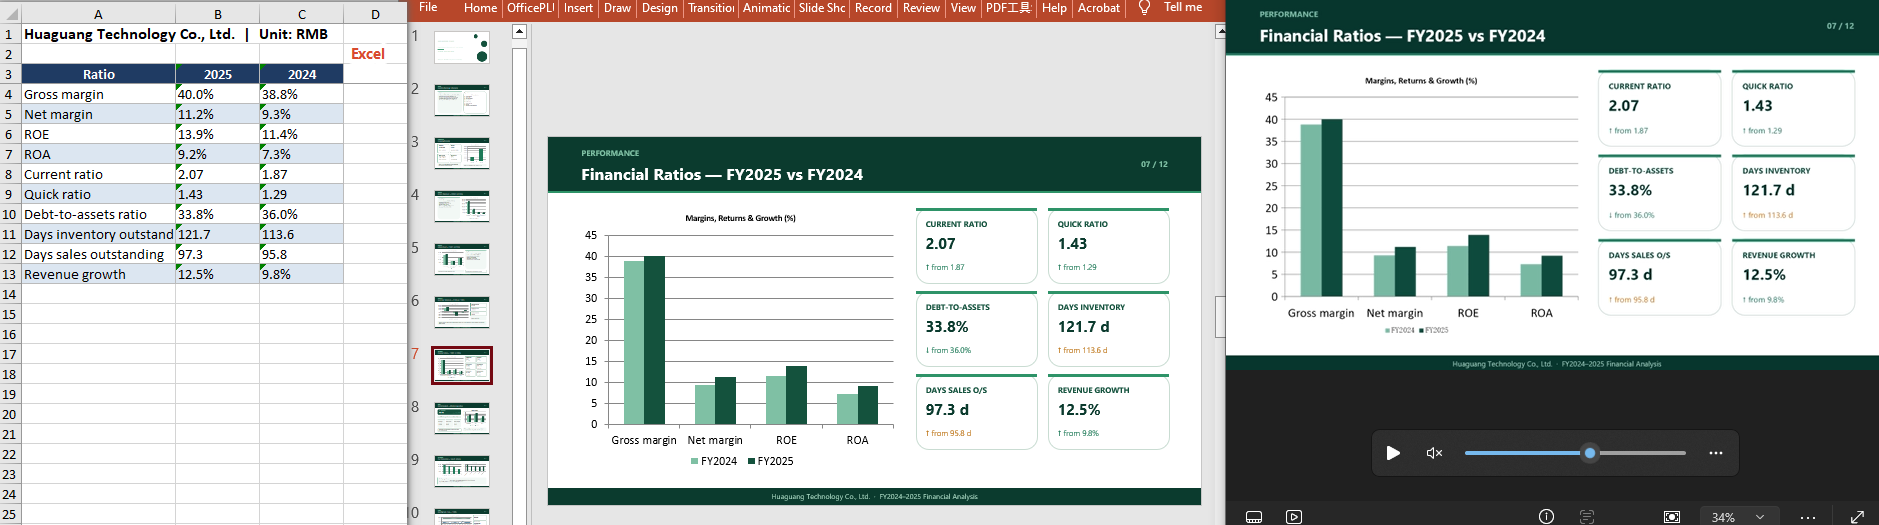 Markdown document ----> Presentation ----> narrated .mp4 video
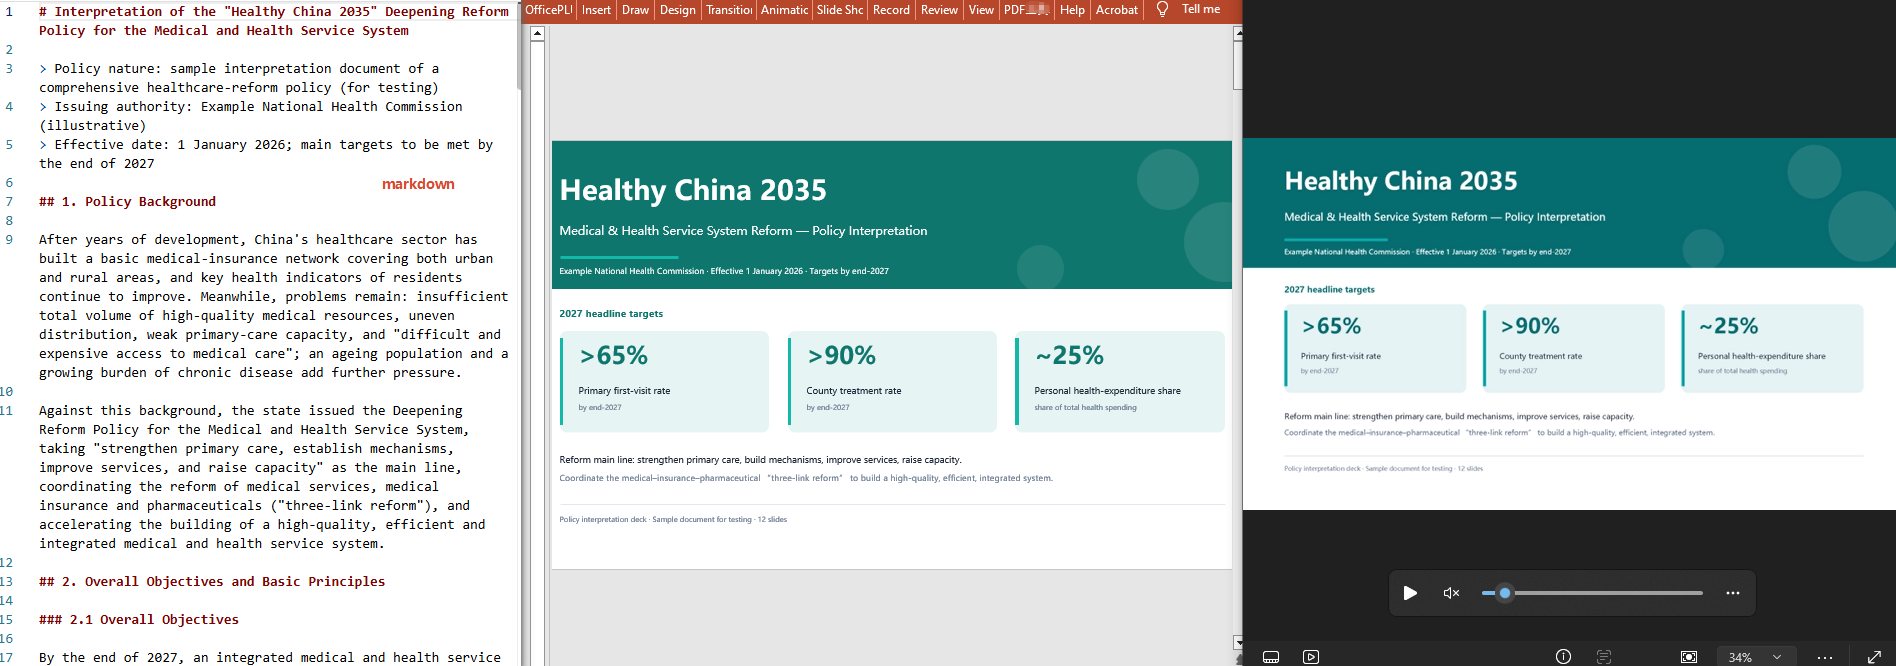
FAQ
The generated PPT's page count does not match the course content
Cause: when the course document is large, the AI's choices when distilling and paginating can differ from expectations.
Solution: state the page count explicitly in the instruction, for example "generate 9 slides, one teaching segment per slide".
The result failed to generate
Cause: the source document contains a lot of data, so the analysis consumes a large number of tokens and exceeds the default token fuse limit.
Solution: configure TokenCircuitBreakerLimit yourself, as shown below:
AIOptions options = new AIOptions();
options.TokenCircuitBreakerLimit = 5000000;
Can multi-format course documents (Word/PDF/Excel/Markdown) all be converted?
Cause: each format is parsed differently, so users are not sure what works.
Solution: Spire.Agent.Office detects the format of the attached document and reads its content automatically; simply pass in the file of the corresponding format and state its origin in the instruction.
Get your SpireToken Key
- Contact sales@e-iceblue.com or visit https://www.e-iceblue.com/TemLicense.html to obtain a trial/commercial API key
Configure it in code:
AIOptions options = new AIOptions();
options.SpireToken = key;
Add, Read, Edit, and Delete Excel Comments with JavaScript in React
Comments are an important tool in Excel for providing supplementary explanations of cell contents, and are commonly used in scenarios such as data review and collaborative notes. Spire.XLS for JavaScript uses WebAssembly to add, read, edit, and delete comments directly in the browser, managing input and output files through a virtual file system (VFS) — no backend server required.
This article covers several commonly used features:
For installation and project configuration, refer to Integrating Spire.XLS for JavaScript in a React Project. The examples below assume Spire.XLS is installed and the WebAssembly module is initialized.
Add a Comment
A comment can also carry author information, making it easy to identify where the comment comes from.
function App() {
  const addCommentWithAuthor = async () => {
    // Get the Spire.XLS WASM module
    const xlsModule = window.wasmModule?.spirexls;

    // Check if the module is ready
    if (!xlsModule) {
      alert('Spire.Xls is not ready yet');
      return;
    }

    // Load the font and the Excel file into VFS
    await window.spire.FetchFileToVFS('ARIAL.TTF', '/Library/Fonts/', `${process.env.PUBLIC_URL}/font/`);
    const inputFileName = 'CommentsSample.xlsx';
    await window.spire.FetchFileToVFS(inputFileName, '', `${process.env.PUBLIC_URL}data/`);

    // Load the workbook
    const workbook = new xlsModule.Workbook();
    workbook.LoadFromFile({ fileName: inputFileName });

    // Get the first worksheet
    const sheet = workbook.Worksheets.get(0);

    // Get the cell where the comment will be added
    const range = sheet.Range.get('C1');

    // Set the author and comment content
    const author = 'E-iceblue:';
    const text = 'This is an example showing how to add a comment with an editable author property.';

    // Add a comment to the cell and set its properties
    const comment = range.AddComment();
    comment.Width = 200;
    comment.IsVisible = true;
    comment.Text = author + ':\n' + text;

    // Set the font style of the author name in the comment
    const font = workbook.CreateFont();
    font.FontName = 'Arial';
    font.KnownColor = xlsModule.ExcelColors.Black;
    font.IsBold = true;
    comment.RichText.SetFont(0, author.length, font);

    // Save the workbook
    const outputFileName = 'AddCommentWithAuthor_output.xlsx';
    workbook.SaveToFile({ fileName: outputFileName, version: xlsModule.ExcelVersion.Version2010 });

    // Release resources
    workbook.Dispose();

    // Read the generated file from VFS and trigger the download
    const fileArray = window.dotnetRuntime.Module.FS.readFile(outputFileName);
    const blob = new Blob([fileArray], { type: 'application/vnd.openxmlformats-officedocument.spreadsheetml.sheet' });
    const url = URL.createObjectURL(blob);
    const a = document.createElement('a');
    a.href = url;
    a.download = outputFileName;
    a.click();
    URL.revokeObjectURL(url);
  };

  return (
    <div style={{ textAlign: 'center', height: '300px' }}>
      <h1>Add Comment With Author</h1>
      <button onClick={addCommentWithAuthor}>Start</button>
    </div>
  );
}

export default App;
After running, a comment containing the author name and the comment text will appear on cell C1. 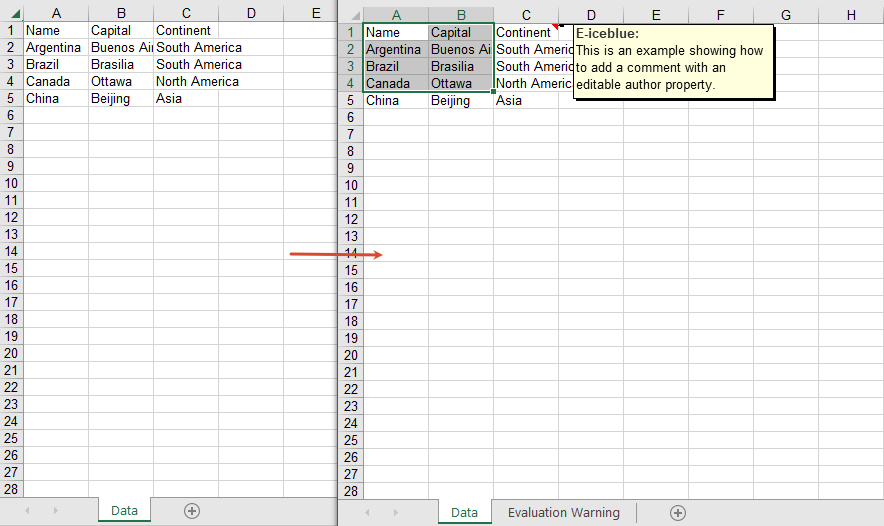
Read Comment Content
You can read the comment on a cell through the CellRange.Comment property.
function App() {
  const readComment = async () => {
    // Get the Spire.XLS WASM module
    const xlsModule = window.wasmModule?.spirexls;

    // Check if the module is ready
    if (!xlsModule) {
      alert('Spire.Xls is not ready yet');
      return;
    }

    // Load the Excel file into VFS
    const inputFileName = 'CommentsSample.xlsx';
    await window.spire.FetchFileToVFS(inputFileName, '', `${process.env.PUBLIC_URL}data/`);

    // Load the workbook
    const workbook = new xlsModule.Workbook();
    workbook.LoadFromFile({ fileName: inputFileName });

    // Get the first worksheet
    const sheet = workbook.Worksheets.get(0);

    // Get the comment text
    const builder = [];
    builder.push(sheet.Range.get('A1').Comment.Text + '\n\t');
    builder.push(sheet.Range.get('A2').Comment.Text);

    // Save the comment content to a txt file
    const outputFileName = 'ReadComment_output.txt';
    window.dotnetRuntime.Module.FS.writeFile(outputFileName, builder.join('\n'));
    workbook.Dispose();

    // Read the generated file from VFS and trigger the download
    const fileArray = window.dotnetRuntime.Module.FS.readFile(outputFileName);
    const blob = new Blob([fileArray], { type: 'text/plain' });
    const url = URL.createObjectURL(blob);
    const a = document.createElement('a');
    a.href = url;
    a.download = outputFileName;
    a.click();
    URL.revokeObjectURL(url);
  };

  return (
    <div style={{ textAlign: 'center', height: '300px' }}>
      <h1>Read Comment</h1>
      <button onClick={readComment}>Start</button>
    </div>
  );
}

export default App;
The read comment content 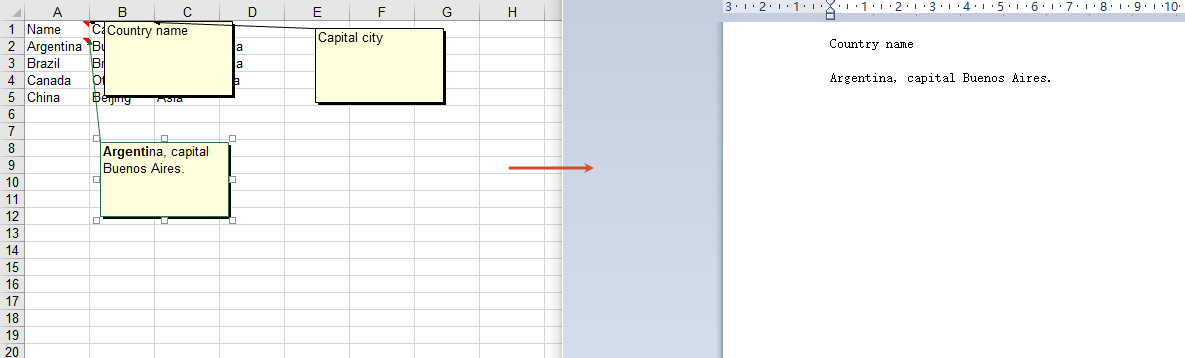
Edit Comment Content
Get a comment by index through Comments.get(0), and then modify its text content.
function App() {
  const editComment = async () => {
    // Get the Spire.XLS WASM module
    const xlsModule = window.wasmModule?.spirexls;

    // Check if the module is ready
    if (!xlsModule) {
      alert('Spire.Xls is not ready yet');
      return;
    }

    // Load the font and the Excel file into VFS
    await window.spire.FetchFileToVFS('ARIAL.TTF', '/Library/Fonts/', `${process.env.PUBLIC_URL}/font/`);
    const inputFileName = 'CommentsSample.xlsx';
    await window.spire.FetchFileToVFS(inputFileName, '', `${process.env.PUBLIC_URL}data/`);

    // Load the workbook
    const workbook = new xlsModule.Workbook();
    workbook.LoadFromFile({ fileName: inputFileName });

    // Get the first worksheet
    const sheet = workbook.Worksheets.get(0);

    // Get the first comment
    const comment = sheet.Comments.get(0);

    // Edit the comment content
    comment.Text = 'This comment has been edited by Spire.XLS.';

    // Save the workbook
    const outputFileName = 'EditExcelComment_output.xlsx';
    workbook.SaveToFile({ fileName: outputFileName, version: xlsModule.ExcelVersion.Version2010 });

    // Release resources
    workbook.Dispose();

    // Read the generated file from VFS and trigger the download
    const fileArray = window.dotnetRuntime.Module.FS.readFile(outputFileName);
    const blob = new Blob([fileArray], { type: 'application/vnd.openxmlformats-officedocument.spreadsheetml.sheet' });
    const url = URL.createObjectURL(blob);
    const a = document.createElement('a');
    a.href = url;
    a.download = outputFileName;
    a.click();
    URL.revokeObjectURL(url);
  };

  return (
    <div style={{ textAlign: 'center', height: '300px' }}>
      <h1>Edit Excel Comment</h1>
      <button onClick={editComment}>Start</button>
    </div>
  );
}

export default App;
The edited comment content 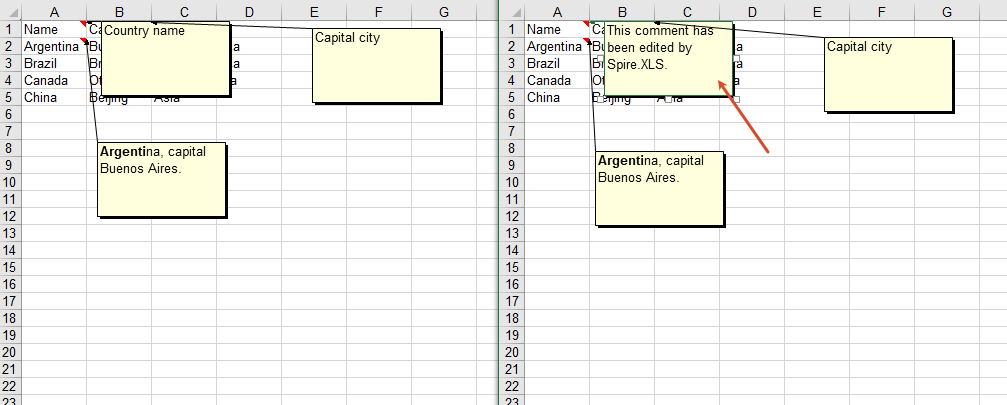
Delete Comments
You can delete all comments in a worksheet through the Comments.Clear method.
function App() {
  const removeComment = async () => {
    // Get the Spire.XLS WASM module
    const xlsModule = window.wasmModule?.spirexls;

    // Check if the module is ready
    if (!xlsModule) {
      alert('Spire.Xls is not ready yet');
      return;
    }

    // Load the font and the Excel file into VFS
    await window.spire.FetchFileToVFS('ARIAL.TTF', '/Library/Fonts/', `${process.env.PUBLIC_URL}/font/`);
    const inputFileName = 'CommentsSample.xlsx';
    await window.spire.FetchFileToVFS(inputFileName, '', `${process.env.PUBLIC_URL}data/`);

    // Load the workbook
    const workbook = new xlsModule.Workbook();
    workbook.LoadFromFile({ fileName: inputFileName });

    // Get all comments of the first worksheet
    const comments = workbook.Worksheets.get(0).Comments;

    // Clear all comments; alternatively, use comments.RemoveAt(0) to delete a comment by index
    comments.Clear();

    // Save the workbook
    const outputFileName = 'RemoveComment_output.xlsx';
    workbook.SaveToFile({ fileName: outputFileName, version: xlsModule.ExcelVersion.Version2010 });

    // Release resources
    workbook.Dispose();

    // Read the generated file from VFS and trigger the download
    const fileArray = window.dotnetRuntime.Module.FS.readFile(outputFileName);
    const blob = new Blob([fileArray], { type: 'application/vnd.openxmlformats-officedocument.spreadsheetml.sheet' });
    const url = URL.createObjectURL(blob);
    const a = document.createElement('a');
    a.href = url;
    a.download = outputFileName;
    a.click();
    URL.revokeObjectURL(url);
  };

  return (
    <div style={{ textAlign: 'center', height: '300px' }}>
      <h1>Remove Comment</h1>
      <button onClick={removeComment}>Start</button>
    </div>
  );
}

export default App;
After deleting comments 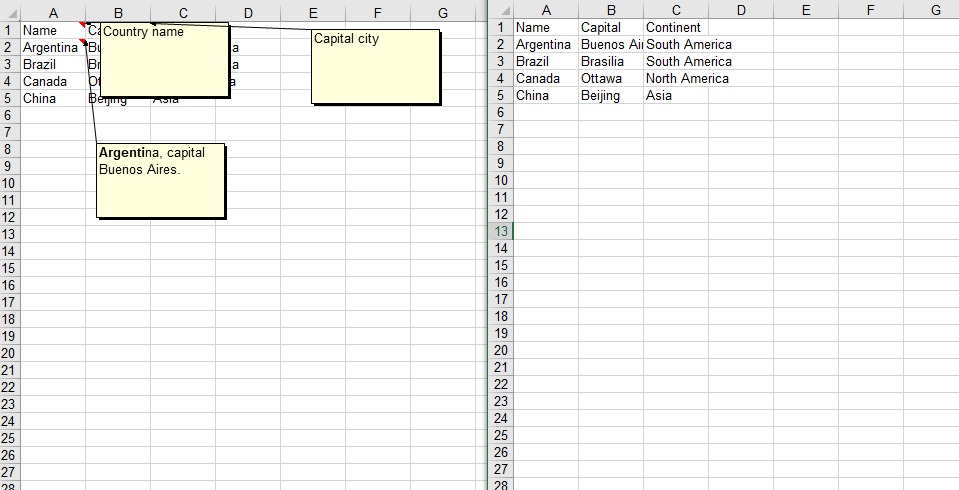
FAQ
Comment is not visible after being added
Cause: The IsVisible property was not set to true after adding the comment, so the comment remains hidden by default.
Solution: Set comment.IsVisible = true after adding the comment to make it visible in the worksheet.
Empty content is returned when reading a comment
Cause: There is no comment on the target cell, or an incorrect cell reference was used.
Solution: Confirm that the target cell has a comment, and access the comment content through methods such as sheet.Range.get('A1').Comment.
Get a Free License
If you want to remove the evaluation messages in the resulting documents, or get rid of functional limitations, please contact sales to obtain a temporary license valid for 30 days.
Create, Filter, and Update Excel Pivot Tables with JavaScript in React
A pivot table (PivotTable) is a core tool in Excel for quickly summarizing and analyzing large amounts of data. By dragging and dropping fields, you can easily perform data statistics and comparisons. Spire.XLS for JavaScript is based on WebAssembly and can create, filter, and update pivot tables directly in the browser. It manages input and output files through a virtual file system (VFS), so no backend services are required.
This article covers three core features:
For installation and project configuration, please refer to How to Integrate Spire.XLS for JavaScript in a React Project. The examples below assume that Spire.XLS is installed and the WebAssembly module has been initialized.
Create a Pivot Table
Creating a pivot table usually involves four steps: preparing the source data, adding a pivot table, laying out the fields, and calculating the data. The following example writes a product sales record into the first worksheet, creates a cache based on the data range using the PivotCaches.Add method, adds a pivot table to the worksheet using the PivotTables.Add method, and finally drags fields into the row area and the data area to complete the layout.
function App() {
  const createPivotTable = async () => {
    // Get the Spire.XLS WASM module
    const xlsModule = window.wasmModule?.spirexls;

    // Check if the module is ready
    if (!xlsModule) {
      alert('Spire.Xls is not ready yet');
      return;
    }

    // Load the font into the VFS
    await window.spire.FetchFileToVFS('ARIAL.TTF', '/Library/Fonts/', `${process.env.PUBLIC_URL}/font/`);

    // Create a new workbook
    const workbook = new xlsModule.Workbook();

    // Get the first worksheet
    const sheet = workbook.Worksheets.get(0);

    // Write source data to cells
    sheet.Range.get('A1').Value = 'Product';
    sheet.Range.get('B1').Value = 'Month';
    sheet.Range.get('C1').Value = 'Count';

    sheet.Range.get('A2').Value = 'SpireDoc';
    sheet.Range.get('A3').Value = 'SpireDoc';
    sheet.Range.get('A4').Value = 'SpireXls';
    sheet.Range.get('A5').Value = 'SpireDoc';
    sheet.Range.get('A6').Value = 'SpireXls';
    sheet.Range.get('A7').Value = 'SpireXls';

    sheet.Range.get('B2').Value = 'January';
    sheet.Range.get('B3').Value = 'February';
    sheet.Range.get('B4').Value = 'January';
    sheet.Range.get('B5').Value = 'January';
    sheet.Range.get('B6').Value = 'February';
    sheet.Range.get('B7').Value = 'February';

    sheet.Range.get('C2').Value = '10';
    sheet.Range.get('C3').Value = '15';
    sheet.Range.get('C4').Value = '9';
    sheet.Range.get('C5').Value = '7';
    sheet.Range.get('C6').Value = '8';
    sheet.Range.get('C7').Value = '10';

    // Create a pivot table cache based on the data range
    const dataRange = sheet.Range.get('A1:C7');
    const cache = workbook.PivotCaches.Add({ range: dataRange });

    // Add a pivot table
    const pt = sheet.PivotTables.Add('Pivot Table', sheet.Range.get({ row: 10, column: 5 }), cache);

    // Drag fields into the row area
    const pf1 = pt.PivotFields.get_Item('Product');
    pf1.Axis = xlsModule.AxisTypes.Row;
    const pf2 = pt.PivotFields.get_Item('Month');
    pf2.Axis = xlsModule.AxisTypes.Row;

    // Drag fields into the data area
    pt.DataFields.Add(pt.PivotFields.get_Item('Count'), 'Sum of Count', xlsModule.SubtotalTypes.Sum);

    // Set the pivot table style
    pt.BuiltInStyle = xlsModule.PivotBuiltInStyles.PivotStyleMedium12;

    // Calculate the pivot table data
    pt.CalculateData();
    sheet.AutoFitColumn(5);
    sheet.AutoFitColumn(6);

    // Save the workbook
    const outputFileName = 'CreatePivotTable_output.xlsx';
    workbook.SaveToFile({ fileName: outputFileName, version: xlsModule.ExcelVersion.Version2010 });

    // Release resources
    workbook.Dispose();

    // Read the generated file from the VFS and trigger the download
    const fileArray = window.dotnetRuntime.Module.FS.readFile(outputFileName);
    const blob = new Blob([fileArray], { type: 'application/vnd.openxmlformats-officedocument.spreadsheetml.sheet' });
    const url = URL.createObjectURL(blob);
    const a = document.createElement('a');
    a.href = url;
    a.download = outputFileName;
    a.click();
    URL.revokeObjectURL(url);
  };

  return (
    <div style={{ textAlign: 'center', height: '300px' }}>
      <h1>Create Pivot Table</h1>
      <button onClick={createPivotTable}>Start</button>
    </div>
  );
}

export default App;
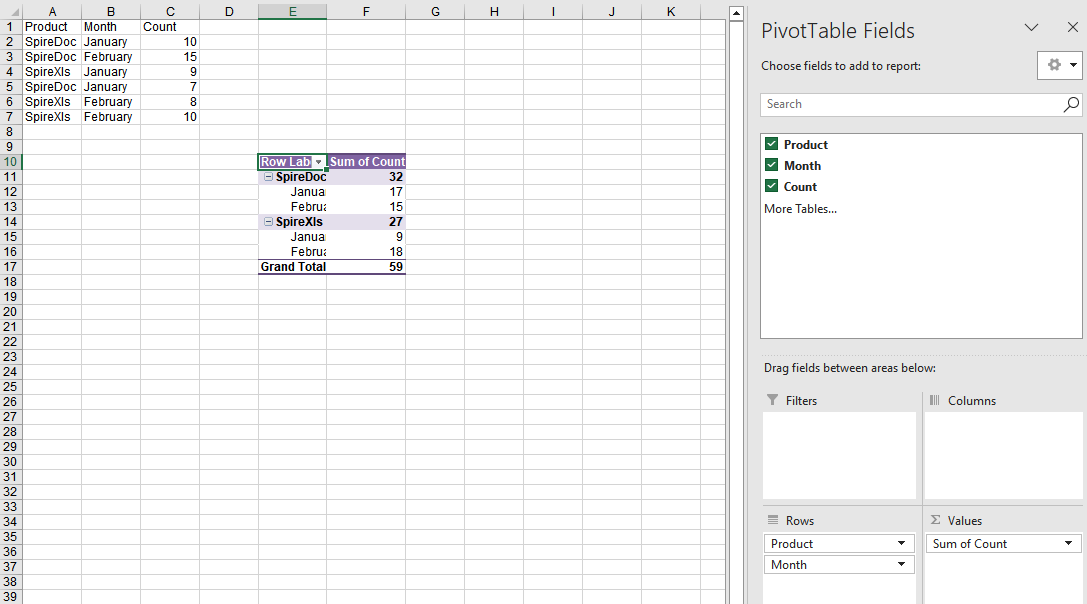
After calculating with the CalculateData method, the pivot table summarizes the total count of each product by product and month, displayed with the set PivotStyleMedium12 style.
Filter a Pivot Table
When a pivot table contains a lot of data, you can add filters to the row fields to keep only the data rows that meet the conditions.
function App() {
  const filterPivotTable = async () => {
    // Get the Spire.XLS WASM module
    const xlsModule = window.wasmModule?.spirexls;

    // Check if the module is ready
    if (!xlsModule) {
      alert('Spire.Xls is not ready yet');
      return;
    }

    // Load the font and the Excel file into the VFS
    await window.spire.FetchFileToVFS('ARIAL.TTF', '/Library/Fonts/', `${process.env.PUBLIC_URL}/font/`);
    const inputFileName = 'PivotTableExample.xlsx';
    await window.spire.FetchFileToVFS(inputFileName, '', `${process.env.PUBLIC_URL}data/`);

    // Load the workbook
    const workbook = new xlsModule.Workbook();
    workbook.LoadFromFile({ fileName: inputFileName, version: xlsModule.ExcelVersion.Version2010 });

    // Get the first pivot table in the second worksheet (PivotTable)
    const pt = workbook.Worksheets.get(1).PivotTables.get(0);

    // Get the first row field of the pivot table
    const rowField = pt.RowFields.get(0);

    // Add a value filter to the row field: values of the first data field less than 5300000
    rowField.AddValueFilter(xlsModule.PivotValueFilterType.LessThan, pt.DataFields.get(0), window.spire.Double.Create(5300000), new window.spire.SpireObject(0));

    // Recalculate the pivot table data
    pt.CalculateData();

    // Save the workbook
    const outputFileName = 'FilterPivotTable_output.xlsx';
    workbook.SaveToFile({ fileName: outputFileName, version: xlsModule.ExcelVersion.Version2010 });

    // Release resources
    workbook.Dispose();

    // Read the generated file from the VFS and trigger the download
    const fileArray = window.dotnetRuntime.Module.FS.readFile(outputFileName);
    const blob = new Blob([fileArray], { type: 'application/vnd.openxmlformats-officedocument.spreadsheetml.sheet' });
    const url = URL.createObjectURL(blob);
    const a = document.createElement('a');
    a.href = url;
    a.download = outputFileName;
    a.click();
    URL.revokeObjectURL(url);
  };

  return (
    <div style={{ textAlign: 'center', height: '300px' }}>
      <h1>Filter Pivot Table</h1>
      <button onClick={filterPivotTable}>Start</button>
    </div>
  );
}

export default App;
Original pivot table data 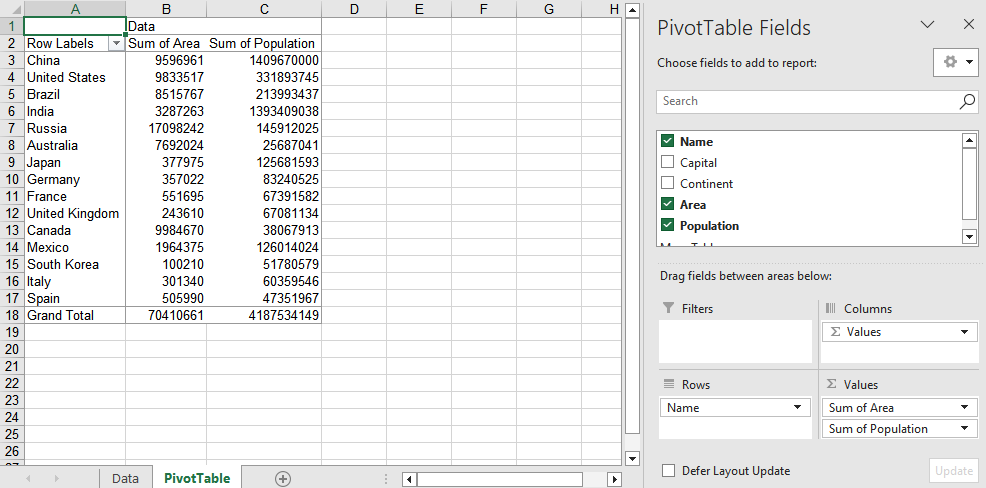
After filtering, the row area of the pivot table keeps only the data that meets the filter conditions, making it easy to focus on analyzing data in a specific range. 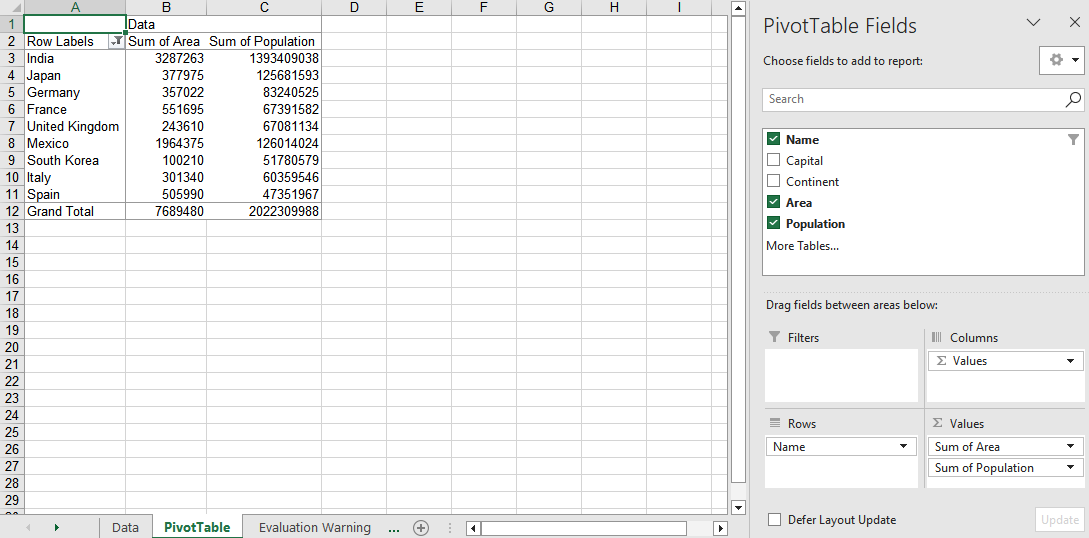
Update the Data Source and Refresh the Pivot Table
When the underlying data of a pivot table changes, you need to update the data source and refresh the pivot table cache so that the pivot table reflects the latest summary results.
function App() {
  const updateDataSource = async () => {
    // Get the Spire.XLS WASM module
    const xlsModule = window.wasmModule?.spirexls;

    // Check if the module is ready
    if (!xlsModule) {
      alert('Spire.Xls is not ready yet');
      return;
    }

    // Load the font and the Excel file into the VFS
    await window.spire.FetchFileToVFS('ARIAL.TTF', '/Library/Fonts/', `${process.env.PUBLIC_URL}/font/`);
    const inputFileName = 'PivotTableExample.xlsx';
    await window.spire.FetchFileToVFS(inputFileName, '', `${process.env.PUBLIC_URL}data/`);

    // Load the workbook
    const workbook = new xlsModule.Workbook();
    workbook.LoadFromFile({ fileName: inputFileName, version: xlsModule.ExcelVersion.Version2010 });

    // Get the data source worksheet and modify the cell values in it
    const data = workbook.Worksheets.get('Data');
    data.Range.get('A2').Text = 'NewValue';
    data.Range.get('D2').NumberValue = 28000;

    // Get the worksheet that contains the pivot table
    const sheet = workbook.Worksheets.get({ sheetName: 'PivotTable' });

    // Get the first pivot table on the worksheet
    const pt = sheet.PivotTables.get(0);

    // Refresh the pivot table cache
    pt.Cache.IsRefreshOnLoad = true;

    // Calculate and update the pivot table data
    pt.CalculateData();

    // Save the workbook
    const outputFileName = 'UpdateDataSource_output.xlsx';
    workbook.SaveToFile({ fileName: outputFileName, version: xlsModule.ExcelVersion.Version2010 });

    // Release resources
    workbook.Dispose();

    // Read the generated file from the VFS and trigger the download
    const fileArray = window.dotnetRuntime.Module.FS.readFile(outputFileName);
    const blob = new Blob([fileArray], { type: 'application/vnd.openxmlformats-officedocument.spreadsheetml.sheet' });
    const url = URL.createObjectURL(blob);
    const a = document.createElement('a');
    a.href = url;
    a.download = outputFileName;
    a.click();
    URL.revokeObjectURL(url);
  };

  return (
    <div style={{ textAlign: 'center', height: '300px' }}>
      <h1>Update Pivot Table Data Source</h1>
      <button onClick={updateDataSource}>Start</button>
    </div>
  );
}

export default App;
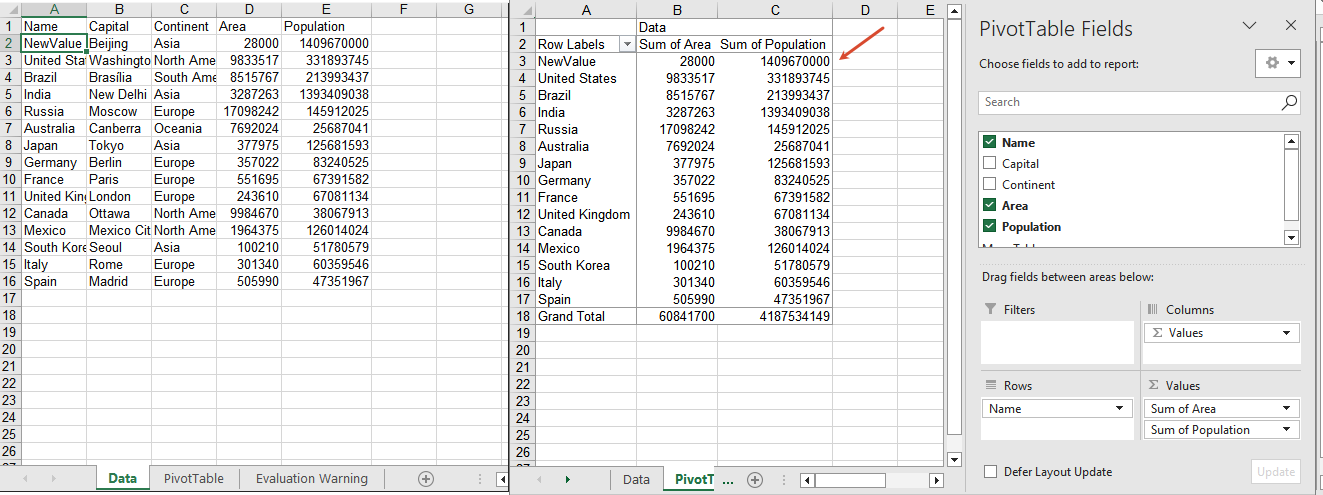
After the data source is updated and refreshed, the corresponding summary results in the pivot table are updated synchronously.
Frequently Asked Questions
No summary data is displayed after creating a pivot table
Cause: The CalculateData method is not called after adding fields to the pivot table, or the data fields are not correctly added to the data area.
Solution: Call pt.CalculateData() to recalculate the pivot table after completing the field layout, and make sure the numeric fields are added to the data area through the DataFields.Add method.
The pivot table data does not change after adding a filter
Cause: The CalculateData method is not called to recalculate after adding a label or value filter, or the filter is added to the wrong field.
Solution: Call pt.CalculateData() to recalculate the pivot table, and confirm that you use a property such as pt.RowFields.get(0) to get the correct field before adding the filter.
The pivot table data does not change after updating the data source
Cause: The pivot table cache is not refreshed after modifying the data source, so the pivot table still retains the old data.
Solution: After modifying the data source, set pt.Cache.IsRefreshOnLoad to true and call pt.CalculateData(), so that the pivot table is recalculated based on the latest data source.
Get a Free License
If you want to remove the evaluation message from the result document or get rid of the feature limitations, please contact sales to get a 30-day temporary license.
Add, Get, and Remove Excel Data Validation with JavaScript in React
Data validation is an effective way to control the input content of Excel cells. It can intercept incorrect input at the data entry stage, ensuring that data is standardized and accurate. Spire.XLS for JavaScript uses WebAssembly to add, read, and remove data validation directly in the browser, managing input and output files through a virtual file system (VFS) — no backend server required.
This article covers three core features:
For installation and project configuration, refer to Integrating Spire.XLS for JavaScript in a React Project. The examples below assume Spire.XLS is installed and the WebAssembly module is initialized.
Add Data Validation
In daily forms and reports, we often need to restrict the input of cells, for example only allowing numbers or dates within a certain range, or limiting the text length. Spire.XLS for JavaScript sets validation rules through the DataValidation property of a cell, supporting multiple validation types such as Decimal, Whole Number, Date, Time, Text Length, and List.
function App() {
  const sheetToSVG = async () => {
    // Get the Spire.XLS WASM module
    const xlsModule = window.wasmModule?.spirexls;

    // Check if the module is ready
    if (!xlsModule) {
      alert('Spire.Xls is not ready yet');
      return;
    }

    // Load the font into VFS
    await window.spire.FetchFileToVFS('ARIAL.TTF', '/Library/Fonts/', `${process.env.PUBLIC_URL}/font/`);

    // Create a new workbook
    const workbook = new xlsModule.Workbook();

    // Get the first worksheet
    const sheet = workbook.Worksheets.get(0);

    // Add a decimal validation: cell B12 can only accept numbers between 3 and 6
    sheet.Range.get("B11").Text = "Input Number(3-6):";
    let rangeNumber = sheet.Range.get("B12");
    rangeNumber.DataValidation.CompareOperator = xlsModule.ValidationComparisonOperator.Between;
    rangeNumber.DataValidation.Formula1 = "3";
    rangeNumber.DataValidation.Formula2 = "6";
    rangeNumber.DataValidation.AllowType = xlsModule.CellDataType.Decimal;
    rangeNumber.DataValidation.ErrorMessage = "Please input correct number!";
    rangeNumber.DataValidation.ShowError = true;
    rangeNumber.Style.KnownColor = xlsModule.ExcelColors.Gray25Percent;

    // Add a date validation: cell B15 can only accept dates within the year 2024
    sheet.Range.get("B14").Text = "Input Date: 1/1/2024";
    let rangeDate = sheet.Range.get("B15");
    rangeDate.DataValidation.AllowType = xlsModule.CellDataType.Date;
    rangeDate.DataValidation.CompareOperator = xlsModule.ValidationComparisonOperator.Between;
    rangeDate.DataValidation.Formula1 = "1/1/2024";
    rangeDate.DataValidation.Formula2 = "12/31/2024";
    rangeDate.DataValidation.ErrorMessage = "Please input correct date!";
    rangeDate.DataValidation.ShowError = true;
    // Supports setting AlertStyleType.Warning; AlertStyleType.Info; AlertStyleType.Stop
    rangeDate.DataValidation.AlertStyle = xlsModule.AlertStyleType.Warning;
    rangeDate.Style.KnownColor = xlsModule.ExcelColors.Gray25Percent;

    // Add a text length validation: the text length in cell B18 cannot exceed 5 characters
    sheet.Range.get("B17").Text = "Input Text:";
    let rangeTextLength = sheet.Range.get("B18");
    rangeTextLength.DataValidation.AllowType = xlsModule.CellDataType.TextLength;
    rangeTextLength.DataValidation.CompareOperator = xlsModule.ValidationComparisonOperator.LessOrEqual;
    rangeTextLength.DataValidation.Formula1 = "5";
    rangeTextLength.DataValidation.ErrorMessage = "Enter a Valid String!";
    rangeTextLength.DataValidation.ShowError = true;
    rangeTextLength.DataValidation.AlertStyle = xlsModule.AlertStyleType.Stop;
    rangeTextLength.Style.KnownColor = xlsModule.ExcelColors.Gray25Percent;

    // Auto-fit the width of column 2
    sheet.AutoFitColumn(2);

    const outputFileName = "DataValidation_out.xlsx";
    workbook.SaveToFile({ fileName: outputFileName, version: xlsModule.ExcelVersion.Version2010 });

    // Release the workbook object to free resources
    workbook.Dispose();

    // Read the converted file from VFS and trigger the download
    const fileArray = window.dotnetRuntime.Module.FS.readFile(outputFileName);
    const blob = new Blob([fileArray], { type: "application/vnd.openxmlformats-officedocument.spreadsheetml.sheet" });
    const url = URL.createObjectURL(blob);
    const a = document.createElement('a');
    a.href = url;
    a.download = outputFileName;
    a.click();
    URL.revokeObjectURL(url);
  };

  return (
    <div style={{ textAlign: 'center', height: '300px' }}>
      <h1>Add Data Validation</h1>
      <button onClick={sheetToSVG}>
        Start
      </button>
    </div>
  );
}

export default App;
Add data validation 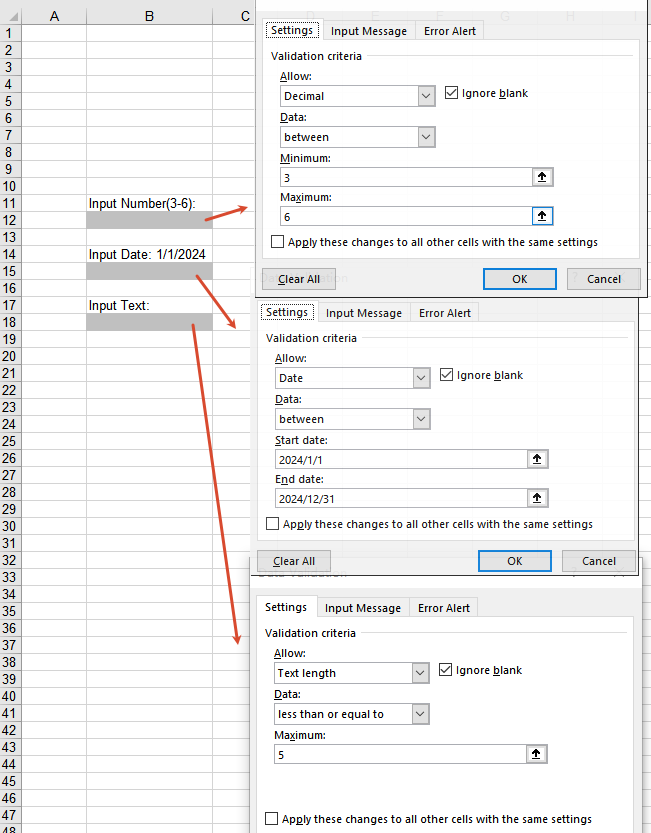
Get Data Validation Settings
When processing an Excel document that already has data validation, you may sometimes need to read the validation rules to understand the input constraints of a cell. Through the DataValidation property of a cell, you can obtain the validation object and then read settings such as AllowType (validation type), CompareOperator (comparison operator), Formula1 (minimum/lower limit), Formula2 (maximum/upper limit), and IgnoreBlank (whether blank values are ignored).
function App() {
  const sheetToSVG = async () => {
    // Get the Spire.XLS WASM module
    const xlsModule = window.wasmModule?.spirexls;

    // Check if the module is ready
    if (!xlsModule) {
      alert('Spire.Xls is not ready yet');
      return;
    }

    // Load the font and Excel file into VFS
    await window.spire.FetchFileToVFS('ARIAL.TTF', '/Library/Fonts/', `${process.env.PUBLIC_URL}/font/`);
    const inputFileName = 'GetSettingsOfDataValidation.xlsx';
    await window.spire.FetchFileToVFS(inputFileName, '', `${process.env.PUBLIC_URL}/static/data/`);

    // Load the workbook
    const workbook = new xlsModule.Workbook();
    workbook.LoadFromFile({ fileName: inputFileName });

    // Get the first worksheet
    const worksheet = workbook.Worksheets.get(0);

    // Cell B4 has a decimal validation set
    const cell = worksheet.Range.get("B4");

    // Get the data validation object of this cell
    const validation = cell.DataValidation;

    // Get the validation settings
    let allowType = validation.AllowType.toString();
    let data = validation.CompareOperator.toString();
    let minimum = validation.Formula1.toString();
    let maximum = validation.Formula2.toString();
    let ignoreBlank = validation.IgnoreBlank.toString();

    // Concatenate the result into a string
    let result = `Settings of Validation: \r\nAllow Type: ${allowType}\r\nData: ${data}\r\nMinimum: ${minimum}\r\nMaximum: ${maximum}\r\nIgnoreBlank: ${ignoreBlank}`;

    const outputFileName = 'GetSettingsOfDataValidation-out.txt';

    // Write the result to a txt file
    window.dotnetRuntime.Module.FS.writeFile(outputFileName, result);

    // Release the workbook object to free resources
    workbook.Dispose();

    // Read the converted file from VFS and trigger the download
    const fileArray = window.dotnetRuntime.Module.FS.readFile(outputFileName);
    const blob = new Blob([fileArray], { type: 'text/plain' });
    const url = URL.createObjectURL(blob);
    const a = document.createElement('a');
    a.href = url;
    a.download = outputFileName;
    a.click();
    URL.revokeObjectURL(url);
  };

  return (
    <div style={{ textAlign: 'center', height: '300px' }}>
      <h1>Get Data Validation Settings</h1>
      <button onClick={sheetToSVG}>
        Start
      </button>
    </div>
  );
}

export default App;
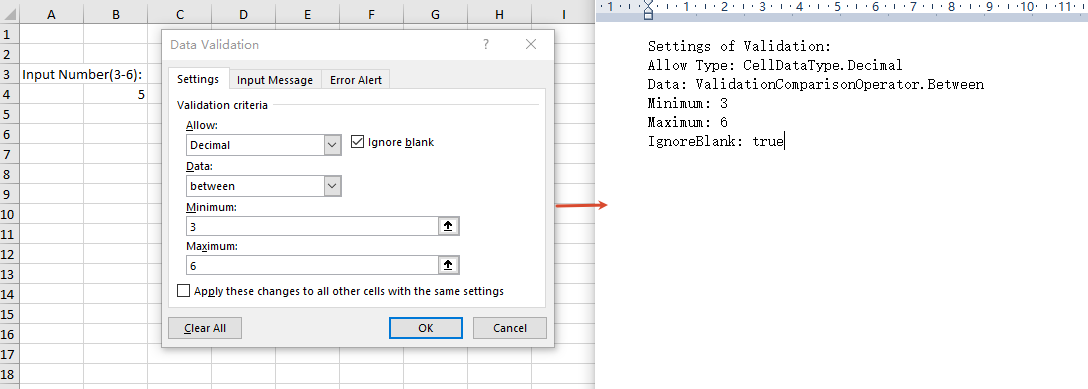
Remove Data Validation
When the validation rules are no longer needed, you can remove data validation in bulk by cell range through the Remove method of the worksheet's DVTable. When removing, you need to pass in an array composed of rectangles, which are used to locate the ranges in the worksheet where the validations should be removed.
function App() {
  const sheetToSVG = async () => {
    // Get the Spire.XLS WASM module
    const xlsModule = window.wasmModule?.spirexls;

    // Check if the module is ready
    if (!xlsModule) {
      alert('Spire.Xls is not ready yet');
      return;
    }

    // Load the font and Excel file into VFS
    await window.spire.FetchFileToVFS('ARIAL.TTF', '/Library/Fonts/', `${process.env.PUBLIC_URL}/font/`);
    const inputFileName = 'RemoveDataValidation.xlsx';
    await window.spire.FetchFileToVFS(inputFileName, '', `${process.env.PUBLIC_URL}/static/data/`);

    // Load the workbook
    const workbook = new xlsModule.Workbook();
    workbook.LoadFromFile({ fileName: inputFileName });

    // Create an array of rectangles, which is used to locate the ranges in the worksheet
    let rectangles = [];

    // Add a rectangle to the array. This rectangle specifies the cells from A1 to B3.
    rectangles.push(xlsModule.Rectangle.FromLTRB(0, 0, 1, 2));

    // Remove the validations in the ranges represented by the rectangles
    workbook.Worksheets.get(0).DVTable.Remove(rectangles);

    const outputFileName = 'RemoveDataValidation-out.xlsx';
    workbook.SaveToFile({ fileName: outputFileName, version: xlsModule.ExcelVersion.Version2010 });

    // Release the workbook object to free resources
    workbook.Dispose();

    // Read the converted file from VFS and trigger the download
    const fileArray = window.dotnetRuntime.Module.FS.readFile(outputFileName);
    const blob = new Blob([fileArray], { type: "application/vnd.openxmlformats-officedocument.spreadsheetml.sheet" });
    const url = URL.createObjectURL(blob);
    const a = document.createElement('a');
    a.href = url;
    a.download = outputFileName;
    a.click();
    URL.revokeObjectURL(url);
  };

  return (
    <div style={{ textAlign: 'center', height: '300px' }}>
      <h1>Remove Data Validation</h1>
      <button onClick={sheetToSVG}>
        Start
      </button>
    </div>
  );
}

export default App;
Remove data validation 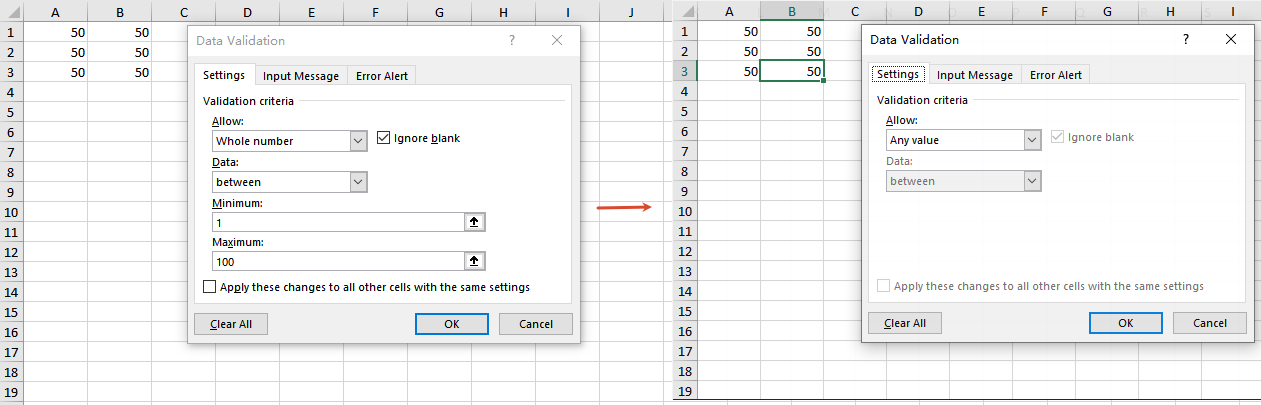
Frequently Asked Questions
The added data validation does not take effect
Cause: Other validation rules already exist on the target cell, or the validation type or comparison operator does not match the requirement.
Solution: Make sure the validation rule is applied to the correct cell range, and check whether the values of properties such as AllowType, CompareOperator, Formula1, and Formula2 meet the expectation.
The result is empty when getting data validation settings
Cause: No data validation is set on the target cell, or the cell range being read does not match the location of the validation.
Solution: Make sure the cell has data validation set, and check whether the cell address referenced by the Range.get method is correct.
Data validation still exists after removal
Cause: The rectangle range passed to the DVTable.Remove method does not cover the actual validation area.
Solution: Adjust the coordinates in the Rectangle.FromLTRB method according to the cell range covered by the validations, ensuring that the rectangle range includes all the cells whose validations need to be removed.
Get a Free License
If you want to remove the evaluation messages in the output documents, or get rid of the feature limitations, please contact our sales team to obtain a free 30-day temporary license.
Apply Conditional Formatting to Excel with JavaScript in React
Conditional formatting is an important means to visually display data in Excel. It automatically applies colors, bars, and other visual effects to cells based on their values or dates, so that high and low values and key dates in a report are clear at a glance. Spire.XLS for JavaScript applies conditional formatting to cell ranges directly in the browser based on WebAssembly, managing input and output files through a virtual file system (VFS) without the need for backend services.
This article covers three core features:
- Apply Data Bars to a Cell Range
- Conditionally Format Dates
- Create a Formula-Based Conditional Format
For installation and project configuration, refer to How to Integrate Spire.XLS for JavaScript in a React Project. The examples below assume that Spire.XLS has been installed and the WebAssembly module has been initialized.
Apply Data Bars to a Cell Range
Data bars intuitively reflect the relative size of values through the length of the horizontal bars filled in cells — the larger the value, the longer the bar. Spire.XLS for JavaScript creates a conditional format collection with the ConditionalFormats.Add method, adds a data bar condition with AddCondition, and customizes the bar color with DataBar.BarColor.
function App() {
  const sheetToSVG = async () => {
    // Get the Spire.XLS WASM module
    const xlsModule = window.wasmModule?.spirexls;

    // Check if the module is ready
    if (!xlsModule) {
      alert('Spire.Xls is not ready yet');
      return;
    }

    // Load the font file into the VFS
    await window.spire.FetchFileToVFS('ARIAL.TTF', '/Library/Fonts/', `${process.env.PUBLIC_URL}/font/`);

    // Create a workbook
    const workbook = new xlsModule.Workbook();

    // Get the first worksheet
    const sheet = workbook.Worksheets.get(0);

    // Insert data into the cell range A1:C4
    sheet.Range.get("A1").NumberValue = 582;
    sheet.Range.get("A2").NumberValue = 234;
    sheet.Range.get("A3").NumberValue = 314;
    sheet.Range.get("A4").NumberValue = 50;
    sheet.Range.get("B1").NumberValue = 150;
    sheet.Range.get("B2").NumberValue = 894;
    sheet.Range.get("B3").NumberValue = 560;
    sheet.Range.get("B4").NumberValue = 900;
    sheet.Range.get("C1").NumberValue = 134;
    sheet.Range.get("C2").NumberValue = 700;
    sheet.Range.get("C3").NumberValue = 920;
    sheet.Range.get("C4").NumberValue = 450;
    sheet.AllocatedRange.RowHeight = 15;
    sheet.AllocatedRange.ColumnWidth = 17;

    // Add a conditional format and apply it to the data range
    const xcfs = sheet.ConditionalFormats.Add();
    xcfs.AddRange(sheet.AllocatedRange);

    // Add a data bar conditional format and set the bar color
    const format = xcfs.AddCondition();
    format.FormatType = xlsModule.ConditionalFormatType.DataBar;
    format.DataBar.BarColor = xlsModule.Color.get_CadetBlue();

    const outputFileName = 'ApplyDataBarsToCellRange_out.xlsx';
    workbook.SaveToFile({ fileName: outputFileName, version: xlsModule.ExcelVersion.Version2010 });

    // Dispose of the workbook object to free resources
    workbook.Dispose();

    // Read the converted file from the VFS and trigger the download
    const fileArray = window.dotnetRuntime.Module.FS.readFile(outputFileName);
    const blob = new Blob([fileArray], { type: "application/vnd.openxmlformats-officedocument.spreadsheetml.sheet" });
    const url = URL.createObjectURL(blob);
    const a = document.createElement('a');
    a.href = url;
    a.download = outputFileName;
    a.click();
    URL.revokeObjectURL(url);
  };

  return (
    <div style={{ textAlign: 'center', height: '300px' }}>
      <h1>Apply Data Bars to Cell Range</h1>
      <button onClick={sheetToSVG}>
        Start
      </button>
    </div>
  );
}

export default App;
Apply Data Bars to a Cell Range Effect 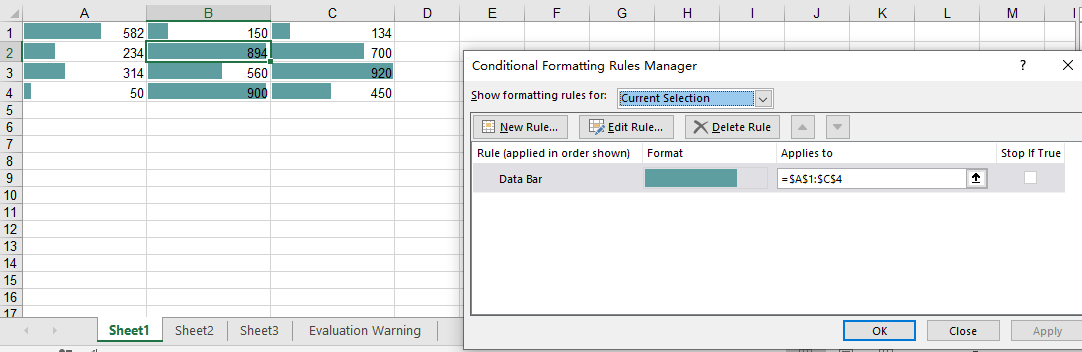
Conditionally Format Dates
In scenarios such as project management and sales reports, we often need to highlight dates within a recent period, for example records from the last 7 days. Spire.XLS for JavaScript adds a time-period-based date conditional format with the AddTimePeriodCondition method, and specifies the time range with the TimePeriodType enumeration.
function App() {
  const sheetToSVG = async () => {
    // Get the Spire.XLS WASM module
    const xlsModule = window.wasmModule?.spirexls;

    // Check if the module is ready
    if (!xlsModule) {
      alert('Spire.Xls is not ready yet');
      return;
    }

    // Load the font and Excel file into the VFS
    await window.spire.FetchFileToVFS('ARIAL.TTF', '/Library/Fonts/', `${process.env.PUBLIC_URL}/font/`);
    const inputFileName = 'ConditionallyFormatDate.xlsx';
    await window.spire.FetchFileToVFS(inputFileName, '', `${process.env.PUBLIC_URL}data/`);

    // Load the workbook
    const workbook = new xlsModule.Workbook();
    workbook.LoadFromFile({ fileName: inputFileName });

    // Get the first worksheet
    const sheet = workbook.Worksheets.get(0);

    // Add a conditional format and apply it to the data range
    const xcfs = sheet.ConditionalFormats.Add();
    xcfs.AddRange(sheet.AllocatedRange);

    // Highlight cells whose date falls within the last 7 days
    const conditionalFormat = xcfs.AddTimePeriodCondition(xlsModule.TimePeriodType.Last7Days);
    conditionalFormat.BackColor = xlsModule.Color.get_Orange();

    const outputFileName = 'ConditionallyFormatDate_out.xlsx';
    workbook.SaveToFile({ fileName: outputFileName, version: xlsModule.ExcelVersion.Version2010 });

    // Dispose of the workbook object to free resources
    workbook.Dispose();

    // Read the converted file from the VFS and trigger the download
    const fileArray = window.dotnetRuntime.Module.FS.readFile(outputFileName);
    const blob = new Blob([fileArray], { type: "application/vnd.openxmlformats-officedocument.spreadsheetml.sheet" });
    const url = URL.createObjectURL(blob);
    const a = document.createElement('a');
    a.href = url;
    a.download = outputFileName;
    a.click();
    URL.revokeObjectURL(url);
  };

  return (
    <div style={{ textAlign: 'center', height: '300px' }}>
      <h1>Conditionally Format Date</h1>
      <button onClick={sheetToSVG}>
        Start
      </button>
    </div>
  );
}

export default App;
Before Applying Date Conditional Formatting 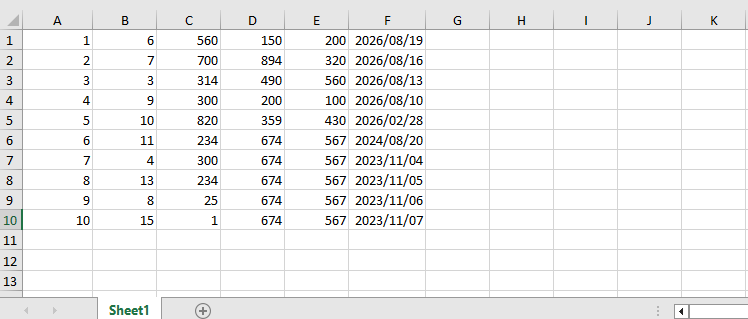 After Applying Date Conditional Formatting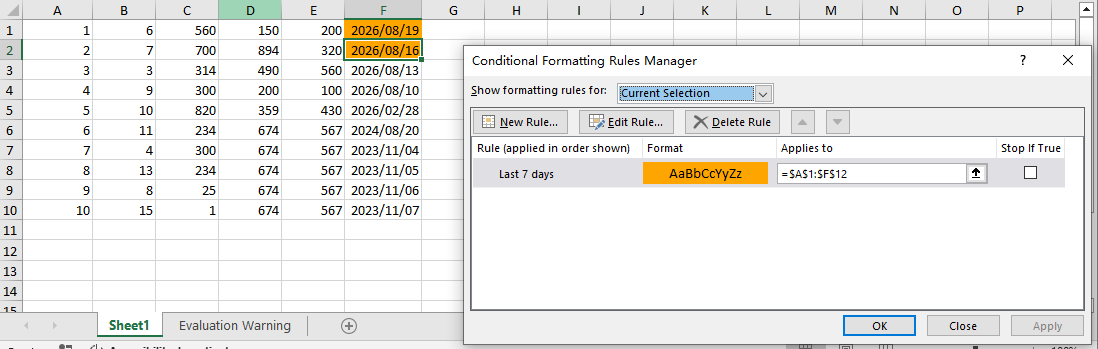
Create a Formula-Based Conditional Format
When the built-in conditional formats cannot meet your requirements, you can use a formula to define a custom judgment rule. Spire.XLS for JavaScript supports setting ConditionalFormatType to Formula and specifying the judgment formula with FirstFormula; cells that satisfy the formula will apply the configured background color.
function App() {
  const sheetToSVG = async () => {
    // Get the Spire.XLS WASM module
    const xlsModule = window.wasmModule?.spirexls;

    // Check if the module is ready
    if (!xlsModule) {
      alert('Spire.Xls is not ready yet');
      return;
    }

    // Load the font and Excel file into the VFS
    await window.spire.FetchFileToVFS('ARIAL.TTF', '/Library/Fonts/', `${process.env.PUBLIC_URL}/font/`);
    const inputFileName = 'ConditionallyFormatDate.xlsx';
    await window.spire.FetchFileToVFS(inputFileName, '', `${process.env.PUBLIC_URL}data/`);

    // Load the workbook
    const workbook = new xlsModule.Workbook();
    workbook.LoadFromFile({ fileName: inputFileName });

    // Get the first worksheet and its first column
    const sheet = workbook.Worksheets.get(0);
    const range = sheet.Columns.get(0);

    // Add a conditional format and apply it to the first column
    const xcfs = sheet.ConditionalFormats.Add();
    xcfs.AddRange(range);

    // Set the conditional format formula: apply the format when a cell in column A is less than the cell in column B of the same row
    const conditional = xcfs.AddCondition();
    conditional.FormatType = xlsModule.ConditionalFormatType.Formula;
    conditional.FirstFormula = "=($A1<$B1)";
    conditional.BackKnownColor = xlsModule.ExcelColors.Yellow;

    const outputFileName = 'CreateFormulaConditionalFormat_out.xlsx';
    workbook.SaveToFile({ fileName: outputFileName, version: xlsModule.ExcelVersion.Version2010 });

    // Dispose of the workbook object to free resources
    workbook.Dispose();

    // Read the converted file from the VFS and trigger the download
    const fileArray = window.dotnetRuntime.Module.FS.readFile(outputFileName);
    const blob = new Blob([fileArray], { type: "application/vnd.openxmlformats-officedocument.spreadsheetml.sheet" });
    const url = URL.createObjectURL(blob);
    const a = document.createElement('a');
    a.href = url;
    a.download = outputFileName;
    a.click();
    URL.revokeObjectURL(url);
  };

  return (
    <div style={{ textAlign: 'center', height: '300px' }}>
      <h1>Create Formula Conditional Format</h1>
      <button onClick={sheetToSVG}>
        Start
      </button>
    </div>
  );
}

export default App;
Apply Formula Conditional Formatting 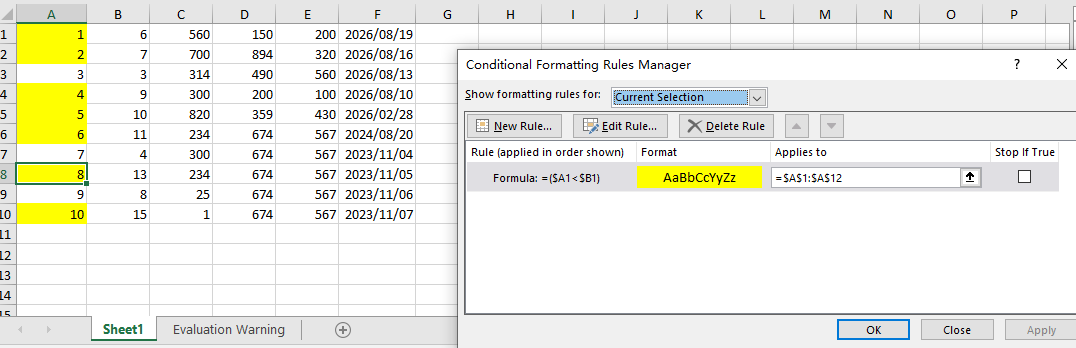
FAQ
Conditional formatting is not displayed when the file is opened in older versions of Excel
Cause: Conditional formats such as data bars, time periods, and formulas belong to the Excel 2007+ (XLSX) format capabilities. Saving with an older format may cause the conditional formatting to be lost or not displayed.
Solution: Explicitly specify the file version as Excel 2010 when saving, for example:
workbook.SaveToFile({
  fileName: 'output.xlsx',
  version: xlsModule.ExcelVersion.Version2010
});
The date conditional format has no effect
Cause: The date data in the target cells is actually stored as text or plain numbers rather than real date values, so the time-period-based judgment cannot match.
Solution: Make sure the dates in the worksheet are stored as dates, for example by writing date-type values directly when generating the data, instead of strings.
The formula conditional format references the wrong range
Cause: The relative references in the FirstFormula formula do not correspond to the cell range, so the judgment result does not match expectations.
Solution: Confirm that the row and column references in the formula are consistent with the selected range. For example, when applying =($A1<$B1) to the entire column A, the formula uses the first cell of the selected range as the reference starting point.
Get a Free License
If you want to remove the evaluation message from the result documents, or get rid of the function limitations, please contact sales to get a temporary license valid for 30 days.
Bidirectional PPT Aspect Ratio Conversion with Spire.Agent.Office
Before a presentation, the aspect ratio of a PPT often needs to be unified — some meeting screens are 4:3 standard while some projectors are 16:9 widescreen. This requires bidirectional layout conversion, and during the conversion the font sizes and image positions must be adjusted automatically so the content displays correctly with no text overflow or misplaced images. This article shows how to use the Spire.Agent.Office PowerPoint AI capability to batch-convert PowerPoint presentations between the 4:3 standard ratio and the 16:9 widescreen ratio.
Comparison with the Traditional SDK API
| Traditional Spire.Office for .NET API | Spire.Agent.Office Processing | |
|---|---|---|
| Driving approach | Hard-coded API calls | 1 natural-language instruction |
| Requirement changes | Requirement changes require modifying the code and redeploying | When requirements change, just modify the instruction text without recompiling the code |
For product installation and SpireToken configuration, please refer to Integrating Spire.Agent.Office in a .NET Project. The examples below assume Spire.Agent.Office is already installed and SpireToken is configured.
Convert 4:3 Standard to 16:9 Widescreen
The content structure, theme, and color scheme of every slide remain unchanged; font sizes and image positions are automatically adapted to the widescreen canvas, and multi-page PPTs are converted in one pass.
using Spire.Agent.Office.AI;
using Spire.Agent.Office.Extensions;
using Spire.Presentation;

// PowerPoint AI processing configuration
string inputPath = @"ratio_43.pptx";
string savePath = @"output.pptx";
// SpireToken Key
string key = "**************************";
string instruction = "Read the input PowerPoint presentation and batch-convert it from 4:3 standard aspect ratio to 16:9 widescreen";
AIResult result = ExecuteDemoPpt(instruction, inputPath, savePath, key);

// Execute PowerPoint document AI processing
static AIResult ExecuteDemoPpt(string instruction, string inputPath, string savePath, string key)
{
    // Create an AIOptions configuration object
    AIOptions options = new AIOptions();
    options.SpireToken = key;

    // Use the Presentation object to process the PowerPoint document
    using (Presentation ppt = new Presentation())
    {
        // Load the PPT from the file
        if (!string.IsNullOrEmpty(inputPath) && File.Exists(inputPath))
        {
            ppt.LoadFromFile(inputPath);
        }
        // Create an AI document processor
        AIDocumentProcessor processor = ppt.AI(options);

        // Execute the AI instruction
        return processor.ExecuteInstruction(ppt, instruction, savePath);
    }
}
Original 4:3 standard PPT 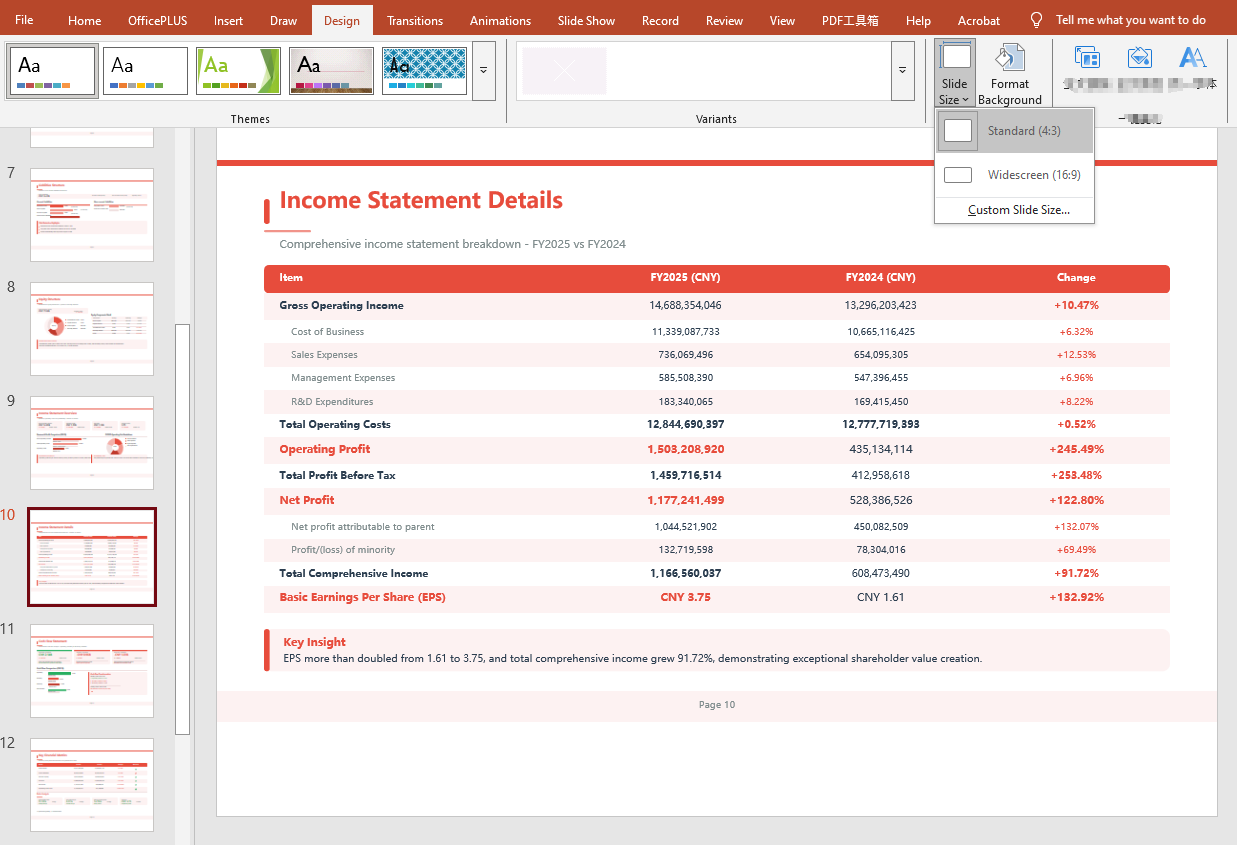 Converted 16:9 widescreen PPT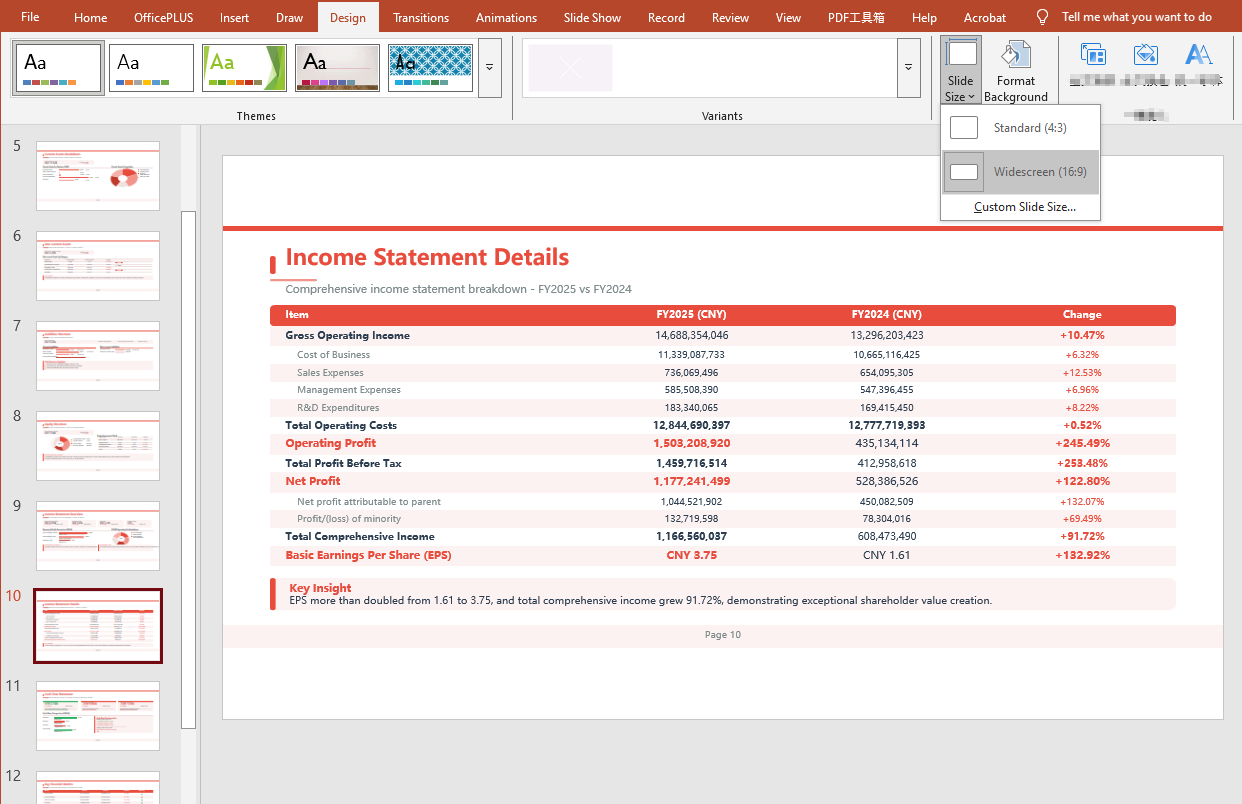
Convert 16:9 Widescreen to 4:3 Standard
using Spire.Agent.Office.AI;
using Spire.Agent.Office.Extensions;
using Spire.Presentation;

// PowerPoint AI processing configuration
string inputPath = @"ratio_169.pptx";
string savePath = @"output.pptx";
// SpireToken Key
string key = "**************************";
string instruction ="Read the input PowerPoint presentation and batch-convert it from 16:9 widescreen aspect ratio to 4:3 standard";

// Call the PowerPoint document processing function
AIResult result = ExecuteDemoPpt(instruction, inputPath, savePath, key);

// Execute PowerPoint document AI processing (the same helper function as above)
static AIResult ExecuteDemoPpt(string instruction, string inputPath, string savePath, string key)
{
    AIOptions options = new AIOptions();
    options.SpireToken = key;

    using (Presentation ppt = new Presentation())
    {
        if (!string.IsNullOrEmpty(inputPath) && File.Exists(inputPath))
        {
            ppt.LoadFromFile(inputPath);
        }
        AIDocumentProcessor processor = ppt.AI(options);
        return processor.ExecuteInstruction(ppt, instruction, savePath);
    }
}
Original 16:9 widescreen PPT 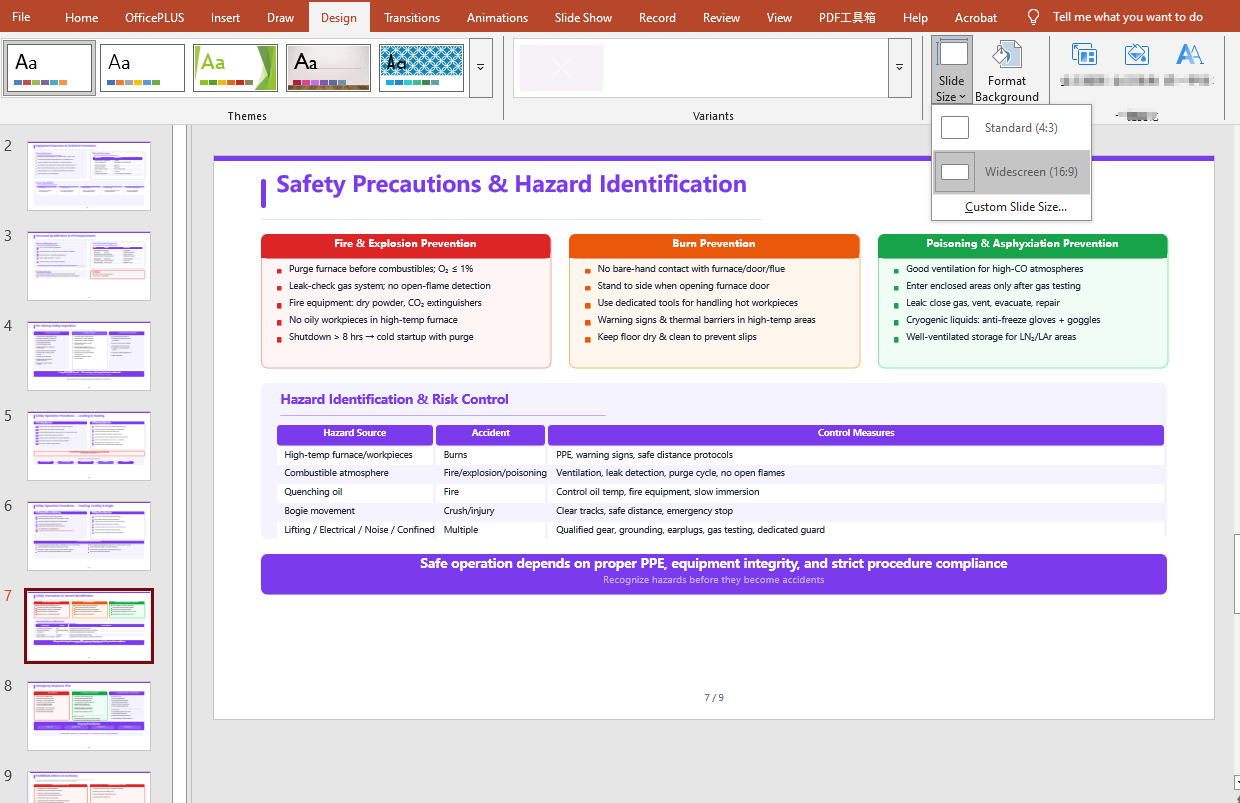 Converted 4:3 standard PPT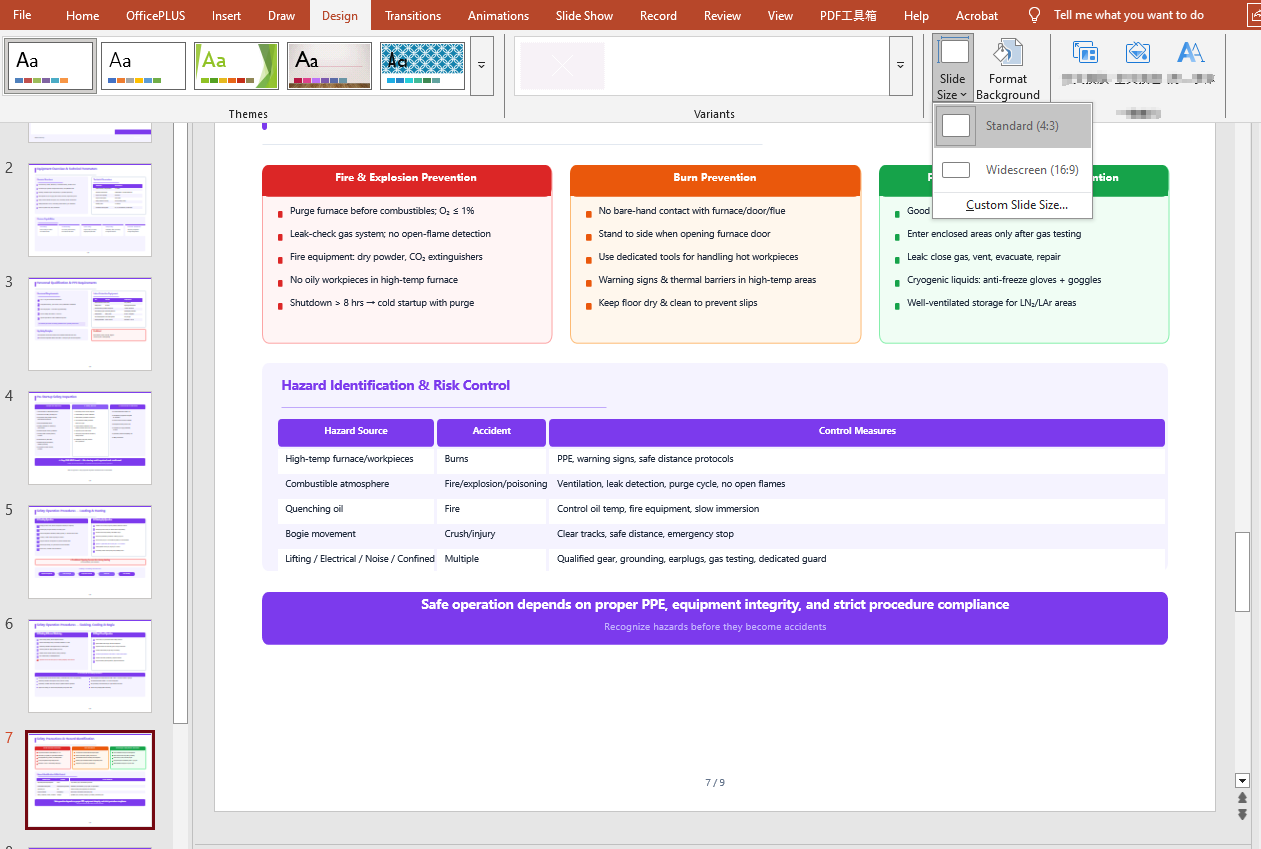
FAQ
Result document pages are missing
Cause: If the original document has many pages, the AI analysis can take a relatively long time. The default timeout setting of AIOptions.TimeoutMs is 5 minutes; if it is exceeded, the AI analysis is interrupted.
Solution: Set a sufficiently large AIOptions.TimeoutMs, for example:
 AIOptions options = new AIOptions();
    options.TimeoutMs = 1000000;
Get a SpireToken Key
- Contact sales@e-iceblue.com or visit https://www.e-iceblue.com/TemLicense.html to get a trial/commercial API key
Configure it in code:
AIOptions options = new AIOptions();
options.SpireToken = key;
Hide, Unhide, and Control the Conversion of Excel Worksheets with JavaScript in React
In daily work, we often need to hide some worksheets to simplify the interface display or protect sensitive data, and we can unhide them when necessary. In addition, when converting a workbook to HTML, you may also need to control whether hidden worksheets appear in the conversion result. Spire.XLS for JavaScript performs these operations directly in the browser based on WebAssembly, managing input and output files through the virtual file system (VFS), without any backend service support.
This article covers three core feature points:
- Hide a Worksheet
- Show a Hidden Worksheet
- Control Whether to Include Hidden Worksheets When Converting to HTML
For installation and project configuration, please refer to How to Integrate Spire.XLS for JavaScript in a React Project. The following examples assume that Spire.XLS is installed and the WebAssembly module has been initialized.
Hide a Worksheet
Hiding a worksheet is often used to simplify the display of a workbook or protect internal data. With Spire.XLS for JavaScript, you can hide a specified worksheet by setting the Visibility property of the worksheet object to WorksheetVisibility.Hidden.
function App() {
  const hideSheet = async () => {
    // Get the Spire.XLS WASM module
    const xlsModule = window.wasmModule?.spirexls;

    // Check if the module is ready
    if (!xlsModule) {
      alert('Spire.Xls is not ready yet');
      return;
    }

    // Load the font and Excel file into VFS
    await window.spire.FetchFileToVFS('ARIAL.TTF', '/Library/Fonts/', `${process.env.PUBLIC_URL}/font/`);
    const inputFileName = 'HideOrShowWorksheet.xlsx';
    await window.spire.FetchFileToVFS(inputFileName, '', `${process.env.PUBLIC_URL}data/`);

    // Load the workbook
    const workbook = new xlsModule.Workbook();
    workbook.LoadFromFile({ fileName: inputFileName });

    // Get the worksheet named "Sheet1" and hide it
    let sheet1 = workbook.Worksheets.get("Sheet1");
    sheet1.Visibility = xlsModule.WorksheetVisibility.Hidden;

    // Save the workbook
    const outputFileName = "HideWorksheet_output.xlsx";
    workbook.SaveToFile({ fileName: outputFileName });

    // Dispose of the workbook object to release resources
    workbook.Dispose();

    // Read the converted file from VFS and trigger the download
    const fileArray = window.dotnetRuntime.Module.FS.readFile(outputFileName);
    const blob = new Blob([fileArray], { type: "application/vnd.openxmlformats-officedocument.spreadsheetml.sheet" });
    const url = URL.createObjectURL(blob);
    const a = document.createElement('a');
    a.href = url;
    a.download = outputFileName;
    a.click();
    URL.revokeObjectURL(url);
  };

  return (
    <div style={{ textAlign: 'center', height: '300px' }}>
      <h1>Hide Worksheet</h1>
      <button onClick={hideSheet}>
        Start
      </button>
    </div>
  );
}

export default App;
Original document (Sheet2 is already hidden) 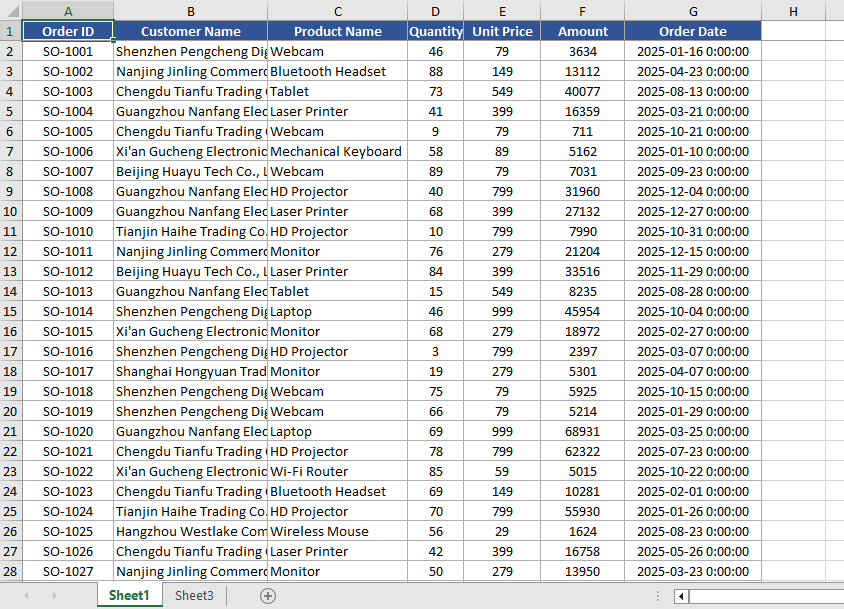 Hide Sheet1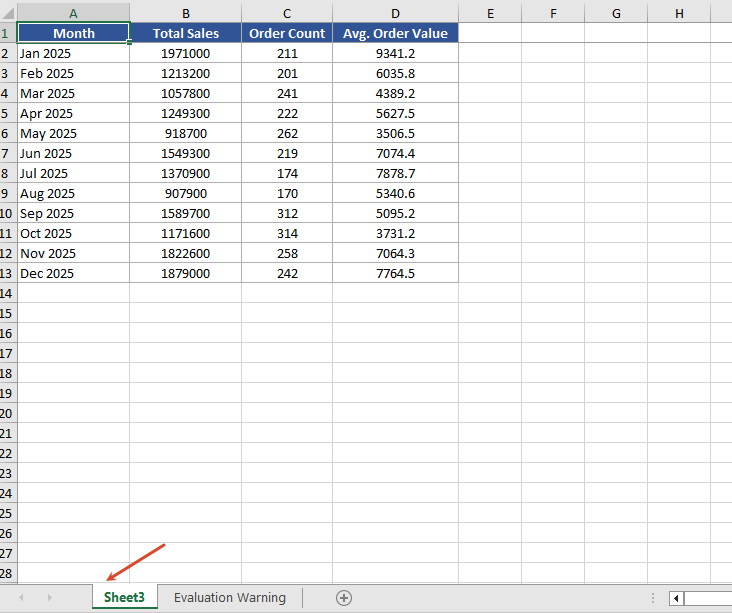
Show a Hidden Worksheet
When you need to view or edit a hidden worksheet again, you can show it again by setting the Visibility property to WorksheetVisibility.Visible.
function App() {
  const showSheet = async () => {
    // Get the Spire.XLS WASM module
    const xlsModule = window.wasmModule?.spirexls;

    // Check if the module is ready
    if (!xlsModule) {
      alert('Spire.Xls is not ready yet');
      return;
    }

    // Load the font and Excel file into VFS
    await window.spire.FetchFileToVFS('ARIAL.TTF', '/Library/Fonts/', `${process.env.PUBLIC_URL}/font/`);
    const inputFileName = 'HideOrShowWorksheet.xlsx';
    await window.spire.FetchFileToVFS(inputFileName, '', `${process.env.PUBLIC_URL}data/`);

    // Load the workbook
    const workbook = new xlsModule.Workbook();
    workbook.LoadFromFile({ fileName: inputFileName });

    // Get the second worksheet and set it as visible
    let sheet2 = workbook.Worksheets.get(1);
    sheet2.Visibility = xlsModule.WorksheetVisibility.Visible;

    // Save the workbook
    const outputFileName = "ShowWorksheet_output.xlsx";
    workbook.SaveToFile({ fileName: outputFileName });

    // Dispose of the workbook object to release resources
    workbook.Dispose();

    // Read the converted file from VFS and trigger the download
    const fileArray = window.dotnetRuntime.Module.FS.readFile(outputFileName);
    const blob = new Blob([fileArray], { type: "application/vnd.openxmlformats-officedocument.spreadsheetml.sheet" });
    const url = URL.createObjectURL(blob);
    const a = document.createElement('a');
    a.href = url;
    a.download = outputFileName;
    a.click();
    URL.revokeObjectURL(url);
  };

  return (
    <div style={{ textAlign: 'center', height: '300px' }}>
      <h1>Show Worksheet</h1>
      <button onClick={showSheet}>
        Start
      </button>
    </div>
  );
}

export default App;
Unhide Sheet2 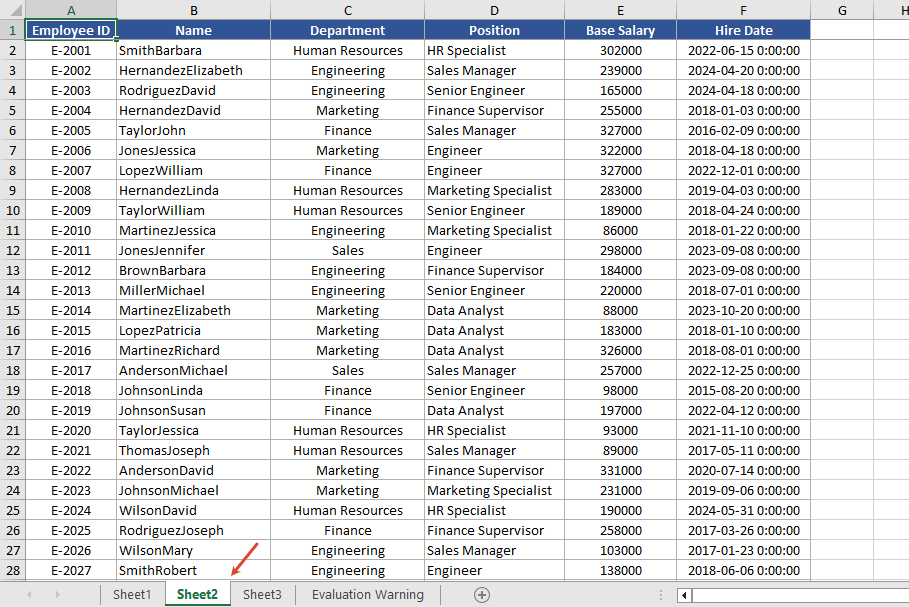
Control Whether to Include Hidden Worksheets When Converting to HTML
When converting to HTML, you can use the skipHideSheet parameter of the SaveToHtml method to control whether hidden worksheets are included in the conversion result. When set to false, the generated HTML includes hidden worksheets; when set to true, hidden worksheets are skipped and only visible worksheets remain in the HTML.
function App() {
  const saveToHtml = async () => {
    // Get the Spire.XLS WASM module
    const xlsModule = window.wasmModule?.spirexls;

    // Check if the module is ready
    if (!xlsModule) {
      alert('Spire.Xls is not ready yet');
      return;
    }

    // Load the font and Excel file into VFS
    await window.spire.FetchFileToVFS('ARIAL.TTF', '/Library/Fonts/', `${process.env.PUBLIC_URL}/font/`);
    const inputFileName = 'HideOrShowWorksheet.xlsx';
    await window.spire.FetchFileToVFS(inputFileName, '', `${process.env.PUBLIC_URL}data/`);

    // Load the workbook
    const workbook = new xlsModule.Workbook();
    workbook.LoadFromFile({ fileName: inputFileName });

    // Hide the worksheet named "Sheet1"
    let sheet1 = workbook.Worksheets.get("Sheet1");
    sheet1.Visibility = xlsModule.WorksheetVisibility.Hidden;

    // Set the output HTML file name
    const result = "result.html";

    // false --- Save HTML with hidden worksheets
    // true --- Save HTML without hidden worksheets
    workbook.SaveToHtml({
      fileName: result,
      skipHideSheet: false
    });

    // Dispose of the workbook object to release resources
    workbook.Dispose();

    // Read the converted file from VFS and trigger the download
    const fileArray = window.dotnetRuntime.Module.FS.readFile(result);
    const blob = new Blob([fileArray], { type: 'text/html' });
    const url = URL.createObjectURL(blob);
    const a = document.createElement('a');
    a.href = url;
    a.download = result;
    a.click();
    URL.revokeObjectURL(url);
  };

  return (
    <div style={{ textAlign: 'center', height: '300px' }}>
      <h1>Convert Workbook to HTML</h1>
      <button onClick={saveToHtml}>
        Start
      </button>
    </div>
  );
}

export default App;
After conversion 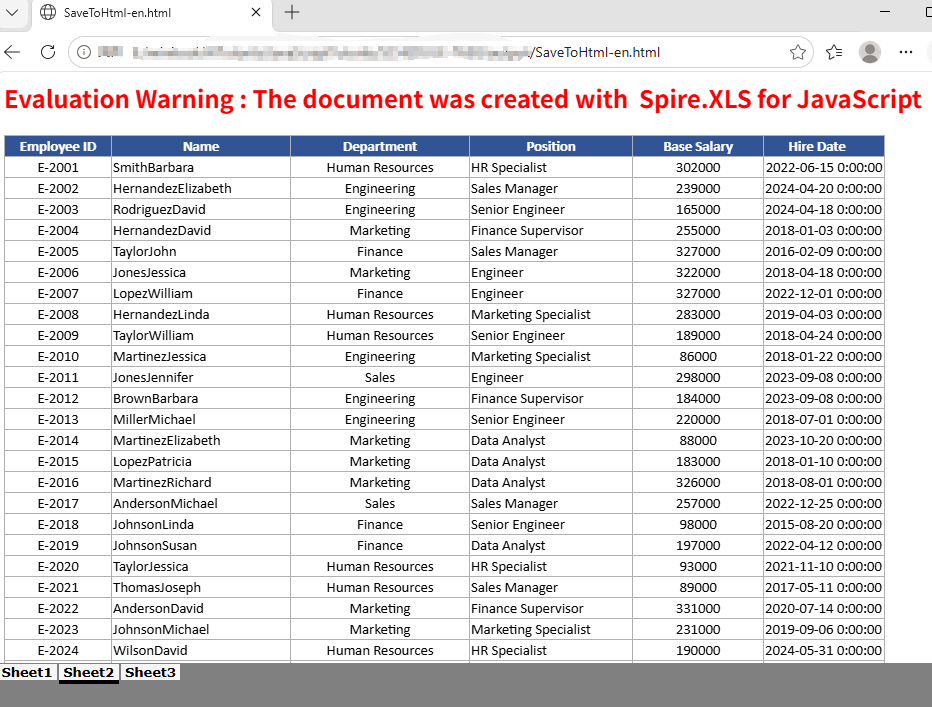
FAQ
The HTML conversion result contains extra worksheets
Cause: The original Excel document has multiple hidden worksheets. When the skipHideSheet parameter of SaveToHtml is set to false, all hidden worksheets appear in the conversion result.
Solution: You can use the following code to iterate through and check the hidden state of all sheets in the Excel file.
    const sheetCount = workbook.Worksheets.Count;
    for (let i = 0; i < sheetCount; i++) {
        let sheet = workbook.Worksheets.get(i);
        const visibility = sheet.Visibility;
    }
Get a Free License
If you want to remove the evaluation message in the generated documents or get rid of functional limitations, please contact us to get a temporary license valid for 30 days.
Spire.Agent.Office Smart Reconciliation Analysis
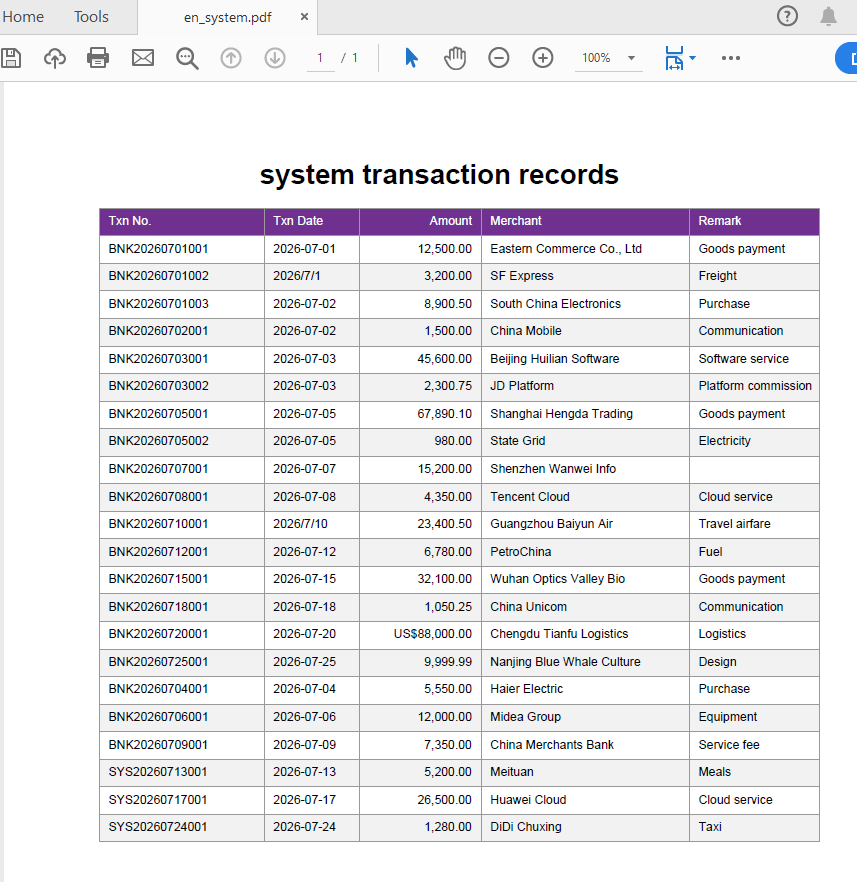
Reconciliation is one of the most frequent and tedious tasks in corporate finance, and the source data often comes in different forms: bank statements are CSV files exported from online banking, while system transaction records may be PDF detail reports. The two tables have different column names, inconsistent date and amount formats, and even stray spaces and missing values. This article shows how to use Spire.Agent.Office Excel AI capabilities to automatically read CSV and PDF data sources, identify and map column names, clean the data, and finally generate an Excel reconciliation detail report.
For product installation and SpireToken configuration, please refer to Integrate Spire.Agent.Office in a .NET Project. The following examples assume Spire.Agent.Office is installed and SpireToken is configured.
Reconcile by Statement Number
Reconcile and analyze the CSV-format bank statement with the PDF-format system transaction records by statement number.
using Spire.Agent.Office.AI;
using Spire.Agent.Office.Extensions;
using Spire.Xls;

// Data source files: bank statement (CSV) and system transaction records (PDF)
string[] attachmentPaths = new string[]
{
    @"bank-statement.csv",
    @"system-records.pdf"
};

// Excel processing configuration
string inputPath = "";
string savePath = "out.xlsx";
// SpireToken Key
string key = "**************************";
string instruction =
    "Reconcile the bank statement (CSV) with the system transaction records (PDF) in the attachments: " +
    "1. Establish the column mapping of the two tables by semantics: transaction date, amount, counterparty account, description, statement number; " +
    "2. Cleaning: strip leading/trailing and internal extra spaces from text; write dates as yyyy-MM-dd text; convert amounts to numbers by removing currency symbols and thousands separators; mark empty description or empty counterparty as 'Unknown', mark empty amount as 'Amount missing'; " +
    "3. Match row by row using the statement number as the unique key, and mark the status: 'Matched'/'Amount mismatch'/'Bank only'/'System only'; " +
    "4. Generate a 'Reconciliation Detail' worksheet: each record with bank amount, system amount, difference, status and remark; " +
    "5. Highlight difference rows: yellow for amount mismatch, orange for bank only, blue for system only; " +
    "Finally save the output as an Excel file";

// Call the Excel document processing function
AIResult result = ExecuteDemoExcel(instruction, inputPath, savePath, key,  attachmentPaths);


// Execute Excel document AI processing
static AIResult ExecuteDemoExcel(string instruction, string inputPath, string savePath, string key, string[] attachmentPaths)
{
    // Create an AIOptions configuration object
    AIOptions options = new AIOptions();
    options.SpireToken = key;

    // Use the Workbook object to process the Excel document
    using (Workbook workbook = new Workbook())
    {
        // Load the Excel template from a file
        if (!string.IsNullOrEmpty(inputPath) && File.Exists(inputPath))
        {
            workbook.LoadFromFile(inputPath);
        }
        // Create the AI document processor
        AIWorkbookProcessor processor = workbook.AI(options);

        // Execute the AI instruction
        return processor.ExecuteInstruction(workbook, instruction, savePath, attachmentPaths);
    }
}
Original bank statement CSV 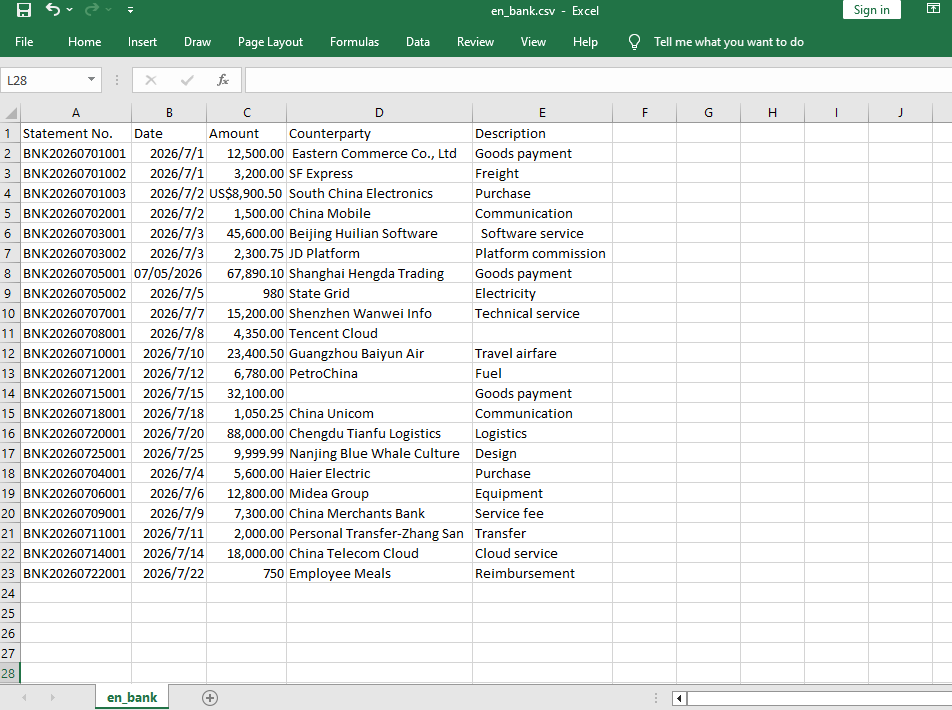 Original system transaction PDF
  Reconciliation detail after Excel AI reconciliation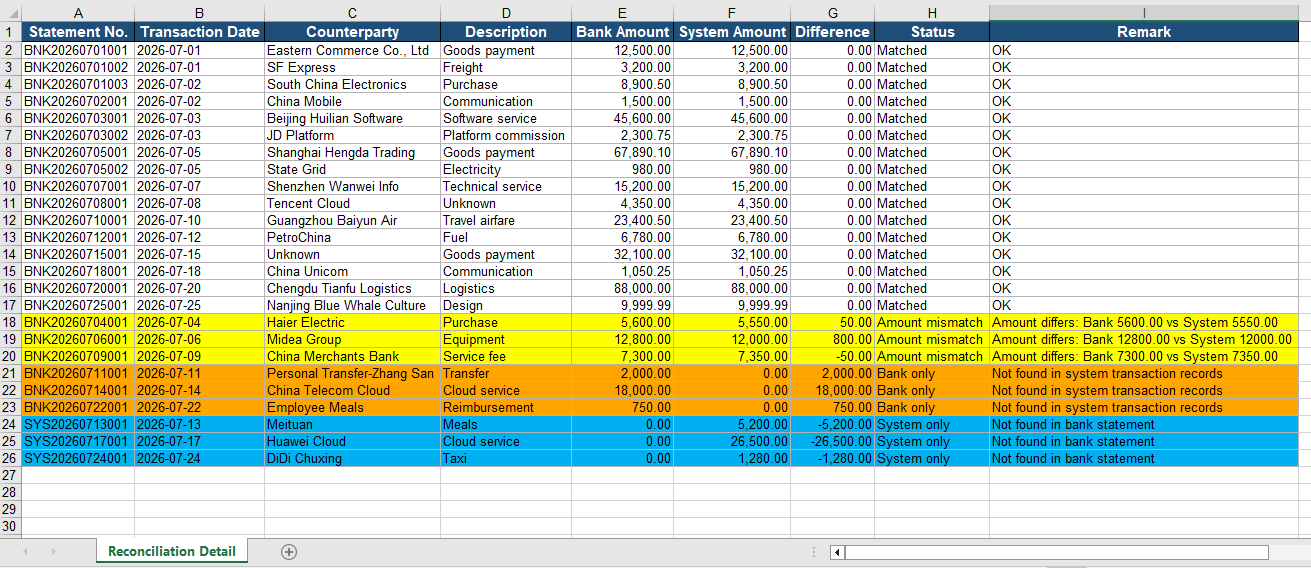
Reconcile by Date and Amount Combination
When the data source does not contain a unique statement number, you can use the "transaction date + amount" combination as the matching key for reconciliation: first group by date, then pair the records by amount within the same date.
using Spire.Agent.Office.AI;
using Spire.Agent.Office.Extensions;
using Spire.Xls;

// Data source files without statement numbers: bank statement (CSV) and system transaction records (PDF)
string[] attachmentPaths = new string[]
{
    @"bank-statement-noId.csv",
    @"system-records-noId.pdf"
};

// Excel processing configuration
string inputPath = "";
string savePath = "out.xlsx";
// SpireToken Key
string key = "**************************";
string instruction =
    "Reconcile the bank statement (CSV) with the system transaction records (PDF) in the attachments: " +
    "1. Establish the column mapping of the two tables by semantics: transaction date, amount, counterparty account, description; " +
    "2. Cleaning: strip extra spaces from text; write dates as yyyy-MM-dd text; convert amounts to numbers; mark missing values as 'Unknown' or 'Amount missing'; " +
    "3. Use the 'transaction date + amount' combination as the matching key: first group by date, then pair the records by amount within the same date, and mark the status: 'Matched'/'Amount mismatch'/'Bank only'/'System only'; " +
    "4. Generate a 'Reconciliation Detail' worksheet (bank amount, system amount, difference, status); " +
    "5. Highlight difference rows: yellow for amount mismatch, orange for bank only, blue for system only; " +
    "Finally save the output as an Excel file";

// Call the Excel document processing function
AIResult result = ExecuteDemoExcel(instruction, inputPath, savePath, key,  attachmentPaths);


// Execute Excel document AI processing
static AIResult ExecuteDemoExcel(string instruction, string inputPath, string savePath, string key, string[] attachmentPaths)
{
    // Create an AIOptions configuration object
    AIOptions options = new AIOptions();
    options.SpireToken = key;

    // Use the Workbook object to process the Excel document
    using (Workbook workbook = new Workbook())
    {
        // Load the Excel template from a file
        if (!string.IsNullOrEmpty(inputPath) && File.Exists(inputPath))
        {
            workbook.LoadFromFile(inputPath);
        }
        // Create the AI document processor
        AIWorkbookProcessor processor = workbook.AI(options);

        // Execute the AI instruction
        return processor.ExecuteInstruction(workbook, instruction, savePath, attachmentPaths);
    }
}
Original bank statement CSV 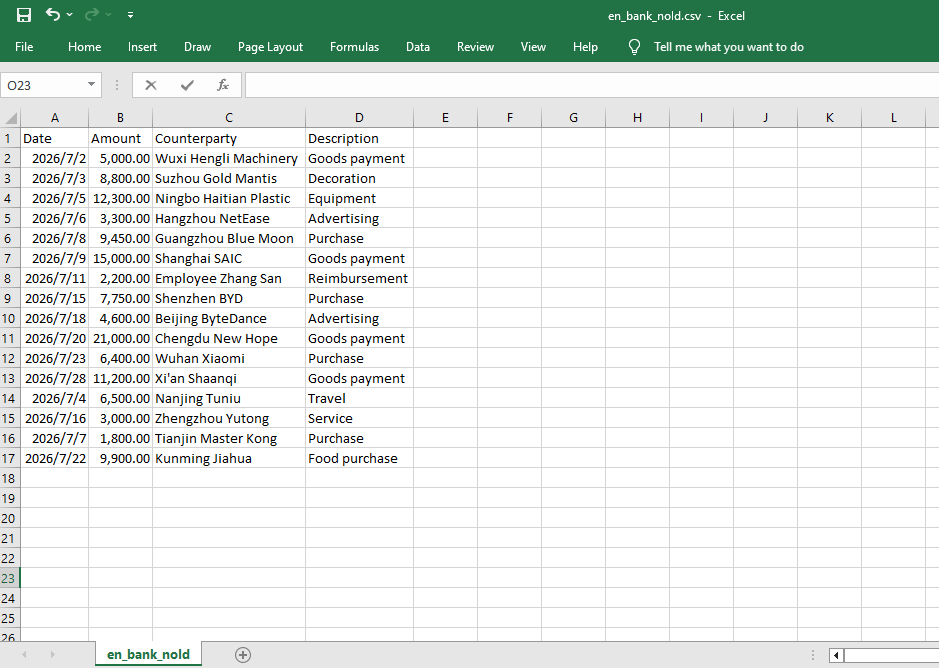 Original system transaction PDF
 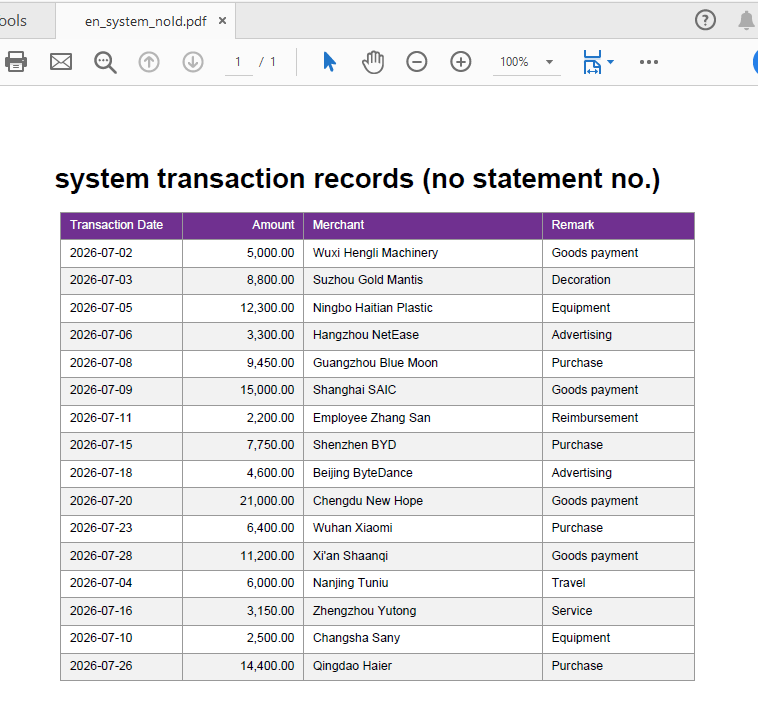 Reconciliation detail after Excel AI reconciliation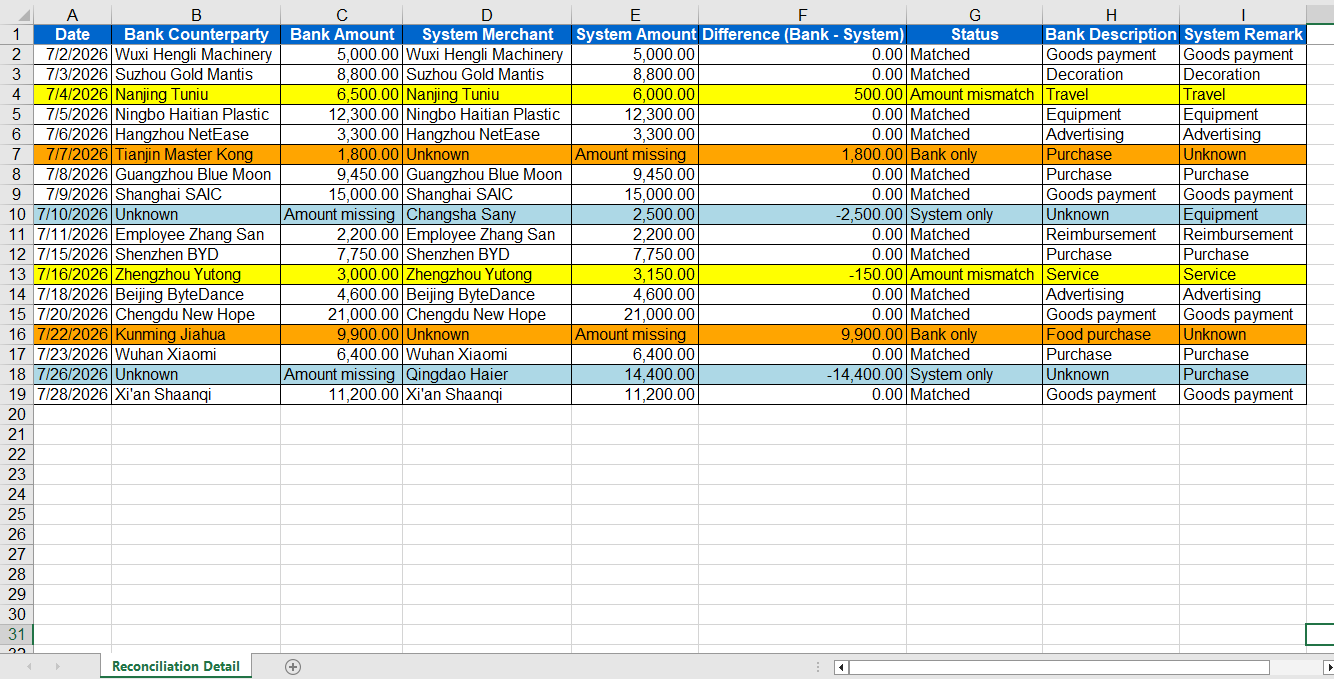
Comparison with Traditional SDK API Processing
| Traditional Spire.Office for .NET API | Spire.Agent.Office Processing | |
|---|---|---|
| Driving approach | Requires writing large amounts of code for CSV/PDF parsing, column mapping, data cleaning, matching and exception logic | Describe reconciliation rules in natural language, and AI understands and orchestrates the execution automatically |
| Data format | CSV and PDF must be parsed with different components, each with its own format | Directly attach CSV and PDF, and AI understands the content automatically |
| Field mapping | Hard-coded column name mappings; changing column names or formats requires code changes | AI maps columns automatically based on column names and content semantics |
| Exception handling | Need to hand-write difference judgment, alert text and style logic | AI automatically identifies differences and provides handling suggestions |
Frequently Asked Questions
Inconsistent date and amount formats in the bank statement CSV
Cause: In the CSV exported from online banking, dates may be written as 2026-07-01, 2026/7/1, etc., and amounts may carry ¥, thousands separators, or leading/trailing spaces, leading to misjudgment during matching.
Solution: Explicitly require in the instruction "unify dates as yyyy-MM-dd and amounts as numeric formats and remove spaces", and AI will complete the standardization automatically before reconciliation.
The system transaction PDF table spans pages or has headers/footers
Cause: PDF detail reports may have pagination, repeated headers, or footer annotations, which affect AI's reading of the table data.
Solution: Add "ignore headers/footers and repeated header rows, only read the table data rows" to the instruction.
The same amount appears multiple times on the same day, causing mismatches
Cause: When reconciling by the "date + amount" combination, there may be multiple transactions with the same amount on the same day, making the exact correspondence impossible to determine.
Solution: Prefer precise reconciliation by statement number; if there is really no statement number, you can require in the instruction to "mark records that cannot be matched one-to-one on the same day as 'Amount mismatch'".
Get a SpireToken Key
- Contact sales@e-iceblue.com or visit https://www.e-iceblue.com/TemLicense.html to obtain a trial/commercial API key
Configure it in code:
AIOptions options = new AIOptions();
options.SpireToken = key;
Freeze, Query, and Unfreeze Excel Worksheet Panes with JavaScript in React
When browsing an Excel worksheet that contains a large amount of data, pinning the header or key columns can significantly improve the efficiency of data viewing. The freeze panes feature keeps the specified rows or columns visible while scrolling. Querying the frozen pane range confirms which areas of the current worksheet are frozen. Unfreezing panes restores the normal browsing mode when the fixed display is no longer needed. Spire.XLS for JavaScript completes these operations directly in the browser based on WebAssembly, and manages input and output files through the virtual file system (VFS), without requiring backend service support.
This article introduces three core feature points:
For installation and project configuration, refer to Integrate Spire.XLS for JavaScript in a React Project. The following examples assume that Spire.XLS is installed and the WebAssembly module has been initialized.
Freeze Panes
When a worksheet contains a large amount of data, freezing panes can pin the header or a specific area so that you can always see the key rows or columns while scrolling through the data. Spire.XLS for JavaScript freezes the panes above and to the left of the specified position through the FreezePanes method. For example, FreezePanes(2, 1) freezes the first row, keeping it visible when scrolling vertically.
function App() {
  const sheetToSVG = async () => {
    // Get the Spire.XLS WASM module
    const xlsModule = window.wasmModule?.spirexls;

    // Check whether the module is ready
    if (!xlsModule) {
      alert('Spire.Xls is not ready yet');
      return;
    }

    // Load the font and the Excel file into the VFS
    await window.spire.FetchFileToVFS('ARIAL.TTF', '/Library/Fonts/', `${process.env.PUBLIC_URL}/font/`);
    const inputFileName = 'FreezePanes.xlsx';
    await window.spire.FetchFileToVFS(inputFileName, '', `${process.env.PUBLIC_URL}/static/data/`);

    // Load the workbook
    const workbook = new xlsModule.Workbook();
    workbook.LoadFromFile({ fileName: inputFileName });

    // Get the first worksheet
    const sheet = workbook.Worksheets.get(0);

    // Freeze the first row
    sheet.FreezePanes(2, 1);

    // Set the width of the second column
    sheet.SetColumnWidth(2, 10);

    const outputFileName = "FreezePanes_output.xlsx";
    workbook.SaveToFile({ fileName: outputFileName });

    // Dispose of the workbook object to release resources
    workbook.Dispose();

    // Read the converted file from the VFS and trigger the download
    const fileArray = window.dotnetRuntime.Module.FS.readFile(outputFileName);
    const blob = new Blob([fileArray], { type: "application/vnd.openxmlformats-officedocument.spreadsheetml.sheet" });
    const url = URL.createObjectURL(blob);
    const a = document.createElement('a');
    a.href = url;
    a.download = outputFileName;
    a.click();
    URL.revokeObjectURL(url);
  };

  return (
    <div style={{ textAlign: 'center', height: '300px' }}>
      <h1>Freeze Panes</h1>
      <button onClick={sheetToSVG}>
        Start
      </button>
    </div>
  );
}

export default App;
Original document 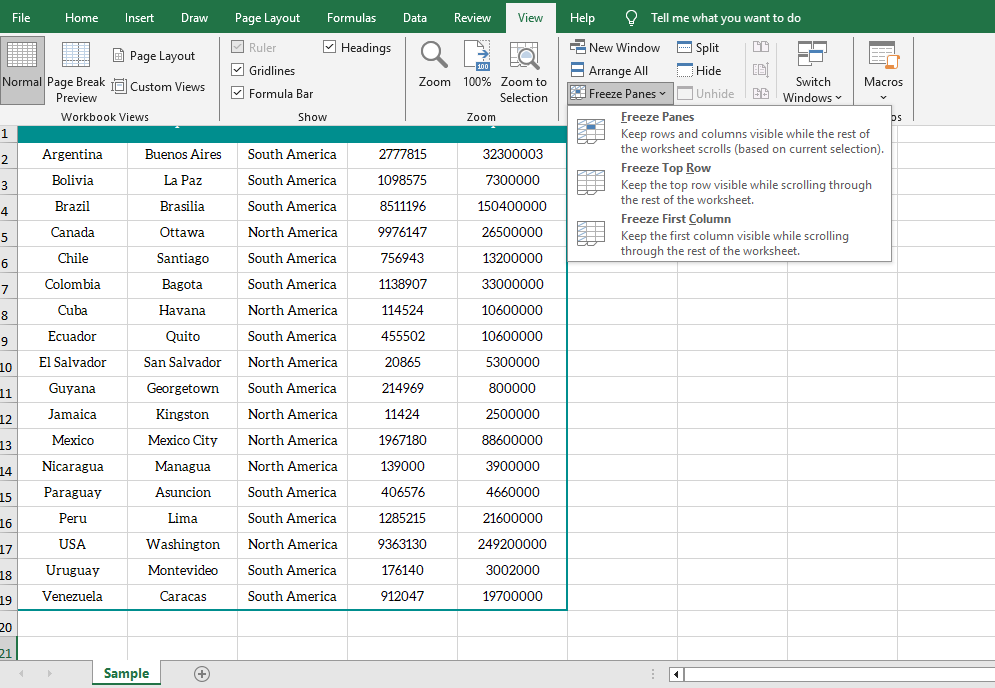 After freezing the first row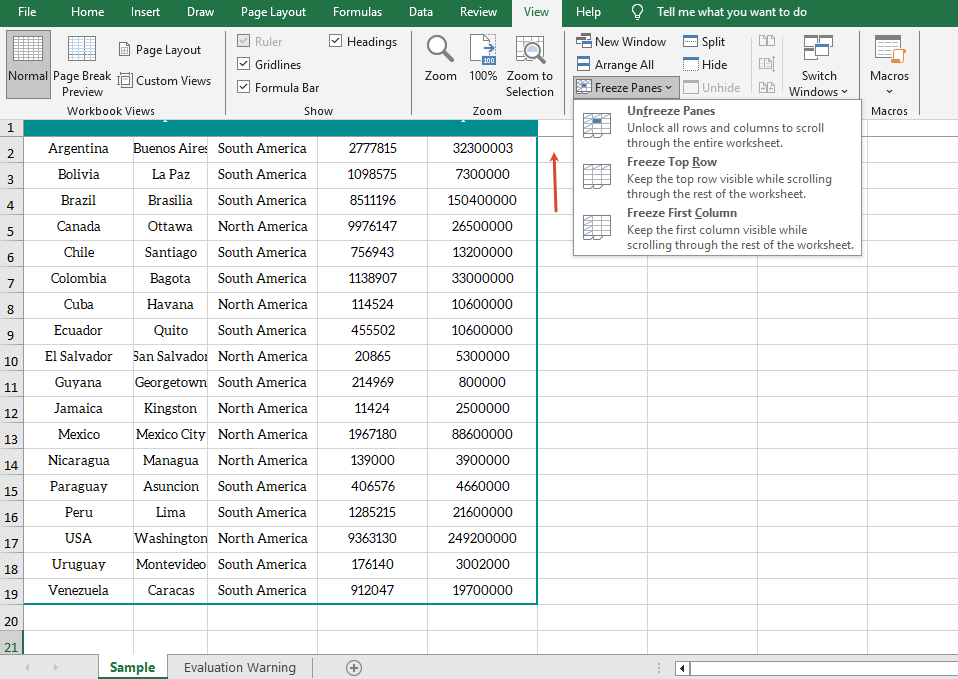
Get the Freeze Pane Range
When working with frozen panes, sometimes you need to confirm the position of the frozen panes in the current worksheet. Spire.XLS for JavaScript obtains the row index and column index of the frozen panes through the GetFreezePanes method, and a return value of 0 indicates that the corresponding direction is not frozen.
function App() {
  const sheetToSVG = async () => {
    // Get the Spire.XLS WASM module
    const xlsModule = window.wasmModule?.spirexls;

    // Check whether the module is ready
    if (!xlsModule) {
      alert('Spire.Xls is not ready yet');
      return;
    }

    // Load the font and the Excel file into the VFS
    await window.spire.FetchFileToVFS('ARIAL.TTF', '/Library/Fonts/', `${process.env.PUBLIC_URL}/font/`);
    const inputFileName = 'GetFreezePaneRange.xlsx';
    await window.spire.FetchFileToVFS(inputFileName, '', `${process.env.PUBLIC_URL}/static/data/`);

    // Load the workbook
    const workbook = new xlsModule.Workbook();
    workbook.LoadFromFile({ fileName: inputFileName });

    // Get the first worksheet
    const sheet = workbook.Worksheets.get(0);

    // Get the row index and column index of the frozen panes
    const indexs = sheet.GetFreezePanes();
    const rowIndex = indexs[0];
    const colIndex = indexs[1];

    // Write the query result to a text file
    const outputFileName = "GetFreezePaneRange_output.txt";
    window.dotnetRuntime.Module.FS.writeFile(outputFileName, `Row index: ${rowIndex}, column index: ${colIndex}`);

    // Dispose of the workbook object to release resources
    workbook.Dispose();

    // Read the converted file from the VFS and trigger the download
    const fileArray = window.dotnetRuntime.Module.FS.readFile(outputFileName);
    const blob = new Blob([fileArray], { type: "text/plain" });
    const url = URL.createObjectURL(blob);
    const a = document.createElement('a');
    a.href = url;
    a.download = outputFileName;
    a.click();
    URL.revokeObjectURL(url);
  };

  return (
    <div style={{ textAlign: 'center', height: '300px' }}>
      <h1>Get Freeze Pane Range</h1>
      <button onClick={sheetToSVG}>
        Start
      </button>
    </div>
  );
}

export default App;
Original document with frozen panes 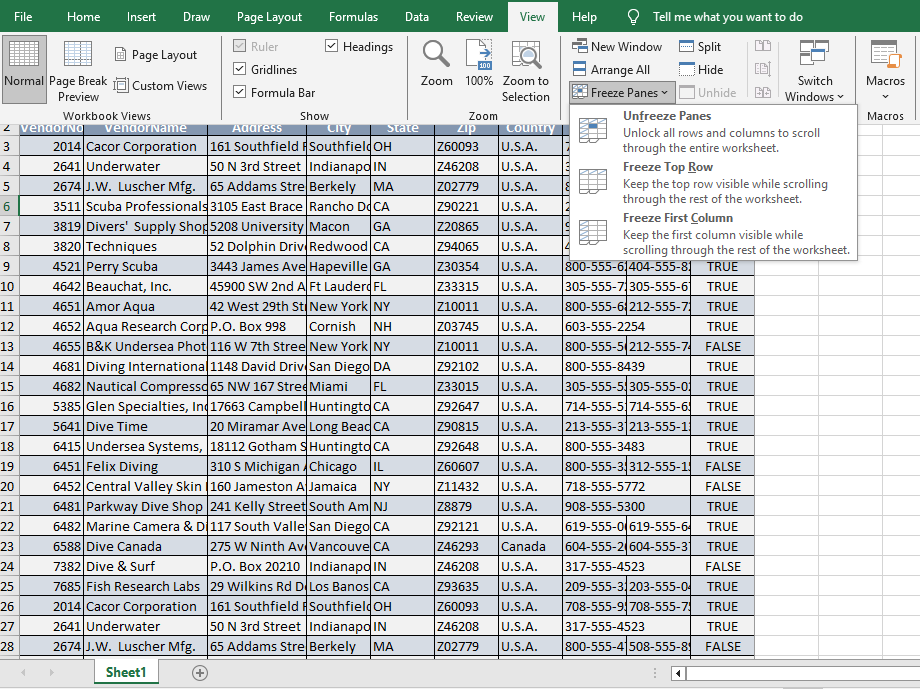 Query result
Unfreeze Panes
When the fixed display is no longer needed, you can cancel the frozen panes that have been set in the worksheet through the RemovePanes method and restore normal scrolling.
function App() {
  const sheetToSVG = async () => {
    // Get the Spire.XLS WASM module
    const xlsModule = window.wasmModule?.spirexls;

    // Check whether the module is ready
    if (!xlsModule) {
      alert('Spire.Xls is not ready yet');
      return;
    }

    // Load the font and the Excel file into the VFS
    await window.spire.FetchFileToVFS('ARIAL.TTF', '/Library/Fonts/', `${process.env.PUBLIC_URL}/font/`);
    const inputFileName = 'Template_Xls_2.xlsx';
    await window.spire.FetchFileToVFS(inputFileName, '', `${process.env.PUBLIC_URL}/static/data/`);

    // Load the workbook
    const workbook = new xlsModule.Workbook();
    workbook.LoadFromFile({ fileName: inputFileName });

    // Get the first worksheet
    const sheet = workbook.Worksheets.get(0);

    // Unfreeze the panes
    sheet.RemovePanes();

    const outputFileName = "UnfreezeExcelPanes_output.xlsx";
    workbook.SaveToFile({ fileName: outputFileName });

    // Dispose of the workbook object to release resources
    workbook.Dispose();

    // Read the converted file from the VFS and trigger the download
    const fileArray = window.dotnetRuntime.Module.FS.readFile(outputFileName);
    const blob = new Blob([fileArray], { type: "application/vnd.openxmlformats-officedocument.spreadsheetml.sheet" });
    const url = URL.createObjectURL(blob);
    const a = document.createElement('a');
    a.href = url;
    a.download = outputFileName;
    a.click();
    URL.revokeObjectURL(url);
  };

  return (
    <div style={{ textAlign: 'center', height: '300px' }}>
      <h1>Unfreeze Panes</h1>
      <button onClick={sheetToSVG}>
        Start
      </button>
    </div>
  );
}

export default App;
Before unfreezing 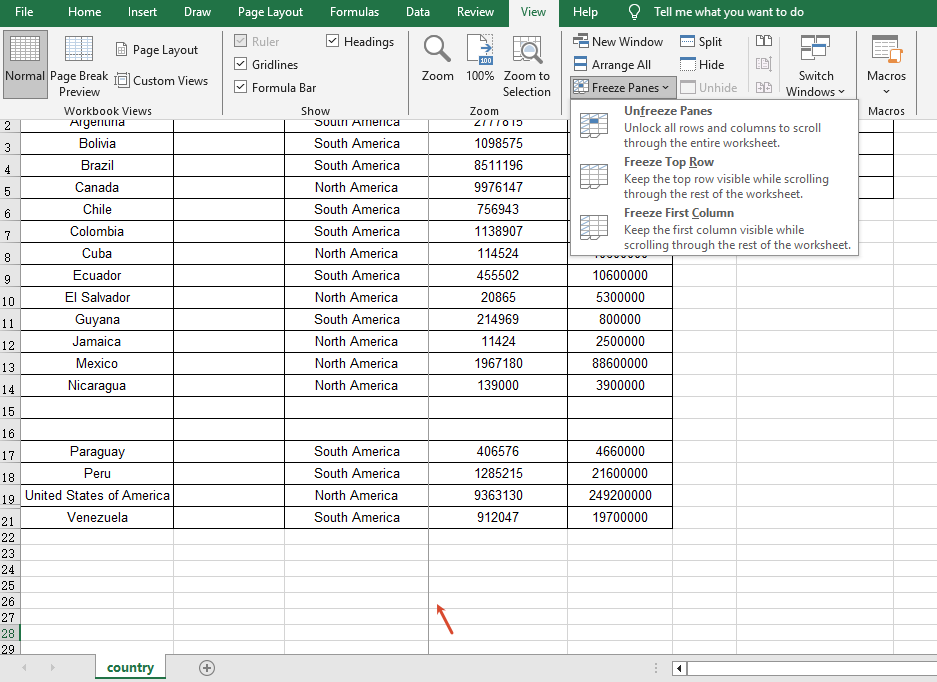 After unfreezing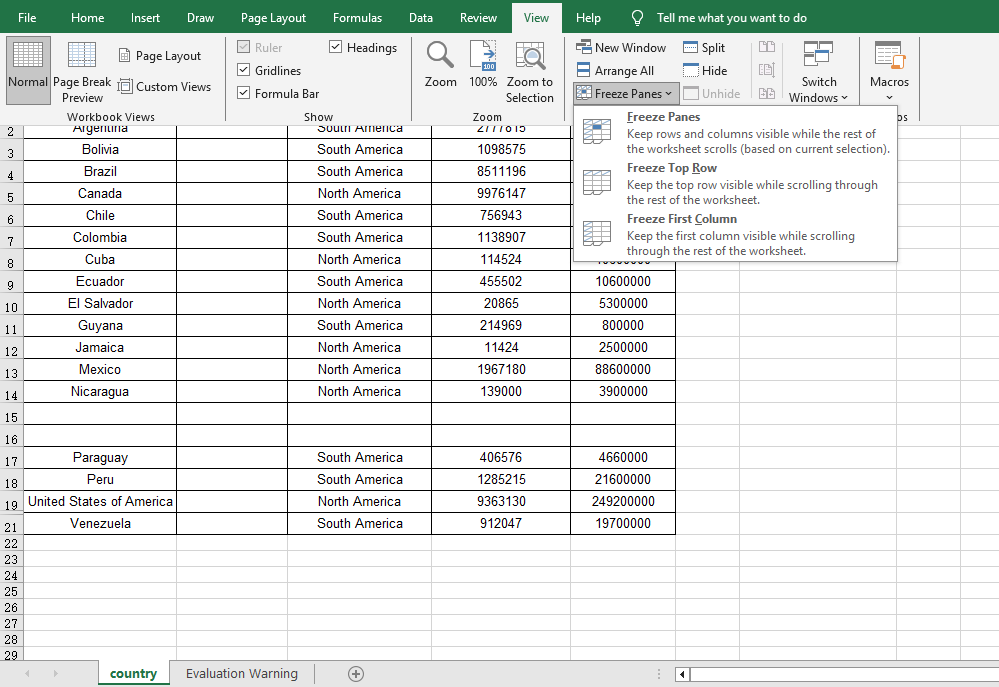
FAQ
The first row still scrolls after freezing panes
Reason: The parameters of the FreezePanes method are set incorrectly, so the frozen area is not the expected row or column.
Solution: The FreezePanes method uses the specified position as the boundary and freezes the panes above and to the left of that position. For example, use FreezePanes(2, 1) to freeze the first row, FreezePanes(3, 1) to freeze the first two rows, and FreezePanes(2, 2) to freeze both the first row and the first column.
Querying the freeze pane range returns 0
Reason: The worksheet has not set any frozen panes, so the queried row and column indexes are 0.
Solution: Call the FreezePanes method to set frozen panes first, and then call GetFreezePanes to query the frozen range.
The freeze effect still shows after unfreezing panes
Reason: The workbook was not saved correctly after unfreezing, or the file opened is the one before the modification.
Solution: After calling the RemovePanes method, be sure to save the workbook with SaveToFile and open the output file to confirm the unfreeze effect.
Get a Free License
If you want to remove the evaluation message in the result documents or get rid of the feature limitations, please contact sales to obtain a 30-day temporary license.
Automatically Comparing Multi-format Quotation Sheets with Spire.Agent.Office
In procurement and sales scenarios, price comparison is one of the most critical and time-consuming steps. Procurement teams receive quotation sheets from various vendors — some organized by rows, some by columns, some containing multiple hidden costs, and some with inconsistent units. The Spire.Agent.Office Excel AI agent can understand quotation sheets in different formats, automatically align each vendor's quotations to a unified template, calculate line-item totals and grand totals, and mark the lowest prices.
This article explains how to use the Spire.Agent.Office Excel AI capability to automatically align quotation sheets from multiple different vendors to a unified template, calculate totals for comparison, and highlight the lowest price.
For product installation and SpireToken configuration, please refer to Integrating Spire.Agent.Office in a .NET Project. The following examples assume that Spire.Agent.Office is installed and SpireToken is configured.
Excel Format Quote Comparison
The core challenge of comparing multi-format quotation sheets is that each vendor's quotation sheet differs.
using Spire.Agent.Office.AI;
using Spire.Agent.Office.Extensions;
using Spire.Xls;

// Quotation files from different vendors
string[] attachmentPaths = new string[]
{
    @"vendor_A.xlsx",
    @"vendor_B.xlsx",
    @"vendor_C.xlsx",
    @"vendor_D.xlsx"
};

// Output template file
string inputPath = @"template.xlsx";
// Result document
string savePath = @"quote-comparison.xlsx";
string key = "**************************";
string instruction =
    "Read the quotation sheets of the vendors in the attachments (Vendor A, Vendor B, Vendor C, Vendor D) and process them as follows:" +
    "1. Identify the item, unit price, quantity, and total price columns in each quotation sheet, and align them to the Unit Price and Amount columns of the corresponding vendor (A, B, C, D) in the template;" +
    "2. If a vendor has not quoted a product, leave the corresponding unit price and amount cells blank and mark them as 'Not quoted';" +
    "3. Calculate the amount (quantity x unit price) for each product of each quoting vendor and fill it into the corresponding columns; compute each vendor's total quotation at the bottom of the template;" +
    "4. In the total price row, fill the cell of the vendor with the lowest total quotation with a green background (RGB:198,224,180);" +
    "5. In the 'Lowest Price Vendor' column, mark the vendor that offers the lowest unit price for each product, and fill the corresponding lowest unit price into the 'Lowest Price' column;" +
    "6. Preserve the template's layout style, fonts, and column widths;" +
    "Finally save the output as an Excel file";

// Call the Excel document processing function
AIResult result = ExecuteDemoExcel(instruction, inputPath, savePath, key,  attachmentPaths);


// Execute Excel document AI processing
static AIResult ExecuteDemoExcel(string instruction, string inputPath, string savePath, string key, string[] attachmentPaths)
{
    // Create the AIOptions configuration object
    AIOptions options = new AIOptions();
    options.SpireToken = key;

    // Use the Workbook object to process the Excel document
    using (Workbook workbook = new Workbook())
    {
        // Load the Excel template from file
        if (!string.IsNullOrEmpty(inputPath) && File.Exists(inputPath))
        {
            workbook.LoadFromFile(inputPath);
        }
        // Create the AI document processor
        AIWorkbookProcessor processor = workbook.AI(options);

        // Execute the AI instruction
        return processor.ExecuteInstruction(workbook, instruction, savePath, attachmentPaths);
    }
}
Original quotation sheets of each vendor 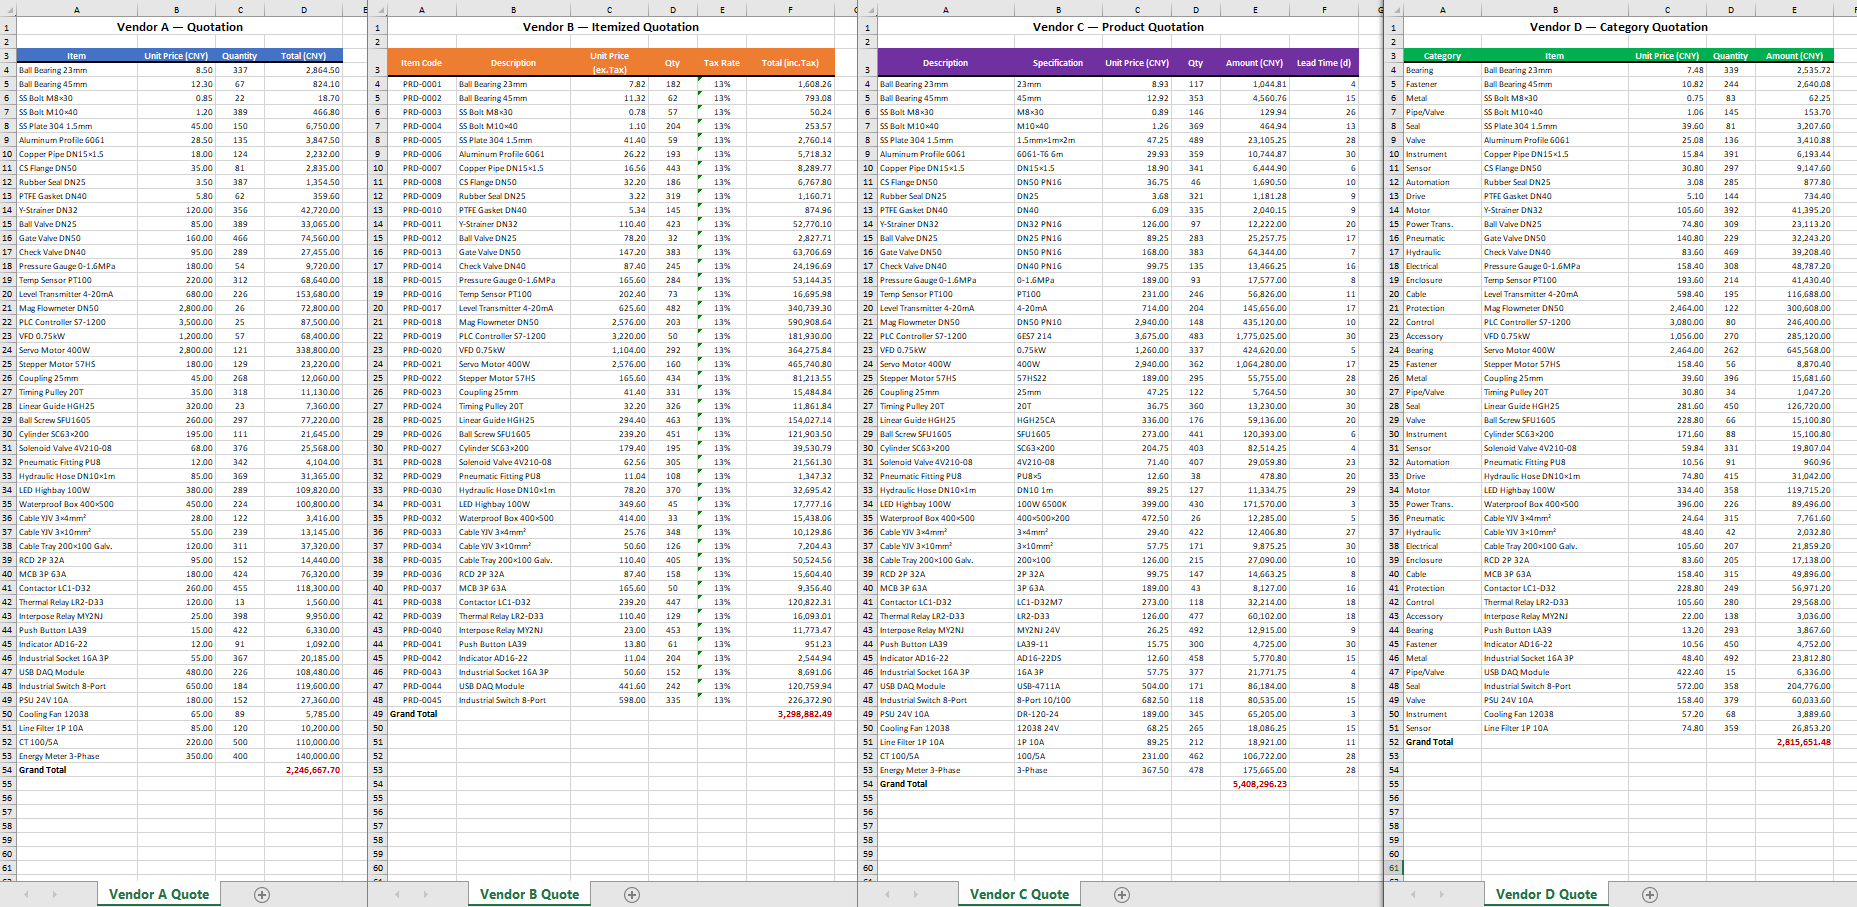 Original Excel template
 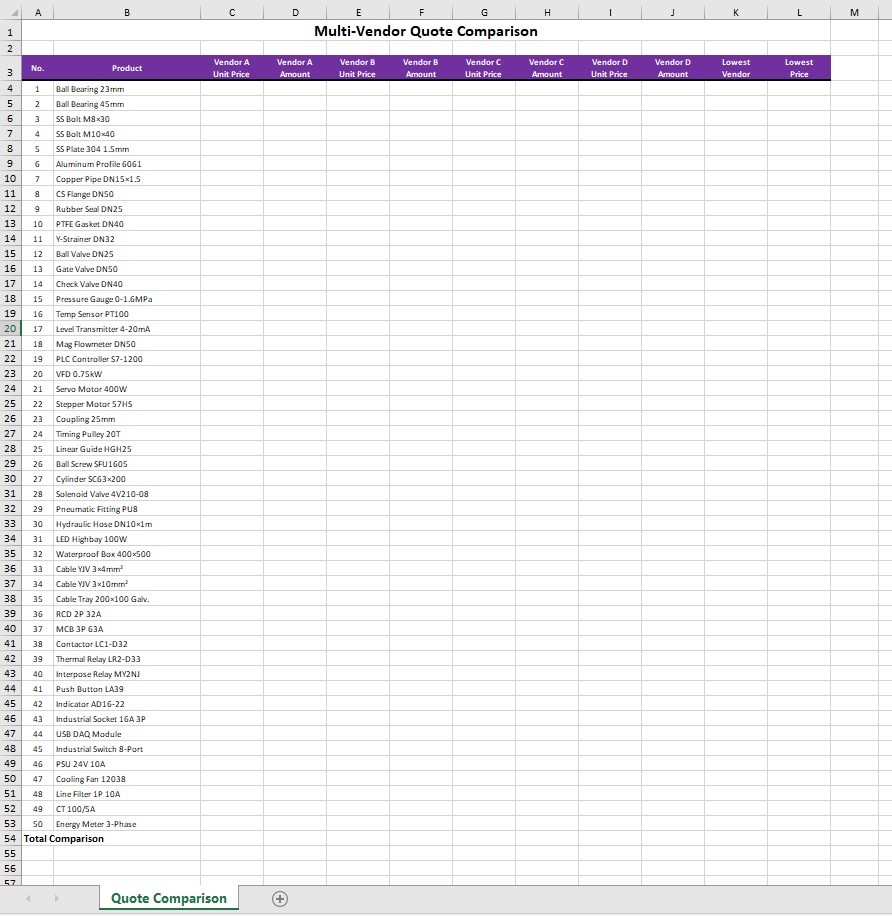 Comparison summary generated by Excel AI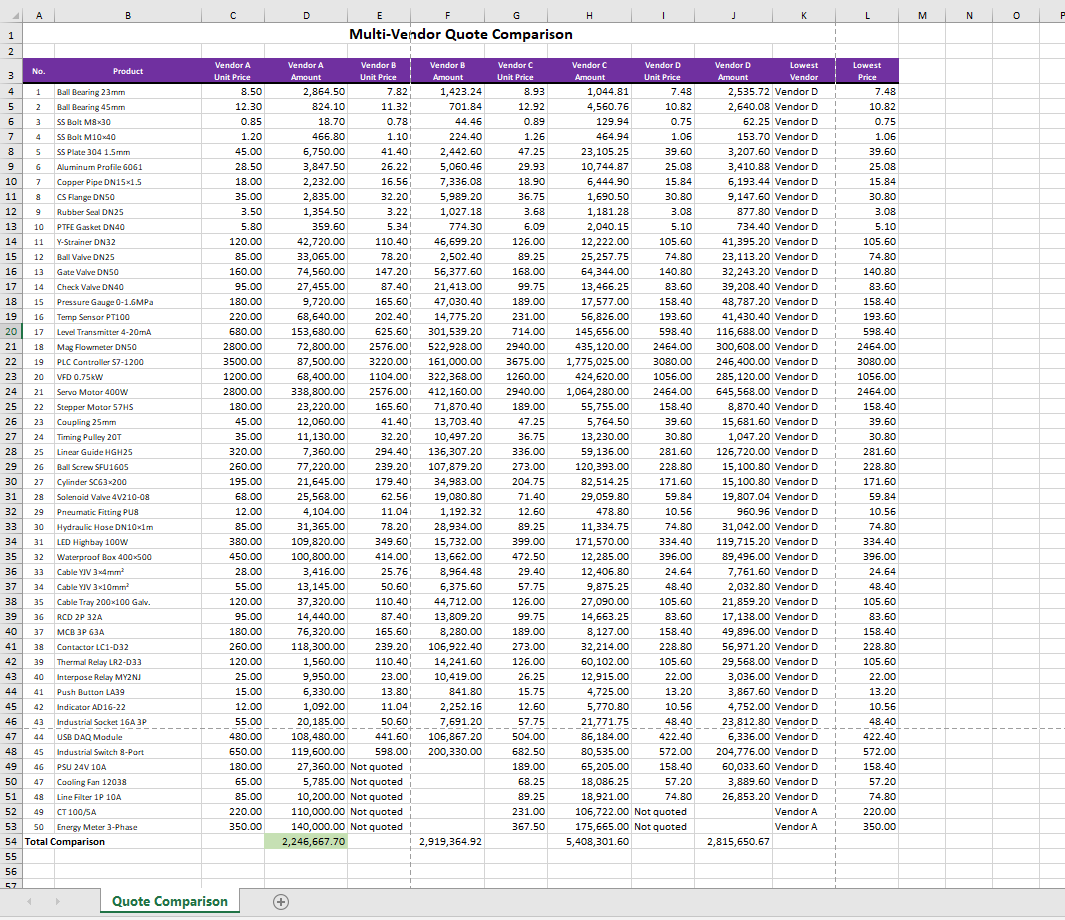
PDF Format Quote Comparison
When the original quotations are in PDF format, Spire.Agent.Office can equally extract the required data with ease and automatically complete the summary statistics. Simply add the source documents in different formats, and the AI instruction can be reused without reconfiguration, greatly improving processing efficiency.
using Spire.Agent.Office.AI;
using Spire.Agent.Office.Extensions;
using Spire.Xls;

// Quotation files from different vendors
string[] attachmentPaths = new string[]
{
    @"vendor_A.pdf",
    @"vendor_B.pdf",
    @"vendor_C.pdf",
    @"vendor_D.pdf"
};

// Output template file
string inputPath = @"template.xlsx";
// Result document
string savePath = @"quote-comparison.xlsx";
string key = "**************************";
string instruction =
    "Read the quotation sheets of the vendors in the attachments (Vendor A, Vendor B, Vendor C, Vendor D) and process them as follows:" +
    "1. Identify the item, unit price, quantity, and total price columns in each quotation sheet, and align them to the Unit Price and Amount columns of the corresponding vendor (A, B, C, D) in the template;" +
    "2. If a vendor has not quoted a product, leave the corresponding unit price and amount cells blank and mark them as 'Not quoted';" +
    "3. Calculate the amount (quantity x unit price) for each product of each quoting vendor and fill it into the corresponding columns; compute each vendor's total quotation at the bottom of the template;" +
    "4. In the total price row, fill the cell of the vendor with the lowest total quotation with a green background (RGB:198,224,180);" +
    "5. In the 'Lowest Price Vendor' column, mark the vendor that offers the lowest unit price for each product, and fill the corresponding lowest unit price into the 'Lowest Price' column;" +
    "6. Preserve the template's layout style, fonts, and column widths;" +
    "Finally save the output as an Excel file";

// Call the Excel document processing function
AIResult result = ExecuteDemoExcel(instruction, inputPath, savePath, key,  attachmentPaths);


// Execute Excel document AI processing
static AIResult ExecuteDemoExcel(string instruction, string inputPath, string savePath, string key, string[] attachmentPaths)
{
    // Create the AIOptions configuration object
    AIOptions options = new AIOptions();
    options.SpireToken = key;

    // Use the Workbook object to process the Excel document
    using (Workbook workbook = new Workbook())
    {
        // Load the Excel template from file
        if (!string.IsNullOrEmpty(inputPath) && File.Exists(inputPath))
        {
            workbook.LoadFromFile(inputPath);
        }
        // Create the AI document processor
        AIWorkbookProcessor processor = workbook.AI(options);

        // Execute the AI instruction
        return processor.ExecuteInstruction(workbook, instruction, savePath, attachmentPaths);
    }
}
Original PDF quotation of each vendor  Original Excel template
  Comparison summary generated by Excel AI
Comparison with Traditional SDK API Processing
| Spire.Office for .NET API | Spire.Agent.Office | |
|---|---|---|
| Code Volume | Reading data, mapping rows and columns, filling formulas, and applying conditional formatting require extensive code | Handled intelligently with a single natural language instruction |
| Format Adaptation | With the traditional SDK APIs, quotation sheets in different formats must be processed with different products | Just use the Excel AI to process data sources in various formats |
| Calculation Logic | Formulas and formatting must be set through APIs | AI understands and automatically completes the calculation and formatting |
| Requirement Changes | Modify the code and re-debug | Modify the instruction, effective immediately |
FAQ
Merged Cells in Quotation Sheets Cause Data Misalignment
Cause: Vendor quotation sheets may contain merged title cells or category labels merged across rows, which affect the AI's judgment of the row/column structure.
Solution: Clearly specify in the instruction "ignore the merged header rows and start reading data from row X," or provide a template file as a structural reference. If the issue persists, add the description "treat merged cells as ordinary cells and take their top-left value."
Processed Format Does Not Match Expectations
Cause: When understanding complex table layouts, the AI model may not preserve details such as column widths, row heights, and fonts precisely enough.
Solution: Add specific descriptions to the instruction, such as "preserve the existing column widths, row heights, fonts, borders, and alignment of the template."
Some Products Lack Vendor Quotations
Cause: The product lists provided by different vendors are not completely consistent, and some vendors may not have quoted certain products.
Solution: Clearly specify how to handle missing items in the instruction, such as "mark the cells without quotations as 'Not quoted' or leave them blank," and the AI will automatically identify and process them as required.
Obtaining a SpireToken Key
- Contact sales@e-iceblue.com or visit https://www.e-iceblue.com/TemLicense.html to obtain a trial/commercial API key.
Configure it in code:
AIOptions options = new AIOptions();
options.SpireToken = key;