
.NET (1327)
Children categories
The GoToE (or embedded go-to) action is similar to a remote go-to action but allows jumping to a PDF file that is embedded in another PDF file. With Spire.PDF, it’s possible to create a GoToE action to direct from the current PDF file to the embedded PDF file. This article demonstrates how to accomplish this goal programmatically with C#.
At first, it's necessary to introduce you the parameters of public PdfEmbeddedGoToAction(string fileName, PdfDestination dest, bool newWindow);
Parameters:
- fileName - the name of the target file.
- dest - the destination inside the target file.
- newWindow - if true open the file in a new window, if false the current file is replaced by the new file.
Now Follow below Detail steps:
Step 1: Create a PDF file and add a page to it.
PdfDocument pdf = new PdfDocument();
PdfPageBase page = pdf.Pages.Add();
Step 2: Attach a PDF file to the newly created file.
PdfAttachment attachment = new PdfAttachment("New Zealand.pdf");
pdf.Attachments.Add(attachment);
Step 3: Draw text on the page.
string text = "Test embedded go-to action! Click this will open the attached PDF in a new window.";
PdfTrueTypeFont font = new PdfTrueTypeFont(new Font("Arial", 13f));
float width = 490f;
float height = font.Height * 2.2f;
RectangleF rect = new RectangleF(0, 100, width, height);
page.Canvas.DrawString(text, font, PdfBrushes.Black, rect);
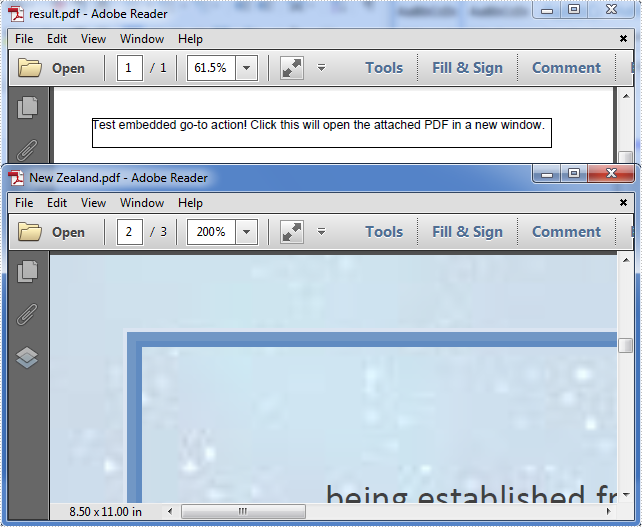
Step 4: Create an embedded go-to action (/GoToE) which allows jumping to the attached PDF file and open it in a new window at the 2nd page and 200% zoom factor.
PdfDestination dest = new PdfDestination(1, new PointF(0, 842), 2f);
PdfEmbeddedGoToAction action = new PdfEmbeddedGoToAction(attachment.FileName, dest, true);
Step 5: Create an action annotation with the embedded go-to action and then add it to the page.
PdfActionAnnotation annotation = new PdfActionAnnotation(rect, action);
(page as PdfNewPage).Annotations.Add(annotation);
Step 6: Save the document.
pdf.SaveToFile("result.pdf");
Effective Screenshot:
Full code:
using System.Drawing;
using Spire.Pdf;
using Spire.Pdf.Actions;
using Spire.Pdf.Annotations;
using Spire.Pdf.Attachments;
using Spire.Pdf.General;
using Spire.Pdf.Graphics;

namespace Create_A_GoToE_Action
{
    class Program
    {
        static void Main(string[] args)
        {
            PdfDocument pdf = new PdfDocument();
            PdfPageBase page = pdf.Pages.Add();
            PdfAttachment attachment = new PdfAttachment("New Zealand.pdf");
            pdf.Attachments.Add(attachment);
            string text = "Test embedded go-to action! Click this will open the attached PDF in a new window.";
            PdfTrueTypeFont font = new PdfTrueTypeFont(new Font("Arial", 13f));
            float width = 490f;
            float height = font.Height * 2.2f;
            RectangleF rect = new RectangleF(0, 100, width, height);
            page.Canvas.DrawString(text, font, PdfBrushes.Black, rect);
            PdfDestination dest = new PdfDestination(1, new PointF(0, 842), 2f);
            PdfEmbeddedGoToAction action = new PdfEmbeddedGoToAction(attachment.FileName, dest, true);
            PdfActionAnnotation annotation = new PdfActionAnnotation(rect, action);
            (page as PdfNewPage).Annotations.Add(annotation);
            pdf.SaveToFile("result.pdf");
        }
    }
}
With Spire.Doc for .NET, developers can easily operate the word fields from code. We have already shown how to create an IF field and remove Custom Property Fields in C#. From Spire.Doc V5.8.33, our developers add a new event UpdateFields to handle the Ask Field. This article will focus on demonstrating how to update the ASK field on the word document in C#.
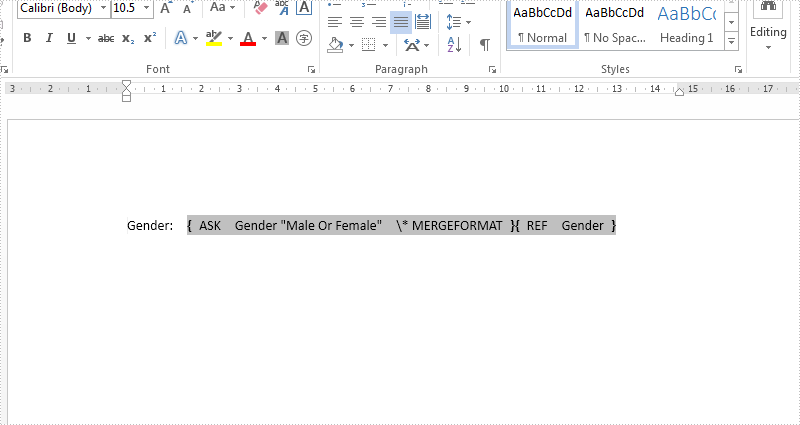
Firstly, please view the sample document with an Ask filed which will be updated later:
Step 1: Create a new instance of Spire.Doc.Document class and load the document from file.
Document doc = new Document();
doc.LoadFromFile("Sample.docx");
Step 2: Call UpdateFieldsHandler event to update the ASK field.
doc.UpdateFields += new UpdateFieldsHandler(doc_UpdateFields);
Step 3: Update the fields in the document.
doc.IsUpdateFields = true;
Step 4: Save the document to file.
doc.SaveToFile("output.docx", FileFormat.Docx);
The following doc_UpdateFields () method shows how to update the ask field:
private static void doc_UpdateFields(object sender, IFieldsEventArgs args)
 {
     if (args is AskFieldEventArgs)
     {
         AskFieldEventArgs askArgs = args as AskFieldEventArgs;

         askArgs.ResponseText = "Female";
     }
 }
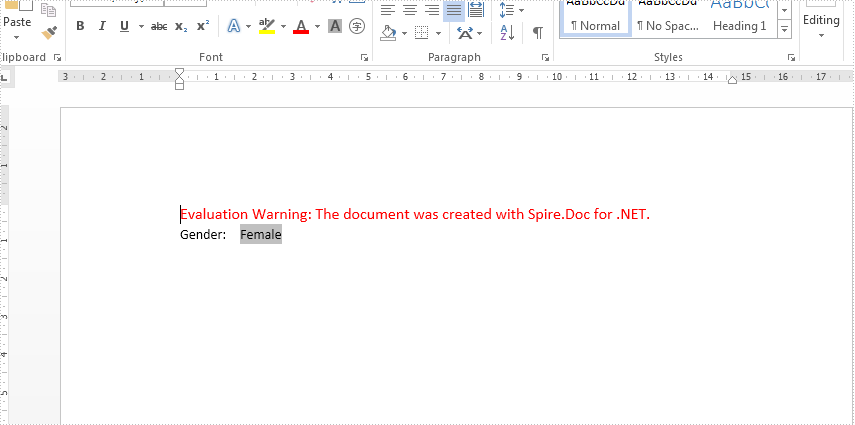
Effective screenshot after updating the Ask Field in C#:
Full codes:
using Spire.Doc;
using Spire.Doc.Fields;
namespace Askfield
{
    class Program
    {
        public void Field()
        {

            Document doc = new Document();
            doc.LoadFromFile("Sample.docx");

            doc.UpdateFields += new UpdateFieldsHandler(doc_UpdateFields);

            doc.IsUpdateFields = true;

            doc.SaveToFile("output.docx", FileFormat.Docx);

        }
        private static void doc_UpdateFields(object sender, IFieldsEventArgs args)
        {
            if (args is AskFieldEventArgs)
            {
                AskFieldEventArgs askArgs = args as AskFieldEventArgs;

                askArgs.ResponseText = "Female";
            }
        }


    }
}
How to Delete Rows and Columns from a Word Table in C#, VB.NET
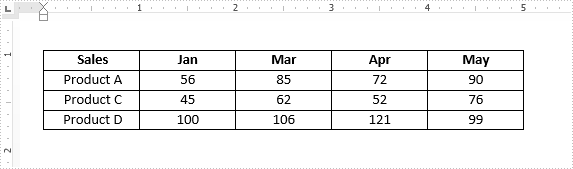
2016-12-22 09:23:02 Written by AdministratorAdding rows and columns are common tasks in Word table processing, on the contrary, sometimes we also have the requirement of deleting rows or columns from a table. This article demonstrates how to delete a row and a column from an existing Word table using Spire.Doc.
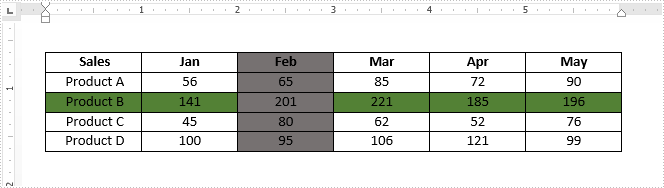
Below is the screenshot of the original table. Afterwards, we will remove the colored row and column from the table.
Detail steps:
Step 1: Instantiate a Document object and load the Word document.
Document doc = new Document();
doc.LoadFromFile("Sample.docx");
Step 2: Get the table from the document.
Table table = doc.Sections[0].Tables[0] as Table;
Step 3: Delete the third row from the table.
table.Rows.RemoveAt(2);
Step 4: Delete the third column from the table.
for (int i = 0; i < table.Rows.Count; i++)
{
    table.Rows[i].Cells.RemoveAt(2);
}
Step 5: Save the document.
doc.SaveToFile("result.docx", FileFormat.Docx2013);
Output:
Full code:
using Spire.Doc;

namespace Delete_Rows_and_Columns
{
    class Program
    {
        static void Main(string[] args)
        {
            Document doc = new Document();
            doc.LoadFromFile("Sample.docx");
            Table table = doc.Sections[0].Tables[0] as Table;
            table.Rows.RemoveAt(2);
            for (int i = 0; i < table.Rows.Count; i++)
            {
                table.Rows[i].Cells.RemoveAt(2);
            }
            doc.SaveToFile("result.docx", FileFormat.Docx2013);
        }
    }
}
Imports Spire.Doc

Namespace Delete_Rows_and_Columns
	Class Program
		Private Shared Sub Main(args As String())
			Dim doc As New Document()
			doc.LoadFromFile("Sample.docx")
			Dim table As Table = TryCast(doc.Sections(0).Tables(0), Table)
			table.Rows.RemoveAt(2)
			For i As Integer = 0 To table.Rows.Count - 1
				table.Rows(i).Cells.RemoveAt(2)
			Next
		        doc.SaveToFile("result.docx", FileFormat.Docx2013);
		End Sub
	End Class
End Namespace
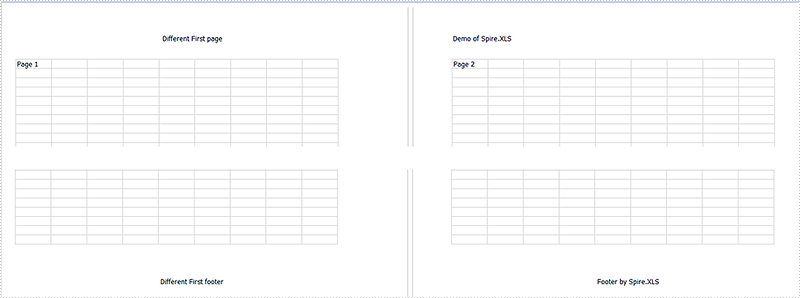
With the help of Spire.XLS, we could easily add header and footer to the excel page; we can also set different Header and Footer for Odd and Even Pages in Excel. This article will demonstrate how to add different header & footer for the first page on the excel worksheet.
Here comes to the code snippets of how to set different header and footer for the first page:
Step 1: Initialize an instance of Workbook and get the first worksheet.
Workbook workbook = new Workbook();
Worksheet sheet = workbook.Worksheets[0];
Step 2: Set the value of DifferentFirst as 1, which indicates that headers/footers for first page are different from the other pages.
Step 3: Set the header and footer for the first page.
sheet.PageSetup.FirstHeaderString = "Different First page";
sheet.PageSetup.FirstFooterString = "Different First footer";
Step 4: Set the other pages' header and footer. If we don't need to set the header and footer for other pages, we can ignore this step.
sheet.PageSetup.LeftHeader = "Demo of Spire.XLS";
sheet.PageSetup.CenterFooter = "Footer by Spire.XLS";
Step 5: Save the document to file.
workbook.SaveToFile("Result.xlsx", FileFormat.Version2010);
Effective screenshot:
Full codes:
using Spire.Xls;
namespace SetDifferentHeaderorFooter
{
    class Program
    {
        static void Main(string[] args)
        {
            Workbook workbook = new Workbook();
            Worksheet sheet = workbook.Worksheets[0];

            sheet.PageSetup.DifferentFirst = 1;

            sheet.PageSetup.FirstHeaderString = "Different First page";
            sheet.PageSetup.FirstFooterString = "Different First footer";

            sheet.PageSetup.LeftHeader = "Demo of Spire.XLS";
            sheet.PageSetup.CenterFooter = "Footer by Spire.XLS";

            workbook.SaveToFile("result.xlsx", FileFormat.Version2010);
        }
    }
}
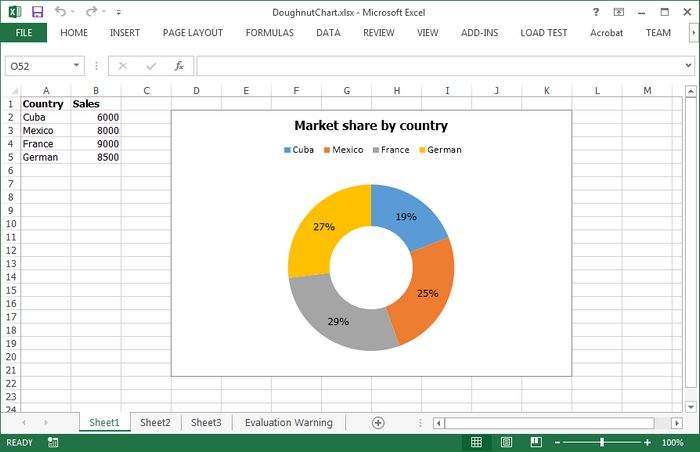
A donut chart is a variant of the pie chart, with a blank center allowing for additional information about the data as a whole to be included. In this article, you will learn how to create a doughnut chart using Spire.XLS in C#.
Step 1: Initialize a new instance of Workbook class and set the Excel version as 2013.
Workbook wb = new Workbook();
wb.Version = ExcelVersion.Version2013;
Step 2: Get the first sheet from workbook.
Worksheet sheet = wb.Worksheets[0];
Step 3: Insert some data in the sheet.
sheet.Range["A1"].Value = "Country";
sheet.Range["A1"].Style.Font.IsBold = true;
sheet.Range["A2"].Value = "Cuba";
sheet.Range["A3"].Value = "Mexico";
sheet.Range["A4"].Value = "France";
sheet.Range["A5"].Value = "German";
sheet.Range["B1"].Value = "Sales";
sheet.Range["B1"].Style.Font.IsBold = true;
sheet.Range["B2"].NumberValue = 6000;
sheet.Range["B3"].NumberValue = 8000;
sheet.Range["B4"].NumberValue = 9000;
sheet.Range["B5"].NumberValue = 8500;
Step 4: Create a Doughnut Chart based on the data from range A1:B5.
Chart chart = sheet.Charts.Add();
chart.ChartType = ExcelChartType.Doughnut;
chart.DataRange = sheet.Range["A1:B5"];
chart.SeriesDataFromRange = false;
Step 5: Set the chart position.
chart.LeftColumn = 4;
chart.TopRow = 2;
chart.RightColumn = 12;
chart.BottomRow = 22;
Step 6: Display percentage value in data labels.
foreach (ChartSerie cs in chart.Series)
{
    cs.DataPoints.DefaultDataPoint.DataLabels.HasPercentage = true;
}
Step 7: Save the file.
wb.SaveToFile("DoughnutChart.xlsx",ExcelVersion.Version2010);
Output:
Full Code:
using Spire.Xls;
using Spire.Xls.Charts;

namespace DoughnutChart
{
    class Program
    {
        static void Main(string[] args)
        {
            Workbook wb = new Workbook();
            wb.Version = ExcelVersion.Version2013;
            Worksheet sheet = wb.Worksheets[0];

            //insert data
            sheet.Range["A1"].Value = "Country";
            sheet.Range["A1"].Style.Font.IsBold = true;
            sheet.Range["A2"].Value = "Cuba";
            sheet.Range["A3"].Value = "Mexico";
            sheet.Range["A4"].Value = "France";
            sheet.Range["A5"].Value = "German";
            sheet.Range["B1"].Value = "Sales";
            sheet.Range["B1"].Style.Font.IsBold = true;
            sheet.Range["B2"].NumberValue = 6000;
            sheet.Range["B3"].NumberValue = 8000;
            sheet.Range["B4"].NumberValue = 9000;
            sheet.Range["B5"].NumberValue = 8500;

            //add a new chart, set chart type as doughnut
            Chart chart = sheet.Charts.Add();
            chart.ChartType = ExcelChartType.Doughnut;
            chart.DataRange = sheet.Range["A1:B5"];
            chart.SeriesDataFromRange = false;

            //set position of chart
            chart.LeftColumn = 4;
            chart.TopRow = 2;
            chart.RightColumn = 12;
            chart.BottomRow = 22;

            //chart title
            chart.ChartTitle = "Market share by country";
            chart.ChartTitleArea.IsBold = true;
            chart.ChartTitleArea.Size = 12;

            foreach (ChartSerie cs in chart.Series)
            {
                cs.DataPoints.DefaultDataPoint.DataLabels.HasPercentage = true;
            }

            chart.Legend.Position = LegendPositionType.Top;
            wb.SaveToFile("DoughnutChart.xlsx",ExcelVersion.Version2010);
        }
    }
}
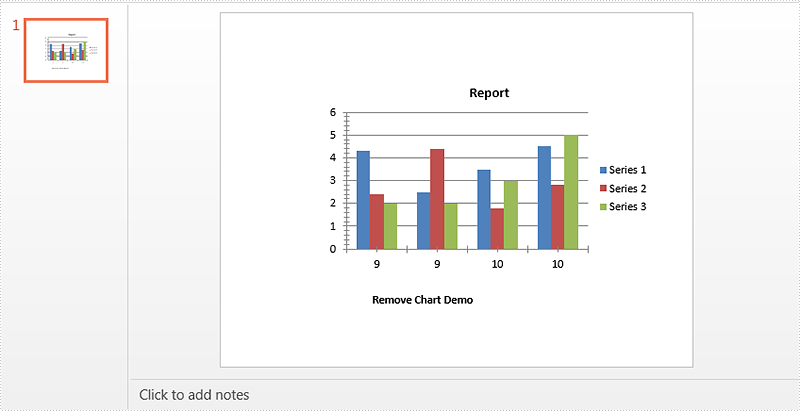
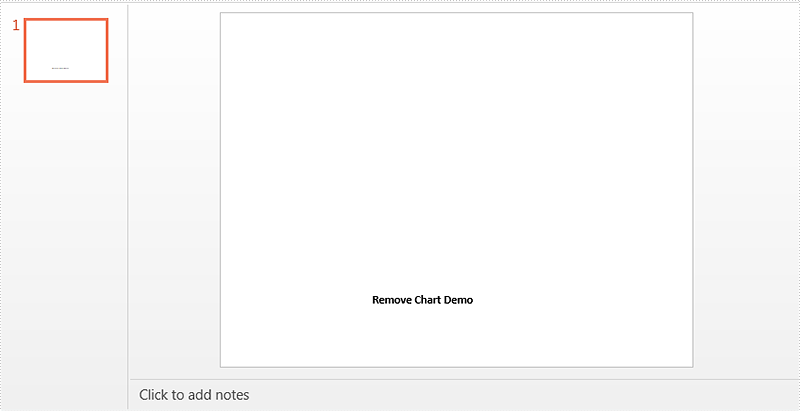
In previous topics, we demonstrated how to create, format, protect and copy chart in PowerPoint. In this article, we'll show you how to remove chart from a specific slide by using Spire.Presentation.
Below is a sample document which contains a chart and a textbox on the first slide, then we'll remove the chart from the slide.
Code Snippets:
Step 1: Instantiate a Presentation object and load the PowerPoint document.
Presentation ppt = new Presentation();
ppt.LoadFromFile("Sample.pptx");
Step 2: Get the first slide from the document.
ISlide slide = ppt.Slides[0];
Step 3: Remove chart from the slide.
for(int i = 0; i < slide.Shapes.Count; i++)
{
    IShape shape = slide.Shapes[i] as IShape;
    if(shape is IChart)
    {
        slide.Shapes.Remove(shape);
    }
}
Step 4: Save the document.
ppt.SaveToFile("result.pptx", FileFormat.Pptx2010);
Effective screenshot:
Full code:
using Spire.Presentation;
using Spire.Presentation.Charts;

namespace Remove_Chart_in_PowerPoint
{
    class Program
    {
        static void Main(string[] args)
        {
            Presentation ppt = new Presentation();
            ppt.LoadFromFile("Sample.pptx");
            ISlide slide = ppt.Slides[0];
            for(int i = 0; i < slide.Shapes.Count; i++)
            {
                IShape shape = slide.Shapes[i] as IShape;
                if(shape is IChart)
                {
                    slide.Shapes.Remove(shape);
                }
            }
            ppt.SaveToFile("result.pptx", FileFormat.Pptx2010);
        }
    }
}
Imports Spire.Presentation
Imports Spire.Presentation.Charts

Namespace Remove_Chart_in_PowerPoint
	Class Program
		Private Shared Sub Main(args As String())
			Dim ppt As New Presentation()
			ppt.LoadFromFile("Sample.pptx")
			Dim slide As ISlide = ppt.Slides(0)
			For i As Integer = 0 To slide.Shapes.Count - 1
				Dim shape As IShape = TryCast(slide.Shapes(i), IShape)
				If TypeOf shape Is IChart Then
					slide.Shapes.Remove(shape)
				End If
			Next
			ppt.SaveToFile("result.pptx", FileFormat.Pptx2010)
		End Sub
	End Class
End Namespace
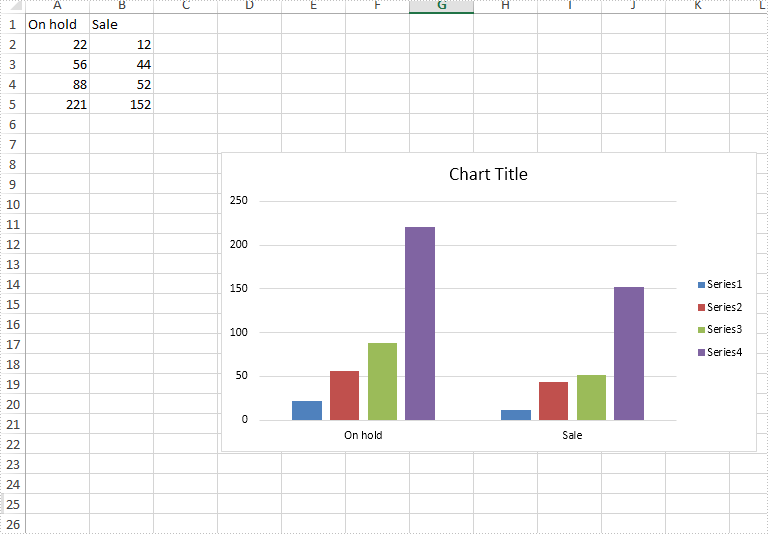
Set font for the text on Chart title and Chart Axis in C#
2016-12-15 07:36:41 Written by AdministratorSpire.XLS offers multiple functions to enable developers to set the font for the text for Excel chart. We have already demonstrated how to set the font for the text on legend and datalable in Excel chart by using the SetFont() in C#. This article will focus on showing how to set font for the text on Chart title and Chart Axis.
Firstly, please view the Excel worksheet with chart which the font will be changed later:
Note: Before Start, please download the latest version of Spire.XLS and add Spire.Xls.dll in the bin folder as the reference of Visual Studio.
Step 1: Create a new Excel workbook and load from file.
Workbook workbook = new Workbook();
workbook.LoadFromFile("Sample.xlsx");
Step 2: Get the first worksheet from workbook.
Worksheet worksheet = workbook.Worksheets[0];
Spire.Xls.Chart chart = worksheet.Charts[0];
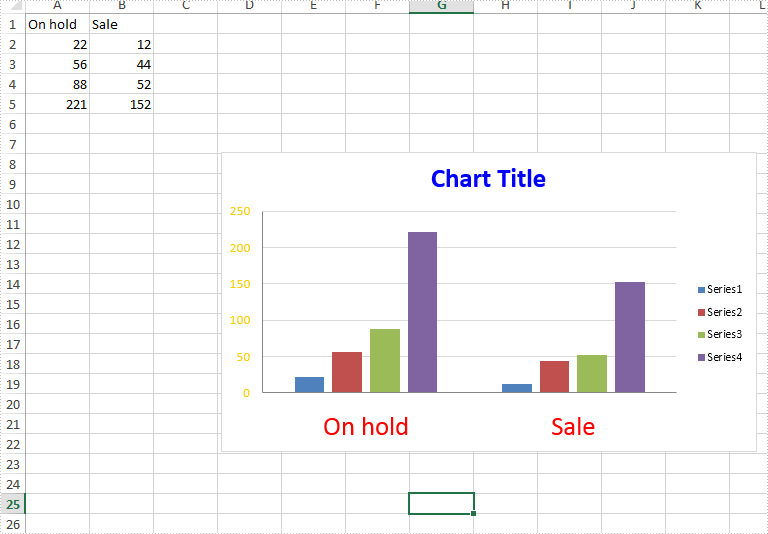
Step 3: Format the font for the chart title.
chart.ChartTitleArea.Font.Color = Color.Blue;
chart.ChartTitleArea.Font.Size = 20.0;
Step 4: Format the font for the chart Axis.
chart.PrimaryValueAxis.Font.Color = Color.Gold;
chart.PrimaryValueAxis.Font.Size = 10.0;

chart.PrimaryCategoryAxis.Font.Color = Color.Red;
chart.PrimaryCategoryAxis.Font.Size = 20.0;
Step 5: Save the document to file.
workbook.SaveToFile("result.xlsx", FileFormat.Version2010);
Effective screenshot after formatting the font for the chart title and chart axis.
Full codes:
using Spire.Xls;
using System.Drawing;

namespace SetFont
{
    class Program
    {
        static void Main(string[] args)
        {
            Workbook workbook = new Workbook();
            workbook.LoadFromFile("Sample.xlsx");

            Worksheet worksheet = workbook.Worksheets[0];
            Spire.Xls.Chart chart = worksheet.Charts[0];

            chart.ChartTitleArea.Color = Color.Blue;
            chart.ChartTitleArea.Size = 20.0;

            chart.PrimaryValueAxis.Font.Color = Color.Gold;
            chart.PrimaryValueAxis.Font.Size = 10.0;

            chart.PrimaryCategoryAxis.Font.Color = Color.Red;
            chart.PrimaryCategoryAxis.Font.Size = 20.0;

            workbook.SaveToFile("result.xlsx", FileFormat.Version2010);
        }
    }
}
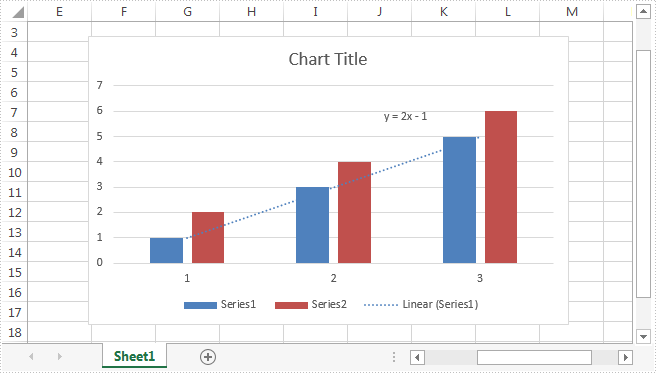
Excel provides an option to display the trendline equation when we add a trendline on a chart. Sometimes, we may have the requirement of extracting the trendline equation from the chart. This article introduces a simple method to implement this aim by using Spire.XLS.
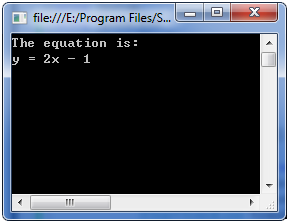
For demonstration, we used a sample chart which contains a trendline equation: y=2x – 1.
Code snippets:
Step 1: Instantiate a Workbook object and load the Excel document.
Workbook workbook = new Workbook();
workbook.LoadFromFile("Sample.xlsx");
Step 2: Get the chart from the first worksheet.
Chart chart = workbook.Worksheets[0].Charts[0];
Step 3: Get the trendline of the chart and then extract the equation of the trendline.
IChartTrendLine trendLine = chart.Series[0].TrendLines[0];
string formula = trendLine.Formula;
Effective screenshot:
Full code:
using System;
using Spire.Xls;
using Spire.Xls.Core;

namespace Extract_the_equation
{
    class Program
    {
        static void Main(string[] args)
        {
            Workbook workbook = new Workbook();
            workbook.LoadFromFile("Sample.xlsx");
            Chart chart = workbook.Worksheets[0].Charts[0];
            IChartTrendLine trendLine = chart.Series[0].TrendLines[0];
            string formula = trendLine.Formula;
            Console.WriteLine("The equation is:\n" +formula);
            Console.ReadKey();
        }
    }
}
Imports Spire.Xls
Imports Spire.Xls.Core

Namespace Extract_the_equation
	Class Program
		Private Shared Sub Main(args As String())
			Dim workbook As New Workbook()
			workbook.LoadFromFile("Sample.xlsx")
			Dim chart As Chart = workbook.Worksheets(0).Charts(0)
			Dim trendLine As IChartTrendLine = chart.Series(0).TrendLines(0)
			Dim formula As String = trendLine.Formula
			Console.WriteLine(Convert.ToString("The equation is:" & vbLf) & formula)
			Console.ReadKey()
		End Sub
	End Class
End Namespace
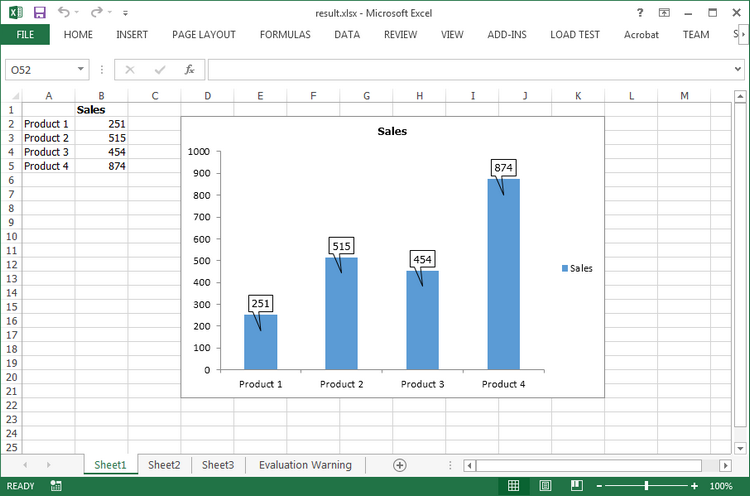
Excel 2013 has provided some new charting features, for example, it enables users to set data callout labels which makes it easier to show the details about the data series or its individual data points in a clear and easy-to-read format. This article is going to introduce how to add data callout labels to a chart using Spire.XLS.
Step 1: Initialize a new instance of Workbook class and set the Excel version as 2013.
Workbook wb = new Workbook();
wb.Version = ExcelVersion.Version2013;
Step 2: Get the first sheet from workbook.
Worksheet ws = wb.Worksheets[0];
Step 3: Insert some data.
ws.Range["A2"].Text = "Product 1";
ws.Range["A3"].Text = "Product 2";
ws.Range["A4"].Text = "Product 3";
ws.Range["A5"].Text = "Product 4";
ws.Range["B1"].Text = "Sales";
ws.Range["B1"].Style.Font.IsBold = true;
ws.Range["B2"].NumberValue = 251;
ws.Range["B3"].NumberValue = 515;
ws.Range["B4"].NumberValue = 454;
ws.Range["B5"].NumberValue = 874;
Step 4: Create a Clustered Column Chart based on the data from range A1:B5.
Chart chart = ws.Charts.Add(ExcelChartType.ColumnClustered);
chart.DataRange = ws.Range["A1:B5"];
chart.SeriesDataFromRange = false;
chart.PrimaryValueAxis.HasMajorGridLines = false;
Step 5: Set the chart position.
chart.LeftColumn = 4;
chart.TopRow = 2;
chart.RightColumn = 12;
chart.BottomRow = 22;
Step 6: Set the HasWedgeCallout property as true to display callout labels in a chart.
foreach (ChartSerie cs in chart.Series)
{
    cs.DataPoints.DefaultDataPoint.DataLabels.HasValue = true;
    cs.DataPoints.DefaultDataPoint.DataLabels.HasWedgeCallout = true;
}
Step 7: Save the file.
wb.SaveToFile("result.xlsx", FileFormat.Version2013);
Output:
Full Code:
using Spire.Xls;
using Spire.Xls.Charts;

namespace AddCalloutLabels
{
    class Program
    {
        static void Main(string[] args)
        {
            Workbook wb = new Workbook();
            wb.Version = ExcelVersion.Version2013;
            Worksheet ws = wb.Worksheets[0];

            ws.Range["A2"].Text = "Product 1";
            ws.Range["A3"].Text = "Product 2";
            ws.Range["A4"].Text = "Product 3";
            ws.Range["A5"].Text = "Product 4";
            ws.Range["B1"].Text = "Sales";
            ws.Range["B1"].Style.Font.IsBold = true;
            ws.Range["B2"].NumberValue = 251;
            ws.Range["B3"].NumberValue = 515;
            ws.Range["B4"].NumberValue = 454;
            ws.Range["B5"].NumberValue = 874;

            Chart chart = ws.Charts.Add(ExcelChartType.ColumnClustered);
            chart.DataRange = ws.Range["A1:B5"];
            chart.SeriesDataFromRange = false;
            chart.PrimaryValueAxis.HasMajorGridLines = false;

            chart.LeftColumn = 4;
            chart.TopRow = 2;
            chart.RightColumn = 12;
            chart.BottomRow = 22;

            foreach (ChartSerie cs in chart.Series)
            {
                cs.DataPoints.DefaultDataPoint.DataLabels.HasValue = true;
                cs.DataPoints.DefaultDataPoint.DataLabels.HasWedgeCallout = true;
            }
            wb.SaveToFile("result.xlsx", FileFormat.Version2013);
        }
    }
}
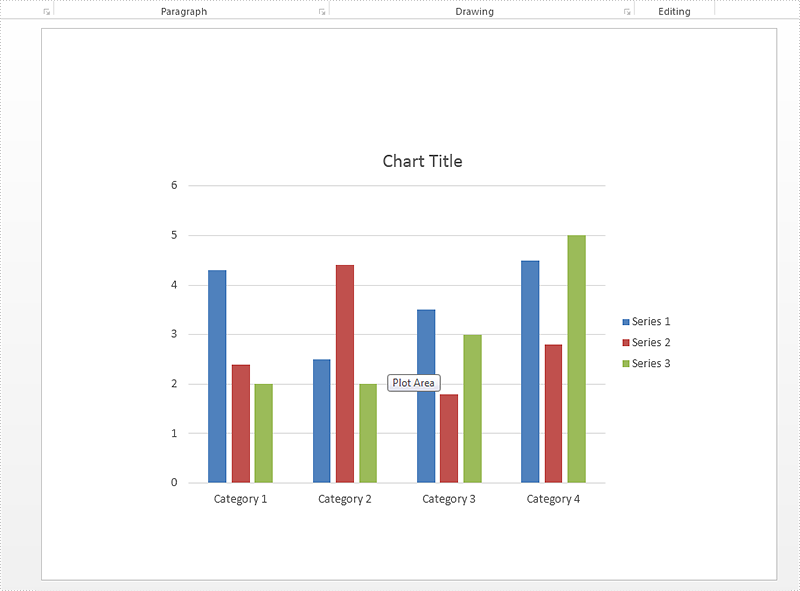
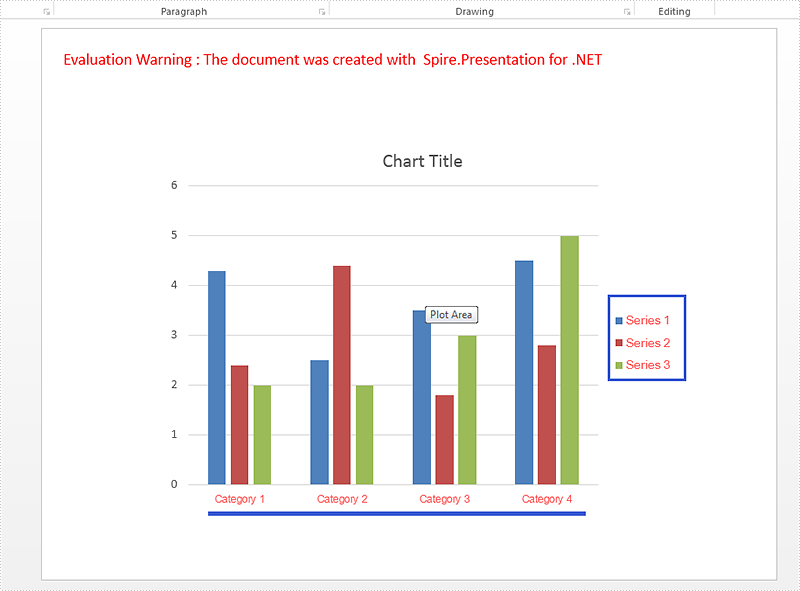
Spire.Presentation offers multiple functions to set the format for the chart elements. We have already shown you how to set the color for datapoints of series and format data labels of chart series in the PowerPoint document. This article will focus on demonstrating how to set font for text on chart legend and chart axis in C#.
Firstly please check the custom chart on presentation slides:
Step 1: Create a presentation instance and load the document from file.
Presentation presentation = new Presentation();
presentation.LoadFromFile("sample.pptx", FileFormat.Pptx2010);
Step 2: Get the chart that need to be formatted the font for the text on chart legend and chart axis.
IChart chart = presentation.Slides[0].Shapes[0] as IChart;
Step 3: Set the font for the text on Chart Legend area.
chart.ChartLegend.TextProperties.Paragraphs[0].DefaultCharacterProperties.Fill.SolidColor.KnownColor = KnownColors.Red;
chart.ChartLegend.TextProperties.Paragraphs[0].DefaultCharacterProperties.LatinFont = new TextFont("Arial Unicode MS");
Step 4: Set the font for the text on Chart Axis area.
chart.PrimaryCategoryAxis.TextProperties.Paragraphs[0].DefaultCharacterProperties.Fill.SolidColor.KnownColor = KnownColors.Red;
chart.PrimaryCategoryAxis.TextProperties.Paragraphs[0].DefaultCharacterProperties.Fill.FillType = FillFormatType.Solid;
chart.PrimaryCategoryAxis.TextProperties.Paragraphs[0].DefaultCharacterProperties.FontHeight = 10;
chart.PrimaryCategoryAxis.TextProperties.Paragraphs[0].DefaultCharacterProperties.LatinFont = new TextFont("Arial Unicode MS");
Step 5: Save the document to file:
presentation.SaveToFile("result.pptx", FileFormat.Pptx2010);
Effective screenshot after formatting the font for the chart legend and chart Axis.
Full codes:
using Spire.Presentation;
using Spire.Presentation.Charts;
using Spire.Presentation.Drawing;

namespace SetFont
{
    class Program
    {
        static void Main(string[] args)
        {
            Presentation presentation = new Presentation();
            presentation.LoadFromFile("sample.pptx", FileFormat.Pptx2010);

            IChart chart = presentation.Slides[0].Shapes[0] as IChart;

            chart.ChartLegend.TextProperties.Paragraphs[0].DefaultCharacterProperties.Fill.SolidColor.KnownColor = KnownColors.Red;
            chart.ChartLegend.TextProperties.Paragraphs[0].DefaultCharacterProperties.LatinFont = new TextFont("Arial Unicode MS");

            chart.PrimaryCategoryAxis.TextProperties.Paragraphs[0].DefaultCharacterProperties.Fill.SolidColor.KnownColor = KnownColors.Red;
            chart.PrimaryCategoryAxis.TextProperties.Paragraphs[0].DefaultCharacterProperties.Fill.FillType = FillFormatType.Solid;
            chart.PrimaryCategoryAxis.TextProperties.Paragraphs[0].DefaultCharacterProperties.FontHeight = 10;
            chart.PrimaryCategoryAxis.TextProperties.Paragraphs[0].DefaultCharacterProperties.LatinFont = new TextFont("Arial Unicode MS");

            presentation.SaveToFile("result.pptx", FileFormat.Pptx2010);

        }
    }
}
