
Knowledgebase (2370)
Children categories
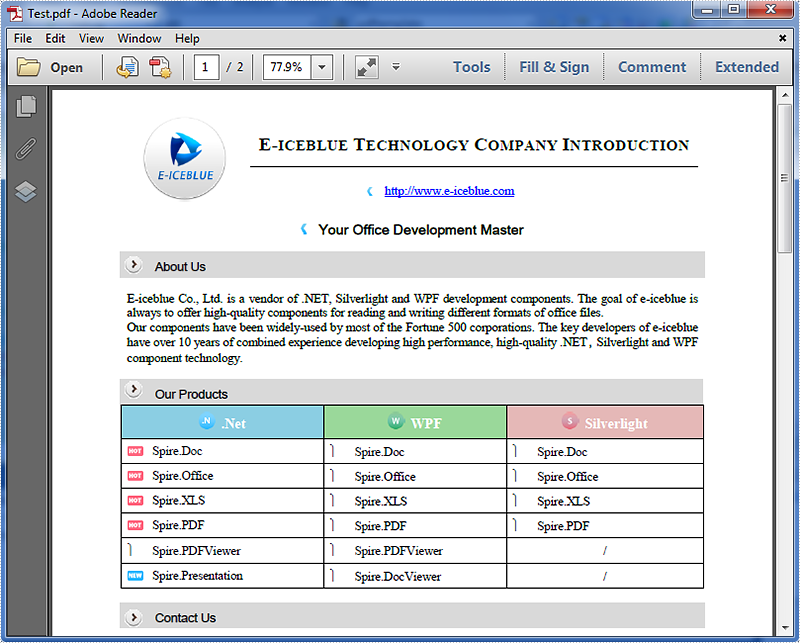
Spire.PDF allows us to convert a PDF document, a single page or a range of pages in a PDF document to SVG file format. We have introduced how to convert a PDF document to SVG, in this tutorial, we are going to demonstrate how to convert a PDF page to SVG.
Below is the source PDF file we used in this example:
Code snippets:
Step 1: Instantiate an object of PdfDocument class and load the PDF document.
PdfDocument doc = new PdfDocument();
doc.LoadFromFile("Test.pdf");
Step 2: Convert the first page of the PDF document to SVG using the SaveToFile(string filename, int startIndex, int endIndex, FileFormat fileFormat) method.
doc.SaveToFile("Result.svg", 0, 0, FileFormat.SVG);
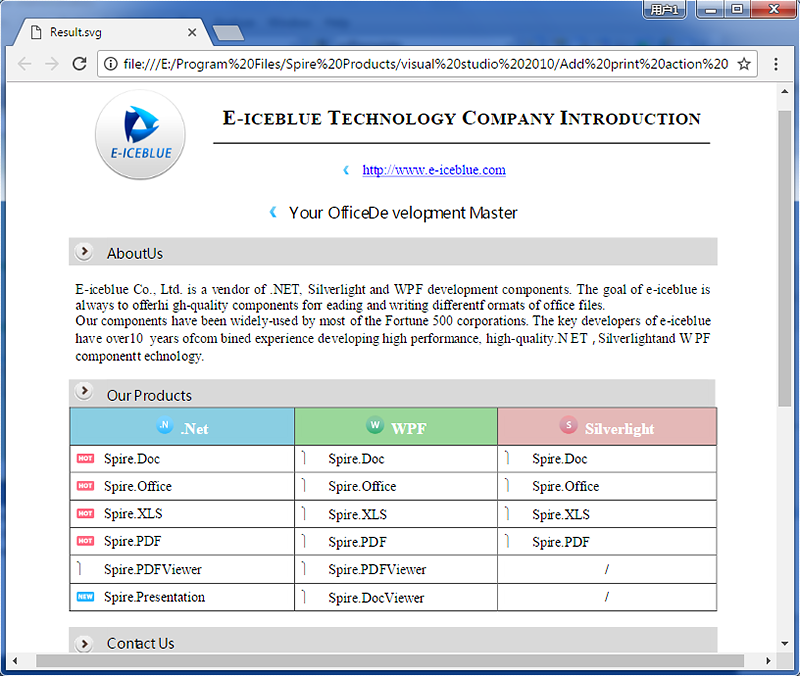
The resultant SVG file looks as follows:
Full code:
using Spire.Pdf;

namespace PDF_Page_to_SVG
{
    class Program
    {
        static void Main(string[] args)
        {
            PdfDocument doc = new PdfDocument();
            doc.LoadFromFile("Test.pdf");
            doc.SaveToFile("Result.svg", 0, 0, FileFormat.SVG);
        }
    }
}
Imports Spire.Pdf

Namespace PDF_Page_to_SVG
	Class Program
		Private Shared Sub Main(args As String())
			Dim doc As New PdfDocument()
			doc.LoadFromFile("Test.pdf")
			doc.SaveToFile("Result.svg", 0, 0, FileFormat.SVG)
		End Sub
	End Class
End Namespace
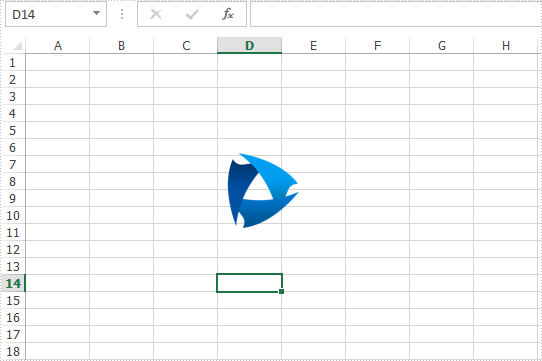
When we add an image to the Excel worksheet, we always need to reset the size and position for the image to list the image where we want and make the size coordinate with the other elements on the Excel worksheet. This article will focus on demonstrates how to apply picture settings by using Spire.XLS.
Step 1: Initialize an instance of Workbook and get the first worksheet.
Workbook workbook = new Workbook();
Worksheet sheet = workbook.Worksheets[0];
Step 2: Add a picture to the first worksheet.
ExcelPicture picture = sheet.Pictures.Add(1, 1, "Logo.png");
Step 3: Set the size for the picture.
picture.Width = 75;
picture.Height = 75;
Step 4: Set the position for the picture.
picture.Left = 200;
picture.Top = 100;
Step 5: Save the document to file.
workbook.SaveToFile("Output.xlsx",FileFormat.Version2013);
Effective screenshot after reset the size and position for the image:
Full codes:
using Spire.Xls;
namespace ReseSizeandPosition
{
    class Program
    {
        static void Main(string[] args)
        {
            Workbook workbook = new Workbook();
            Worksheet sheet = workbook.Worksheets[0];

            ExcelPicture picture = sheet.Pictures.Add(1, 1, "Logo.png");

            picture.Width = 75;
            picture.Height = 75;

            picture.Left = 200;
            picture.Top = 100;

            workbook.SaveToFile("Output.xlsx", FileFormat.Version2013);
        }
    }
}
Assign an Icon to a PDF Button Field and Set Icon Layout in C#
2017-06-02 07:50:05 Written by KoohjiIn PDF, buttons can be assigned icon appearances and each button can have as many as three appearances: Normal, Rollover, and Click. With Spire.PDF, not only can we assign icons to buttons, but also we can change the icons of buttons. In this article, we’re going to show you how to assign an icon to a button and set icon layout using Spire.PDF and C#. As for changing icons, please refer How to change the image on button field in C#.
Code Snippets:
Step 1: Create a PDF document and add a page to it.
PdfDocument doc = new PdfDocument();
PdfPageBase page = doc.Pages.Add();
Step 2: Create a button field.
PdfButtonField btn = new PdfButtonField(page, "button1");
btn.Bounds = new RectangleF(0, 50, 120, 100);
Step 3: Set button layout.
btn.HighlightMode = PdfHighlightMode.Push;
btn.LayoutMode = PdfButtonLayoutMode.CaptionOverlayIcon;
//Set text and icon for Normal appearance
btn.Text = "Normal Text";
btn.Icon = PdfImage.FromFile("Image.png");
//Set text and icon for Click appearance (Can only be set when highlight mode is Push)
btn.AlternateText = "Alternate Text";
btn.AlternateIcon = PdfImage.FromFile("Sunflower.jpg");
//Set text and icon for Rollover appearance (Can only be set when highlight mode is Push)
btn.RolloverText = "Rollover Text";
btn.RolloverIcon = PdfImage.FromFile("PinkRoses.jpg");
Step 4: Set icon layout.
btn.IconLayout.Spaces = new float[] { 0.5f, 0.5f };
btn.IconLayout.ScaleMode = PdfButtonIconScaleMode.Proportional;
btn.IconLayout.ScaleReason = PdfButtonIconScaleReason.Always;
btn.IconLayout.IsFitBounds = false;
Step 5: Add the button to the document.
doc.Form.Fields.Add(btn);
Step 6: Save the document.
doc.SaveToFile("AddIcon.pdf");
The resultant document looks as follows:
![]()
Full code:
using System.Drawing;
using Spire.Pdf;
using Spire.Pdf.Fields;
using Spire.Pdf.Graphics;

namespace Add_Icon_to_PDF_Button_Field
{
    class Program
    {
        static void Main(string[] args)
        {
            //Create a PDF document
            PdfDocument doc = new PdfDocument();
            PdfPageBase page = doc.Pages.Add();

            //Create a Button
            PdfButtonField btn = new PdfButtonField(page, "button1");
            btn.Bounds = new RectangleF(0, 50, 120, 100);
            btn.HighlightMode = PdfHighlightMode.Push;
            btn.LayoutMode = PdfButtonLayoutMode.CaptionOverlayIcon;
            //Set text and icon for Normal appearance
            btn.Text = "Normal Text";
            btn.Icon = PdfImage.FromFile("Image.png");
            //Set text and icon for Click appearance (Can only be set when highlight mode is Push)
            btn.AlternateText = "Alternate Text";
            btn.AlternateIcon = PdfImage.FromFile("Sunflower.jpg");
            //Set text and icon for Rollover appearance (Can only be set when highlight mode is Push)
            btn.RolloverText = "Rollover Text";
            btn.RolloverIcon = PdfImage.FromFile("PinkRoses.jpg");

            //Set icon layout
            btn.IconLayout.Spaces = new float[] { 0.5f, 0.5f };
            btn.IconLayout.ScaleMode = PdfButtonIconScaleMode.Proportional;
            btn.IconLayout.ScaleReason = PdfButtonIconScaleReason.Always;
            btn.IconLayout.IsFitBounds = false;

            //Add the button to the document
            doc.Form.Fields.Add(btn);

            //Save the document
            doc.SaveToFile("AddIcon.pdf");
        }
    }
}
