
Knowledgebase (2370)
Children categories
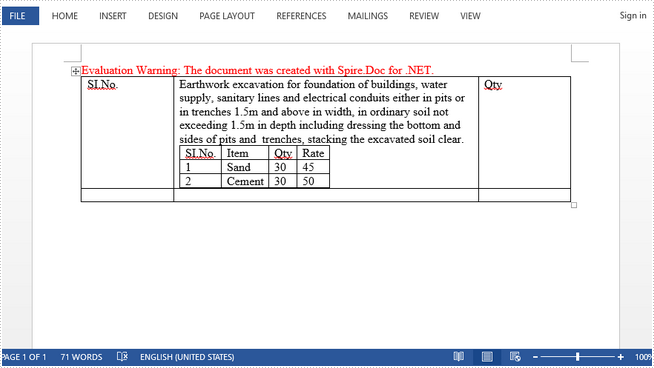
A nested table is one table placed inside of another, where the larger table functions as a container for the smaller one. Nested tables allow you to arrange different sets of data in groups to show clients.
This article presents how we can create a nested table using Spire.Doc in C#.
Step 1: Create a new PDF document and add a section to it.
Document doc = new Document();
Section section = doc.AddSection();
Step 2: Add a table to the section.
Table table = section.AddTable(true);
table.ResetCells(2, 3);
Step 3: Adjust the column with.
table.Rows[0].Cells[0].Width = table.Rows[0].Cells[2].Width = 50F;
table.Rows[1].Cells[0].Width = table.Rows[1].Cells[2].Width = 50F;
table.AutoFitBehavior(AutoFitBehaviorType.wdAutoFitWindow);
Step 4: Insert content to the cells of the table.
table[0, 0].AddParagraph().AppendText("SI.No.");
string text = "Earthwork excavation for foundation of buildings, water supply, "
             + "sanitary lines and electrical conduits either in pits or in "
             + "trenches 1.5m and above in width, in ordinary soil not exceeding "
             + "1.5m in depth including dressing the bottom and sides of pits and  "
             + "trenches, stacking the excavated soil clear.";
table[0, 1].AddParagraph().AppendText(text);
table[0, 2].AddParagraph().AppendText("Qty");
Step 5: Insert a nested table to the cell (first row, second column).
Table nestedTable= table[0, 1].AddTable(true);
nestedTable.ResetCells(3, 4);
nestedTable.AutoFitBehavior(AutoFitBehaviorType.wdAutoFitContents);
Step 6: Add content to nested cells.
nestedTable[0, 0].AddParagraph().AppendText("SI.No.");
nestedTable[0, 1].AddParagraph().AppendText("Item");
nestedTable[0, 2].AddParagraph().AppendText("Qty");
nestedTable[0, 3].AddParagraph().AppendText("Rate");
nestedTable[1, 0].AddParagraph().AppendText("1");
nestedTable[1, 1].AddParagraph().AppendText("Sand");
nestedTable[1, 2].AddParagraph().AppendText("30");
nestedTable[1, 3].AddParagraph().AppendText("45");
nestedTable[2, 0].AddParagraph().AppendText("2");
nestedTable[2, 1].AddParagraph().AppendText("Cement");
nestedTable[2, 2].AddParagraph().AppendText("30");
nestedTable[2, 3].AddParagraph().AppendText("50");
Step 7: Save the file.
doc.SaveToFile("Nested_Table.docx", FileFormat.Docx2013);
Output:
Full Code:
//create a new pdf document
Document doc = new Document();
Section section = doc.AddSection();

//add a table
Table table = section.AddTable(true);
table.ResetCells(2, 3);

//set column width
table.Rows[0].Cells[0].SetCellWidth(50F,CellWidthType.Point);
table.Rows[0].Cells[2].SetCellWidth(50F, CellWidthType.Point);
table.Rows[1].Cells[0].SetCellWidth(50F, CellWidthType.Point);
table.Rows[1].Cells[2].SetCellWidth(50F, CellWidthType.Point);
table.AutoFit(AutoFitBehaviorType.AutoFitToWindow);
nestedTable.AutoFit(AutoFitBehaviorType.AutoFitToContents);

//insert content to cells
table[0, 0].AddParagraph().AppendText("SI.No.");
string text = "Earthwork excavation for foundation of buildings, water supply, "
             + "sanitary lines and electrical conduits either in pits or in "
             + "trenches 1.5m and above in width, in ordinary soil not exceeding "
             + "1.5m in depth including dressing the bottom and sides of pits and  "
             + "trenches, stacking the excavated soil clear.";
table[0, 1].AddParagraph().AppendText(text);
table[0, 2].AddParagraph().AppendText("Qty");

//add a nested table to cell(first row, second column)
Table nestedTable= table[0, 1].AddTable(true);
nestedTable.ResetCells(3, 4);
nestedTable.AutoFitBehavior(AutoFitBehaviorType.wdAutoFitContents);

//add content to nested cells
nestedTable[0, 0].AddParagraph().AppendText("SI.No.");
nestedTable[0, 1].AddParagraph().AppendText("Item");
nestedTable[0, 2].AddParagraph().AppendText("Qty");
nestedTable[0, 3].AddParagraph().AppendText("Rate");
nestedTable[1, 0].AddParagraph().AppendText("1");
nestedTable[1, 1].AddParagraph().AppendText("Sand");
nestedTable[1, 2].AddParagraph().AppendText("30");
nestedTable[1, 3].AddParagraph().AppendText("45");
nestedTable[2, 0].AddParagraph().AppendText("2");
nestedTable[2, 1].AddParagraph().AppendText("Cement");
nestedTable[2, 2].AddParagraph().AppendText("30");
nestedTable[2, 3].AddParagraph().AppendText("50");

//save
doc.SaveToFile("Nested_Table.docx", FileFormat.Docx2013);
Spire.PDF allows extracting images from signatures using ExtractSignatureAsImages method in PdfFormWidget class. This article demonstrates how we can use Spire.PDF to implement this feature.
Code Snippet:
Step 1: Instantiate an object of PdfDocument class and load the PDF document.
PdfDocument document = new PdfDocument("sample.pdf");
Step 2: Get the existing forms of the document.
PdfFormWidget form = document.Form as PdfFormWidget;
Step 3: Extract images from signatures in the existing forms and put them into an Image Array.
Image[] images = form.ExtractSignatureAsImages();
Step 4: Save the images to disk.
int i = 0;
for (int j = 0; j < images.Length; j++)
{
    images[j].Save(String.Format(@"Image/Image-{0}.png", i), ImageFormat.Png);
    i++;
}
Screenshot:
Full code:
using Spire.Pdf;
using Spire.Pdf.Widget;
using System;
using System.Drawing;
using System.Drawing.Imaging;


namespace ExtractImage
{
    class Program
    {
        static void Main(string[] args)
        {
            //Load the PDF document
            PdfDocument document = new PdfDocument("sample.pdf");

            //Get the existing forms of the document
            PdfFormWidget form = document.Form as PdfFormWidget;

            //Extract images from signatures in the existing forms
            Image[] images = form.ExtractSignatureAsImages();

            //Save the images to disk
            int i = 0;
            for (int j = 0; j < images.Length; j++)
            {
                images[j].Save(String.Format(@"Image/Image-{0}.png", i), ImageFormat.Png);
                i++;
            }

            //Close the document
            document.Close();
        }
    }
}
Imports Spire.Pdf
Imports Spire.Pdf.Widget
Imports System.Drawing
Imports System.Drawing.Imaging


Namespace ExtractImage
	Class Program
		Private Shared Sub Main(args As String())
			'Load the PDF document
			Dim document As New PdfDocument("sample.pdf")

			'Get the existing forms of the document
			Dim form As PdfFormWidget = TryCast(document.Form, PdfFormWidget)

			'Extract images from signatures in the existing forms
			Dim images As Image() = form.ExtractSignatureAsImages()

			'Save the images to disk
			Dim i As Integer = 0
			For j As Integer = 0 To images.Length - 1
				images(j).Save([String].Format("Image/Image-{0}.png", i), ImageFormat.Png)
				i += 1
			Next

			'Close the document
			document.Close()
		End Sub
	End Class
End Namespace
The default background of a Word document is white, and in the vast majority of cases, a simple white background is sufficient. However, if you are creating a resume, a broacher or other creative document that needs to be eye-catching, setting a unique background color or image may also be essential. This article will demonstrate how to programmatically add a background color or image to a Word document using Spire.Doc for .NET.
- Add a Background Color to a Word Document
- Add a Gradient Background to a Word Document
- Insert a Background Image to a Word Document
Install Spire.Doc for .NET
To begin with, you need to add the DLL files included in the Spire.Doc for.NET package as references in your .NET project. The DLL files can be either downloaded from this link or installed via NuGet.
PM> Install-Package Spire.Doc
Add a Background Color to a Word Document
Adding a background color to a Word document is quite simple. You just need to set the background type as color and then choose a color as the background. The detailed steps are as follows.
- Create a Document instance.
- Load a sample Word document using Document.LoadFromFile() method.
- Set the background type as color using Document.Background.Type property.
- Set a background color for the document using Document.Background.Color property.
- Save the result document using Document.SaveToFile() method.
- C#
- VB.NET
using Spire.Doc;
using System.Drawing;
using Spire.Doc.Documents;

namespace ConvertWordToPng
{
    class Program
    {
        static void Main(string[] args)
        {
            //Create a Document instance
            Document document = new Document();

            //Load a sample Word document
            document.LoadFromFile("Test.docx");

            //Set the background type as color
            document.Background.Type = BackgroundType.Color;

            //Set the background color
            document.Background.Color = Color.AliceBlue;

            //Save the document
            document.SaveToFile("PureColorBackground.docx", FileFormat.Docx);
        }
    }
}

Add a Gradient Background to a Word Document
Adding gradient background requires more steps. You need to set the background type as gradient, choose two colors, and then set shading variant and style. The detailed steps are as follows.
- Create a Document instance.
- Load a sample Word document using Document.LoadFromFile() method.
- Set the background type as gradient using Document.Background.Type property.
- Get the background gradient using Document.Background.Gradient property.
- Select two colors using BackgroundGradient.Color1 and BackgroundGradient.Color2 properties.
- Set shading variant and style for the gradient using BackgroundGradient.ShadingVariant and BackgroundGradient. ShadingStyle properties.
- Save the result document using Document.SaveToFile() method.
- C#
- VB.NET
using Spire.Doc;
using System.Drawing;
using Spire.Doc.Documents;

namespace ConvertWordToPng
{
    class Program
    {
        static void Main(string[] args)
        {
            //Create a Document instance
            Document document = new Document();

            //Load a sample Word document
            document.LoadFromFile("Test.docx");

            //Set the background type as gradient
            document.Background.Type = BackgroundType.Gradient;

            //Get the background gradient
            BackgroundGradient gradient = document.Background.Gradient;

            //Select two colors
            gradient.Color1 = Color.White;
            gradient.Color2 = Color.LightBlue;

            //Set shading variant and style for the gradient
            gradient.ShadingVariant = GradientShadingVariant.ShadingDown;
            gradient.ShadingStyle = GradientShadingStyle.Horizontal;

            //Save the document
            document.SaveToFile("AddGradientBackground.docx", FileFormat.Docx);

        }
    }
}

Insert a Background Image to a Word Document
To insert a background image to a Word document, you need to set the background type as picture, and then insert a picture as the background. The detailed steps are as follows.
- Create a Document instance.
- Load a sample Word document using Document.LoadFromFile() method.
- Set the background type as picture using Document.Background.Type property.
- Set a background picture for the document using Document.Background.Picture property.
- Save the result document using Document.SaveToFile() method.
- C#
- VB.NET
using Spire.Doc;
using Spire.Doc.Documents;
using System.Drawing;
namespace SetImageBackground
{
    class Program
    {
        static void Main(string[] args)
        {
            {
                //Create a Document instance
                Document document = new Document();

                //Load a sample Word document
                document.LoadFromFile("Test.docx");

                //Set the background type as picture
                document.Background.Type = BackgroundType.Picture;

                //Set background picture
                document.Background.Picture = Image.FromFile("background.jpg");

                //Save the document
                document.SaveToFile("AddBackgroundPicture.docx", FileFormat.Docx);
            }

        }
    }
}

Apply for a Temporary License
If you'd like to remove the evaluation message from the generated documents, or to get rid of the function limitations, please request a 30-day trial license for yourself.
