Knowledgebase (2370)
Children categories
Sending bulk emails means that you can send a batch of emails to multiple recipients and they will not be able to determine the others you've sent the message to.
The following code snippets demonstrate how to send bulk emails using Spire.Email in C# and VB.NET.
Step 1: Create instances of MailMessage class and specify sender and recipients.
MailMessage message1 = new MailMessage("sender@e-iceblue.com", "recipient1@e-iceblue.com");
MailMessage message2 = new MailMessage("sender@e-iceblue.com", " recipient2@e-iceblue.com");
MailMessage message3 = new MailMessage("sender@e-iceblue.com", " recipient3@e-iceblue.com");
Step 2: Set the subject and body text of the messages.
message1.Subject = message2.Subject = message3.Subject = "Subject";
message1.BodyText = message2.BodyText = message3.BodyText = "This is body text.";
Step 3: Initialize an object of MailMessageCollection class and add the instances of MailMessage class into the object.
List msgs = new List();
msgs.Add(message1);
msgs.Add(message2);
msgs.Add(message3);
Step 4: Create a SmtpClient instance with host, port, username and password, and send batch of emails using SendSome method.
SmtpClient client = new SmtpClient();
client.Host = "smtp.outlook.com";
client.Port = 587;
client.Username = "sender@e-iceblue.com";
client.Password = "password";
client.ConnectionProtocols = ConnectionProtocols.Ssl;
client.SendSome(msgs);
Console.WriteLine("Message sent");
Full Code:
MailMessage message1 = new MailMessage("sender@e-iceblue.com", "recipient1@e-iceblue.com");
MailMessage message2 = new MailMessage("sender@e-iceblue.com", " recipient2@e-iceblue.com");
MailMessage message3 = new MailMessage("sender@e-iceblue.com", " recipient3@e-iceblue.com");
message1.Subject = message2.Subject = message3.Subject = "subject";
message1.BodyText = message2.BodyText = message3.BodyText = "This is body text.";

List msgs = new List();
msgs.Add(message1);
msgs.Add(message2);
msgs.Add(message3);

SmtpClient client = new SmtpClient();
client.Host = "smtp.outlook.com";
client.Port = 587;
client.Username = "sender@e-iceblue.com";
client.Password = "password";
client.ConnectionProtocols = ConnectionProtocols.Ssl;
client.SendSome(msgs);
Console.WriteLine("Message sent");
Dim message1 As New MailMessage("sender@e-iceblue.com", "recipient1@e-iceblue.com")
Dim message2 As New MailMessage("sender@e-iceblue.com", " recipient2@e-iceblue.com")
Dim message3 As New MailMessage("sender@e-iceblue.com", " recipient3@e-iceblue.com")
message1.Subject = InlineAssignHelper(message2.Subject, InlineAssignHelper(message3.Subject, "subject"))
message1.BodyText = InlineAssignHelper(message2.BodyText, InlineAssignHelper(message3.BodyText, "This is body text."))

Dim msgs As New List(Of MailMessage)()
msgs.Add(message1)
msgs.Add(message2)
msgs.Add(message3)

Dim client As New SmtpClient()
client.Host = "smtp.outlook.com"
client.Port = 587
client.Username = "sender@e-iceblue.com"
client.Password = "password"
client.ConnectionProtocols = ConnectionProtocols.Ssl
client.SendSome(msgs)
Console.WriteLine("Message sent")
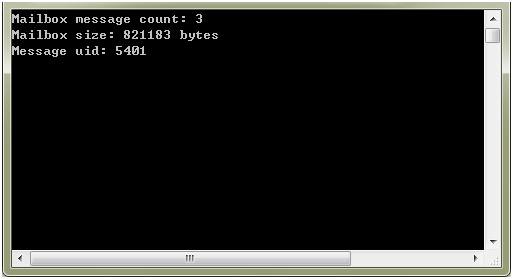
This article illustrates how to get mailbox information such as the number of messages, the size of mailbox and the unique id of a specific message using Spire.Email component.
Detail steps:
Step 1: Create a pop3 client.
Pop3Client pop = new Pop3Client();
Step 2: Set host, authentication, port and connection protocol.
pop.Host = "outlook.office365.com";
pop.Username = "LeonDavisLD@outlook.com";
pop.Password = "password";
pop.Port = 995;
pop.EnableSsl = true;
Step 3: Connect the pop server.
pop.Connect();
Step 4: Get information of mailbox.
//Get the number of messages
Console.WriteLine("Mailbox message count: " + pop.GetMessageCount());

//Get the size of mailbox
Console.WriteLine("Mailbox size: " + pop.GetSize() + " bytes");

//Get the unique id of the first message
Console.WriteLine("Message uid: " + pop.GetMessagesUid(1));
Screenshot:
Full code:
using System;
using Spire.Email.Pop3;

namespace Get_mailbox_information
{
    class Program
    {
        static void Main(string[] args)
        {
            //Create a pop3 client
            using (Pop3Client pop = new Pop3Client())
            {
                //Set host, authentication, port and connection protocol
                pop.Host = "outlook.office365.com";
                pop.Username = "LeonDavisLD@outlook.com";
                pop.Password = "password";
                pop.Port = 995;
                pop.EnableSsl = true;

                //Connect the pop server
                pop.Connect();

                //Get the number of messages
                Console.WriteLine("Mailbox message count: " + pop.GetMessageCount());

                //Get the size of mailbox
                Console.WriteLine("Mailbox size: " + pop.GetSize() + " bytes");

                //Get the unique id of the first message
                Console.WriteLine("Message uid: " + pop.GetMessagesUid(1));
            }
        }
    }
}
Imports Spire.Email.Pop3

Namespace Get_mailbox_information
	Class Program
		Private Shared Sub Main(args As String())
			'Create a pop3 client
			Using pop As New Pop3Client()
				'Set host, authentication, port and connection protocol
				pop.Host = "outlook.office365.com"
				pop.Username = "LeonDavisLD@outlook.com"
				pop.Password = "password"
				pop.Port = 995
				pop.EnableSsl = True

				'Connect the pop server
				pop.Connect()

				'Get the number of messages
				Console.WriteLine("Mailbox message count: " + pop.GetMessageCount())

				'Get the size of mailbox
				Console.WriteLine("Mailbox size: " + pop.GetSize() + " bytes")

				'Get the unique id of the first message
				Console.WriteLine("Message uid: " + pop.GetMessagesUid(1))
			End Using
		End Sub
	End Class
End Namespace
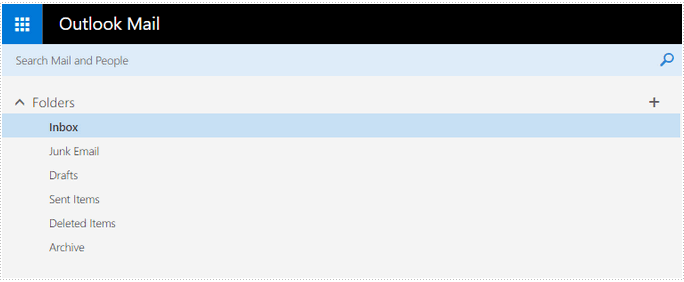
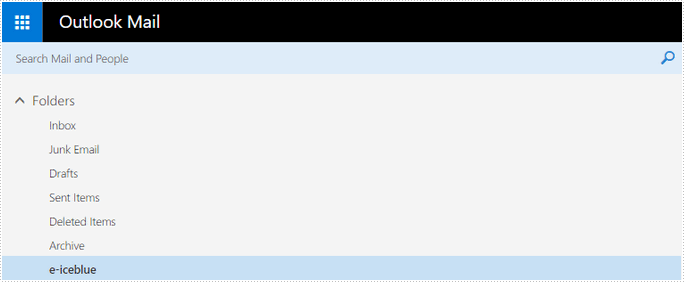
Following code snippets demonstrate how to create, rename and delete a folder on mail server by using ImapClient class in Spire.Email.
Create a mail folder
using Spire.Email;
using Spire.Email.IMap;
using System;


namespace CreateMailFolder
{
    class Program
    {
        static void Main(string[] args)
        {
            //create an imapclient with username, password and host
            ImapClient client = new ImapClient();
            client.Username = "test@outlook.com";
            client.Password = "password";
            client.Host = "outlook.office365.com";
            //specify the port
            client.Port = 143;
            //specify the connection protocol
            client.ConnectionProtocols = ConnectionProtocols.Ssl;
            //connect to imap mail server
            client.Connect();
            //create a folder named ‘e-iceblue’
            client.CreateFolder("e-iceblue");
            Console.WriteLine("Done!");
        }
    }
}
Rename a mail folder
using Spire.Email;
using Spire.Email.IMap;
using System;

namespace RenameMailFolder
{
    class Program
    {
        static void Main(string[] args)
        {
            //create an imapclient with username, password and host
            ImapClient client = new ImapClient();
            client.Username = "test@outlook.com";
            client.Password = "password";
            client.Host = "outlook.office365.com";
            //specify the port
            client.Port = 143;
            //specify the connection protocol
            client.ConnectionProtocols = ConnectionProtocols.Ssl;
            //connect to imap mail server
            client.Connect();
            //rename an existing folder with a new name
            client.RenameFolder("e-iceblue", "E-ICEBLUE");
            Console.WriteLine("Done!");
        }
    }

Delete a mail folder
using Spire.Email;
using Spire.Email.IMap;
using System;

namespace DeleteMailFolder
{
    class Program
    {
        static void Main(string[] args)
        {
            //create an imapclient with username, password and host
            ImapClient client = new ImapClient();
            client.Username = "test@outlook.com";
            client.Password = "password";
            client.Host = "outlook.office365.com";
            //specify the port
            client.Port = 143;
            //specify the connection protocol
            client.ConnectionProtocols = ConnectionProtocols.Ssl;
            //connect to imap mail server
            client.Connect();
            //delete an existing folder
            client.DeleteFolder("E-ICEBLUE");
            Console.WriteLine("Done!");
        }
    }
}