
Knowledgebase (2370)
Children categories
Copy, Remove, and Lock Headers and Footers in Word with JavaScript in React
2026-07-06 08:33:20 Written by Amy ZhaoIn real-world document development workflows, maintaining headers and footers is just as important as adding them — copying headers and footers from a template document for quick reuse, removing old headers and footers for document cleanup, and locking headers to prevent content tampering are all common daily requirements. Spire.Doc for JavaScript leverages WebAssembly to process Word documents directly in the browser, managing fonts and file resources through a virtual file system (VFS) with no backend server required.
This article covers three core features:
For installation and project setup, refer to Integrating Spire.Doc for JavaScript in a React Project. The examples below assume Spire.Doc is installed and the WebAssembly module is initialized.
Copy Headers and Footers
In enterprise document production, a standard template document typically defines unified headers (company logo + document title) and footers (page number + copyright notice). When creating new documents, the headers and footers from the template need to be copied over to maintain consistent corporate document styling. Spire.Doc uses the ChildObjects collection and the Clone method to copy header objects across documents. The core workflow has three phases: first, load font files and two Word files (source and destination documents) into the WASM virtual file system via FetchFileToVFS; then instantiate two Document objects, retrieve the header's child objects from the source document, iterate and clone them into each section's header of the destination document; finally, save the destination document, read the generated file from VFS, wrap it as a Blob, and trigger a browser download.
function App() {
  const CopyHeaderAndFooter = async () => {
    // Get the Spire.Doc WASM module
    const wasmModule = window.wasmModule?.spiredoc;

    // Check if the module is ready
    if (!wasmModule) {
      alert('Spire.Doc is not ready yet');
      return;
    }

    // Load fonts and the document files into VFS
    await window.spire.FetchFileToVFS('ARIALUNI.TTF', '/Library/Fonts/', `${process.env.PUBLIC_URL}/font/`);

    // Load the source and destination files into VFS
    let inputFileName = "HeaderAndFooter.docx";
    await window.spire.FetchFileToVFS(inputFileName, "", `${process.env.PUBLIC_URL}/data/`);
    const inputFileName_1 = "Template.docx";
    await window.spire.FetchFileToVFS(inputFileName_1, "", `${process.env.PUBLIC_URL}/data/`);

    // Load the source document
    let doc1 = new wasmModule.Document();
    doc1.LoadFromFile(inputFileName);

    // Get the header from the source document
    let header = doc1.Sections.get_Item(0).HeadersFooters.Header;

    // Load the destination document
    let doc2 = new wasmModule.Document();
    doc2.LoadFromFile(inputFileName_1);

    // Clone each child object from the source header into all sections of the destination document
    for (let i = 0; i < doc2.Sections.Count; i++) {
      let section = doc2.Sections.get_Item(i);
      for (let j = 0; j < header.ChildObjects.Count; j++) {
        let obj = header.ChildObjects.get_Item(j);
        section.HeadersFooters.Header.ChildObjects.Add(obj.Clone());
      }
    }

    // Define the output file name
    const outputFileName = "CopyHeaderAndFooter_output.docx";

    // Save the document
    doc2.SaveToFile({ fileName: outputFileName, fileFormat: wasmModule.FileFormat.Docx2013 });

    // Release resources
    doc1.Close();
    doc2.Close();
    doc1.Dispose();
    doc2.Dispose();

    // Read the generated file from VFS and trigger download
    const modifiedFileArray = window.dotnetRuntime.Module.FS.readFile(outputFileName);
    const blob = new Blob([modifiedFileArray], { type: 'application/vnd.openxmlformats-officedocument.wordprocessingml.document'});
    const url = URL.createObjectURL(blob);
    const a = document.createElement('a');
    a.href = url;
    a.download = outputFileName;
    a.click();
    URL.revokeObjectURL(url);
  };

  return (
    <div style={{ textAlign: 'center', height: '300px' }}>
      <h1>Copy Headers And Footers To Another Word Document</h1>
      <button onClick={CopyHeaderAndFooter}>
        Generate
      </button>
    </div>
  );
}

export default App;
The code above clones the header content from the source document into all sections of the destination document.

Remove Headers and Footers
In document cleanup or template replacement scenarios, it is often necessary to remove existing headers or footers from a document. For example, when taking over someone else's document and needing to redesign the headers and footers, clearing the original content first; or when documents exported from a customer system contain default headers that need to be removed before replacing with corporate templates. Spire.Doc uses HeadersFooters.get_Item to retrieve header or footer objects by type (first page, odd page, even page), and then calls ChildObjects.Clear() to remove all their content.
function App() {
  const RemoveHeaderFooter = async () => {
    // Get the Spire.Doc WASM module
    const wasmModule = window.wasmModule?.spiredoc;

    // Check if the module is ready
    if (!wasmModule) {
      alert('Spire.Doc is not ready yet');
      return;
    }

    // Load fonts and the document file into VFS
    await window.spire.FetchFileToVFS('ARIALUNI.TTF', '/Library/Fonts/', `${process.env.PUBLIC_URL}/font/`);

    // Load the sample file into VFS
    let inputFileName = "HeaderAndFooter.docx";
    await window.spire.FetchFileToVFS(inputFileName, "", `${process.env.PUBLIC_URL}/data/`);

    // Load the document
    let doc = new wasmModule.Document();
    doc.LoadFromFile(inputFileName);

    // Get the first section
    let section = doc.Sections.get_Item(0);

    // Clear all types of header content (first page, odd page, even page)
    let header;
    header = section.HeadersFooters.get_Item({ hfType: wasmModule.HeaderFooterType.HeaderFirstPage });
    if (header != null)
      header.ChildObjects.Clear();

    header = section.HeadersFooters.get_Item({ hfType: wasmModule.HeaderFooterType.HeaderOdd });
    if (header != null)
      header.ChildObjects.Clear();

    header = section.HeadersFooters.get_Item({ hfType: wasmModule.HeaderFooterType.HeaderEven });
    if (header != null)
      header.ChildObjects.Clear();

    // Clear all types of footer content (first page, odd page, even page)
    let footer;
    footer = section.HeadersFooters.get_Item({ hfType: wasmModule.HeaderFooterType.FooterFirstPage });
    if (footer != null)
      footer.ChildObjects.Clear();

    footer = section.HeadersFooters.get_Item({ hfType: wasmModule.HeaderFooterType.FooterOdd });
    if (footer != null)
      footer.ChildObjects.Clear();

    footer = section.HeadersFooters.get_Item({ hfType: wasmModule.HeaderFooterType.FooterEven });
    if (footer != null)
      footer.ChildObjects.Clear();

    // Define the output file name
    const outputFileName = "RemoveHeaderFooter_output.docx";

    // Save the document
    doc.SaveToFile({ fileName: outputFileName, fileFormat: wasmModule.FileFormat.Docx2013 });

    // Release resources
    doc.Close();
    doc.Dispose();

    // Read the generated file from VFS and trigger download
    const modifiedFileArray = window.dotnetRuntime.Module.FS.readFile(outputFileName);
    const blob = new Blob([modifiedFileArray], { type: 'application/vnd.openxmlformats-officedocument.wordprocessingml.document'});
    const url = URL.createObjectURL(blob);
    const a = document.createElement('a');
    a.href = url;
    a.download = outputFileName;
    a.click();
    URL.revokeObjectURL(url);
  };

  return (
    <div style={{ textAlign: 'center', height: '300px' }}>
      <h1>Remove Headers And Footers From Word Document</h1>
      <button onClick={RemoveHeaderFooter}>
        Generate
      </button>
    </div>
  );
}

export default App;
The document after removing the header.

Lock Headers to Prevent Editing
When distributing documents to clients or team members, it is often desirable to prevent fixed information such as the company logo and document number in the header from being modified, while allowing the body text to remain editable. Spire.Doc achieves this through document protection: set the protection type to AllowOnlyFormFields, then set the section's ProtectForm property to false, so the body area stays editable while the header area is protected from modification.
function App() {
  const LockHeader = async () => {
    // Get the Spire.Doc WASM module
    const wasmModule = window.wasmModule?.spiredoc;

    // Check if the module is ready
    if (!wasmModule) {
      alert('Spire.Doc is not ready yet');
      return;
    }

    // Load fonts and the document file into VFS
    await window.spire.FetchFileToVFS('ARIALUNI.TTF', '/Library/Fonts/', `${process.env.PUBLIC_URL}/font/`);

    // Load the sample file into VFS
    let inputFileName = "HeaderAndFooter.docx";
    await window.spire.FetchFileToVFS(inputFileName, "", `${process.env.PUBLIC_URL}/data/`);

      // Load the document
    let doc = new wasmModule.Document();
    doc.LoadFromFile(inputFileName);

    // Get the first section
    let section = doc.Sections.get_Item(0);

    // Protect the document with AllowOnlyFormFields type
    doc.Protect({ type: wasmModule.ProtectionType.AllowOnlyFormFields, password: "123" });

    // Set the section as editable, so the body area is not locked
    section.ProtectForm = false;

    // Define the output file name
    const outputFileName = "LockHeader_output.docx";

    // Save the document
    doc.SaveToFile({ fileName: outputFileName, fileFormat: wasmModule.FileFormat.Docx2013 });

    // Release resources
    doc.Close();
    doc.Dispose();

    // Read the generated file from VFS and trigger download
    const modifiedFileArray = window.dotnetRuntime.Module.FS.readFile(outputFileName);
    const blob = new Blob([modifiedFileArray], { type: 'application/vnd.openxmlformats-officedocument.wordprocessingml.document'});
    const url = URL.createObjectURL(blob);
    const a = document.createElement('a');
    a.href = url;
    a.download = outputFileName;
    a.click();
    URL.revokeObjectURL(url);
  };

  return (
    <div style={{ textAlign: 'center', height: '300px' }}>
      <h1>Lock Header In Word Document</h1>
      <button onClick={LockHeader}>
        Generate
      </button>
    </div>
  );
}

export default App;
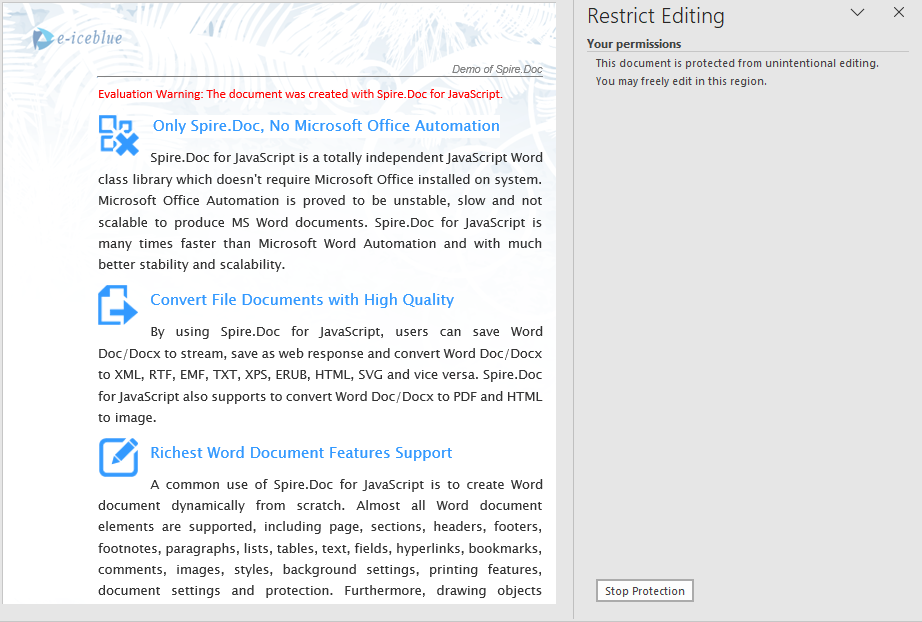
When the header is locked, the header area cannot be edited when opening the document in Word, while the body area remains modifiable.
FAQ
Copied header content does not display in the destination document
Cause: The destination document contains multiple sections, but the copy operation only processes the first section's header, leaving headers in other sections unchanged.
Solution: Iterate through all sections of the destination document and copy the source header content to each section:
for (let i = 0; i < doc2.Sections.Count; i++) {
  let section = doc2.Sections.get_Item(i);
  for (let j = 0; j < header.ChildObjects.Count; j++) {
    let obj = header.ChildObjects.get_Item(j);
    section.HeadersFooters.Header.ChildObjects.Add(obj.Clone());
  }
}
The entire document becomes uneditable after locking the header
Cause: doc.Protect({ type: AllowOnlyFormFields }) locks the entire document by default, including the body area.
Solution: After applying protection, set the section's ProtectForm property to false to keep the body area editable:
doc.Protect({ type: wasmModule.ProtectionType.AllowOnlyFormFields, password: "123" });
section.ProtectForm = false;
Footer content is also cleared when removing headers
Cause: The header removal logic is mistakenly applied to the footer, or the same ChildObjects.Clear() operation is used on the wrong object.
Solution: Use different HeaderFooterType parameters for removing headers versus removing footers, ensuring the correct object is targeted:
// Use Header type when removing headers
section.HeadersFooters.get_Item({ hfType: wasmModule.HeaderFooterType.HeaderFirstPage });
// Use Footer type when removing footers
section.HeadersFooters.get_Item({ hfType: wasmModule.HeaderFooterType.FooterFirstPage });
Get a Free License
If you wish to remove the evaluation message from the resulting document, or to eliminate functional limitations, please contact our sales team to request a 30-day temporary license.
Add or Delete Rows and Columns in Word Table with JavaScript in React
2026-07-06 08:30:30 Written by Amy ZhaoIn real-world document development, table structures often need to be adjusted dynamically — adding rows when report data counts are uncertain, inserting or removing columns when fields change, or deleting redundant data rows with a single click. Spire.Doc for JavaScript leverages WebAssembly to edit Word documents directly in the browser, managing fonts and file resources through a virtual file system (VFS) with no backend server required.
This article covers two core features:
For installation and project setup, refer to Integrating Spire.Doc for JavaScript in a React Project. The examples below assume Spire.Doc is installed and the WebAssembly module is initialized.
Add and Delete Rows
In report generation and data display scenarios, the number of table rows is often dynamic. Spire.Doc provides the Rows.RemoveAt method to delete a specific row, the Rows.Insert method to insert a new row at a specified position, and the AddRow method to append a row at the end of the table. The core workflow has three phases: first, load font files and the target Word document into the WASM virtual file system via FetchFileToVFS; then instantiate a Document, load the file, retrieve the target table, and call row/column manipulation methods; finally, save the document, read the generated file from VFS, wrap it as a Blob, and trigger a browser download.
function App() {
  const AddOrDeleteRow = async () => {
    // Get the Spire.Doc WASM module
    const wasmModule = window.wasmModule?.spiredoc;

    // Check if the module is ready
    if (!wasmModule) {
      alert('Spire.Doc is not ready yet');
      return;
    }

    // Load fonts and the document file into VFS
    await window.spire.FetchFileToVFS('ARIALUNI.TTF', '/Library/Fonts/', `${process.env.PUBLIC_URL}/font/`);

    // Load the sample Word file into VFS
    let inputFileName = "TableSample.docx";
    await window.spire.FetchFileToVFS(inputFileName, "", `${process.env.PUBLIC_URL}/data/`);

    // Load the document
    let doc = new wasmModule.Document();
    doc.LoadFromFile(inputFileName);
    let section = doc.Sections.get_Item(0);
    let table = section.Tables.get_Item(0);

    // Delete row 8
    table.Rows.RemoveAt(7);

    // Create a new row and insert it at a specified position (after row 2)
    let row = new wasmModule.TableRow(doc);
    for (let i = 0; i < table.Rows.get_Item(0).Cells.Count; i++) {
      let tc = row.AddCell();
      let paragraph = tc.AddParagraph();
      paragraph.Format.HorizontalAlignment = wasmModule.HorizontalAlignment.Center;
      paragraph.AppendText("Added");
    }
    table.Rows.Insert(2, row);

    // Append a row at the end of the table
    table.AddRow();

    // Define the output file name
    const outputFileName = "AddOrDeleteRow_output.docx";

    // Save the document
    doc.SaveToFile({ fileName: outputFileName, fileFormat: wasmModule.FileFormat.Docx2013 });

    // Release resources
    doc.Close();
    doc.Dispose();

    // Read the generated file from VFS and trigger download
    const modifiedFileArray = window.dotnetRuntime.Module.FS.readFile(outputFileName);
    const blob = new Blob([modifiedFileArray], { type: 'application/vnd.openxmlformats-officedocument.wordprocessingml.document'});
    const url = URL.createObjectURL(blob);
    const a = document.createElement('a');
    a.href = url;
    a.download = outputFileName;
    a.click();
    URL.revokeObjectURL(url);
  };

  return (
    <div style={{ textAlign: 'center', height: '300px' }}>
      <h1>Add And Delete Rows In Word Table</h1>
      <button onClick={AddOrDeleteRow}>
        Generate
      </button>
    </div>
  );
}

export default App;
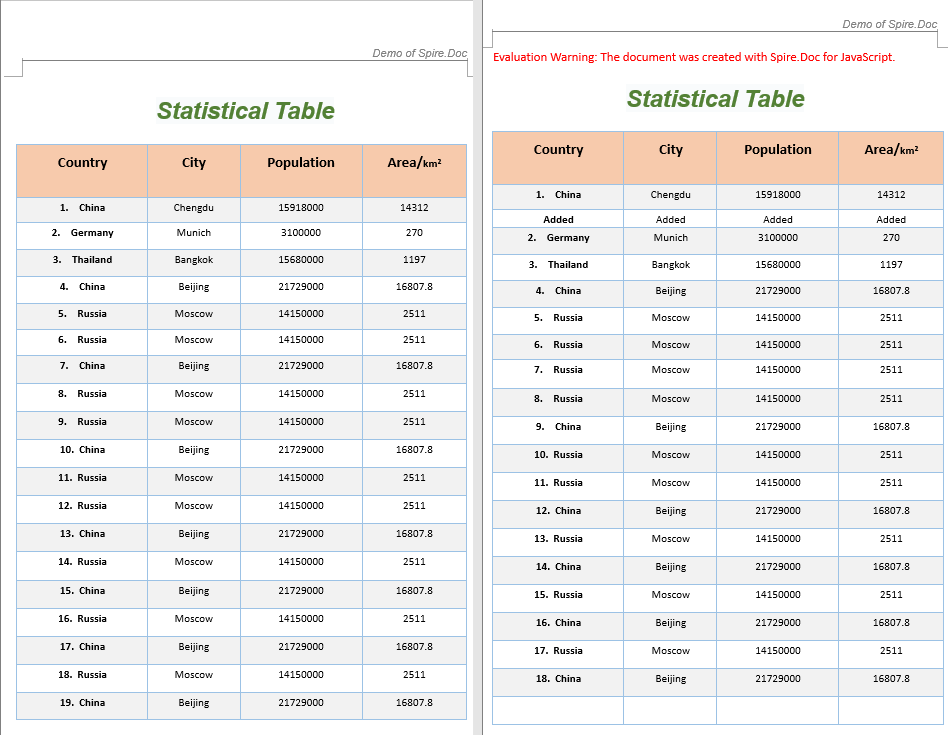
The code above performs three row operations on an existing table: deleting row 8, inserting a new row containing "Added" text after row 2, and appending an empty row at the end of the table.
Add and Remove Columns
In table structure adjustment scenarios, it is often necessary to add new field columns or remove redundant ones. Since Spire.Doc's table column operations are implemented by manipulating cells row by row, custom AddColumn and RemoveColumn helper functions are needed: to add a column, iterate through each row and insert a new blank cell at the specified index; to remove a column, iterate through each row and delete the cell at the specified index.
function AddColumn(table, columnIndex) {
  let wasmModule = window.wasmModule.spiredoc;
  for (let r = 0; r < table.Rows.Count; r++) {
    let addCell = new wasmModule.TableCell(table.Document);
    table.Rows.get_Item(r).Cells.Insert(columnIndex, addCell);
  }
}

function RemoveColumn(table, columnIndex) {
  for (let r = 0; r < table.Rows.Count; r++) {
    table.Rows.get_Item(r).Cells.RemoveAt(columnIndex);
  }
}

function App() {
  const AddOrRemoveColumn = async () => {
    // Get the Spire.Doc WASM module
    const wasmModule = window.wasmModule?.spiredoc;

    // Check if the module is ready
    if (!wasmModule) {
      alert('Spire.Doc is not ready yet');
      return;
    }

    // Load fonts and the document file into VFS
    await window.spire.FetchFileToVFS('ARIALUNI.TTF', '/Library/Fonts/', `${process.env.PUBLIC_URL}/font/`);

    // Load the sample file into VFS
    let inputFileName = "TableSample.docx";
    await window.spire.FetchFileToVFS(inputFileName, "", `${process.env.PUBLIC_URL}/data/`);

    // Load the document
    let doc = new wasmModule.Document();
    doc.LoadFromFile(inputFileName);

    // Get the first section and first table
    let section = doc.Sections.get_Item(0);
    let table = section.Tables.get_Item(0);

    // Insert a blank column before column 0
    let columnIndex1 = 0;
    AddColumn(table, columnIndex1);

    // Delete column 2
    let columnIndex2 = 2;
    RemoveColumn(table, columnIndex2);

    // Define the output file name
    const outputFileName = "AddOrRemoveColumn_output.docx";

    // Save the document
    doc.SaveToFile({ fileName: outputFileName, fileFormat: wasmModule.FileFormat.Docx2013 });

    // Release resources
    doc.Close();
    doc.Dispose();

    // Read the generated file from VFS and trigger download
    const modifiedFileArray = window.dotnetRuntime.Module.FS.readFile(outputFileName);
    const blob = new Blob([modifiedFileArray], { type: 'application/vnd.openxmlformats-officedocument.wordprocessingml.document'});
    const url = URL.createObjectURL(blob);
    const a = document.createElement('a');
    a.href = url;
    a.download = outputFileName;
    a.click();
    URL.revokeObjectURL(url);
  };

  return (
    <div style={{ textAlign: 'center', height: '300px' }}>
      <h1>Add And Remove Columns In Word Table</h1>
      <button onClick={AddOrRemoveColumn}>
        Generate
      </button>
    </div>
  );
}

export default App;
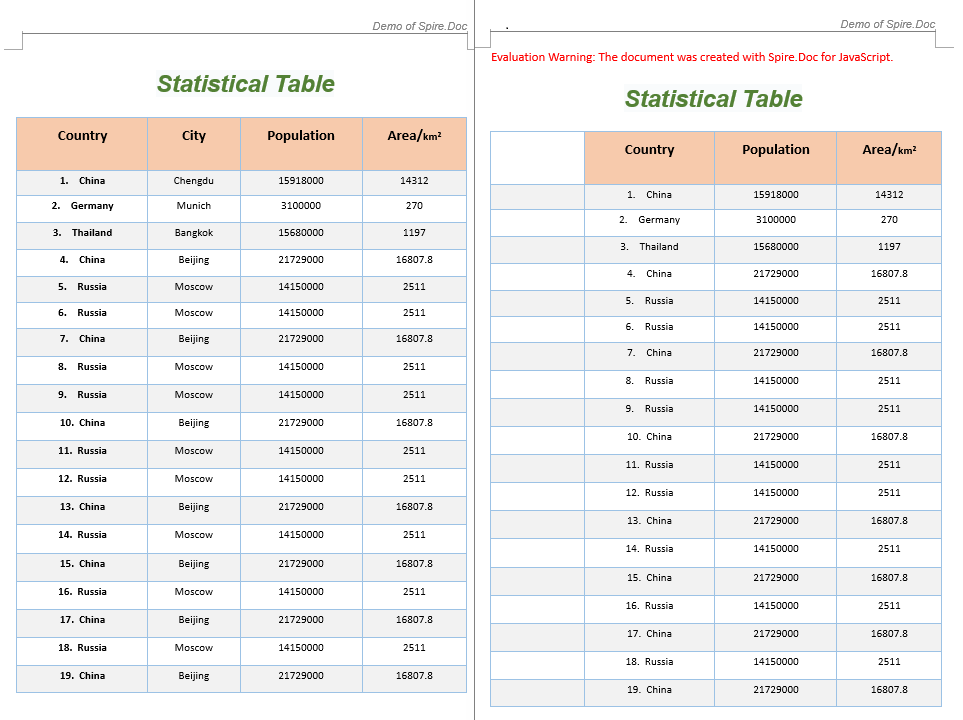
The code above inserts a blank column at column index 0 and removes column 2.
FAQ
Table data is garbled after deleting a row
Cause: When the table contains merged cells, deleting a row by index can cause subsequent row indices to shift, breaking the merged cell structure.
Solution: Before deleting, check whether the target row participates in a merge. If the row contains merged cells, unmerge them first before performing the deletion:
// Check the cell's merge state before deleting
let cell = table.Rows.get_Item(rowIndex).Cells.get_Item(0);
let verticalMerge = cell.CellFormat.VerticalMerge;
if (verticalMerge === wasmModule.CellMerge.None) {
  table.Rows.RemoveAt(rowIndex);
} else {
  console.warn("This row contains merged cells; consider handling the merge state first");
}
Newly added column appears blank in the document
Cause: The AddColumn function only inserts blank TableCell objects without adding paragraphs and text content to the new cells.
Solution: After inserting cells, iterate through the new column and add paragraphs with text:
function AddColumn(table, columnIndex) {
  let wasmModule = window.wasmModule.spiredoc;
  for (let r = 0; r < table.Rows.Count; r++) {
    let addCell = new wasmModule.TableCell(table.Document);
    let paragraph = addCell.AddParagraph();
    paragraph.AppendText("New Column");
    table.Rows.get_Item(r).Cells.Insert(columnIndex, addCell);
  }
}
Index out of bounds when deleting a column
Cause: The column index passed exceeds the maximum column count of the current table, or the row column counts are inconsistent.
Solution: Before deleting, get the column count from the first row as a reference and ensure the index is within range:
let maxColIndex = table.Rows.get_Item(0).Cells.Count - 1;
if (columnIndex <= maxColIndex) {
  RemoveColumn(table, columnIndex);
}
Get a Free License
If you wish to remove the evaluation message from the resulting document, or to eliminate functional limitations, please contact our sales team to request a 30-day temporary license.
Merging Word documents is a common requirement in web applications — combining multiple contract attachments into a single document, appending supplementary content at the end of a report, or merging multi-chapter documents for output. Spire.Doc for JavaScript handles document merging entirely in the browser via WebAssembly, using a virtual file system (VFS) to manage input and output files — no backend server required.
This article covers two core features:
For installation and project setup, refer to Integrating Spire.Doc for JavaScript in a React Project. The examples below assume Spire.Doc is installed and the WebAssembly module is initialized.
Merge by Section
Merging by section follows a three-stage process: first, load font files and both Word documents into the WASM virtual file system via FetchFileToVFS; then instantiate Document to load the target and source documents, iterate through all sections of the source document, and clone each section to the target document using Sections.Add(section.Clone()); finally, read the merged file from VFS, wrap it as a Blob, and trigger a browser download. This approach preserves each section's independent structure — every section starts on a new page in the merged document.
function App() {
  const mergeBySection = async () => {
    // Get the Spire.Doc WASM module
    const docModule = window.wasmModule?.spiredoc;

    // Check if the module is ready
    if (!docModule) {
      alert('Spire.Doc is not ready yet');
      return;
    }

    const inputFileName1 = 'Template_Docx_1.docx';
    await window.spire.FetchFileToVFS(inputFileName1, '', `${process.env.PUBLIC_URL}data/`);
    const inputFileName2 = 'Template_Docx_2.docx';
    await window.spire.FetchFileToVFS(inputFileName2, '', `${process.env.PUBLIC_URL}data/`);

    // Load the target document
    const TarDoc = new docModule.Document();
    TarDoc.LoadFromFile(inputFileName1);

    // Load the source document
    const SouDoc = new docModule.Document();
    SouDoc.LoadFromFile(inputFileName2);

    // Clone all sections from the source document and append them to the target
    for (let i = 0; i < SouDoc.Sections.Count; i++) {
      let section = SouDoc.Sections.get_Item(i);
      TarDoc.Sections.Add(section.Clone());
    }

    // Define the output file name
    const outputFileName = 'MergeBySection_out.docx';

    // Save the merged document
    TarDoc.SaveToFile({ fileName: outputFileName, fileFormat: docModule.FileFormat.Docx2013 });

    // Read the merged file from VFS and trigger download
    const modifiedFileArray = window.dotnetRuntime.Module.FS.readFile(outputFileName);
    const blob = new Blob([modifiedFileArray], { type: 'application/vnd.openxmlformats-officedocument.wordprocessingml.document' });
    const url = URL.createObjectURL(blob);
    const a = document.createElement('a');
    a.href = url;
    a.download = outputFileName;
    a.click();
    URL.revokeObjectURL(url);

    // Release resources
    TarDoc.Dispose();
    SouDoc.Dispose();
  };

  return (
    <div style={{ textAlign: 'center', height: '300px' }}>
      <h1>Merge Word By Section</h1>
      <button onClick={mergeBySection}>
        Generate
      </button>
    </div>
  );
}

export default App;
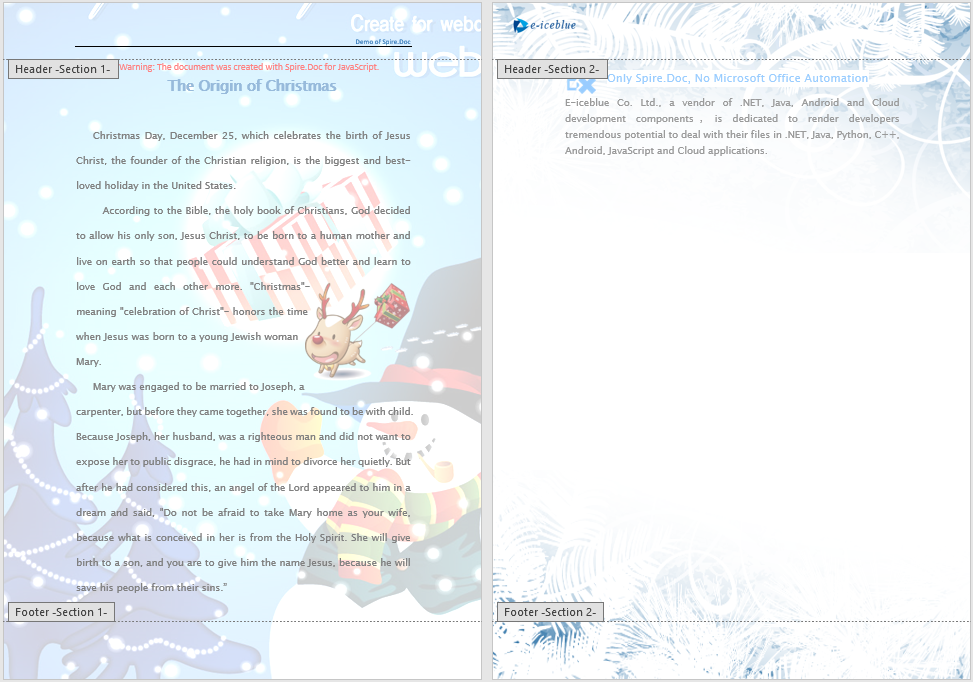
Each section from the source document appears as an independent page in the merged document after section-by-section merging
Merge on Same Page
Unlike section-by-section merging, same-page merging does not create new sections from the source document. Instead, it clones individual document elements — paragraphs, tables, images, and other content — from the source and appends them to the same section of the target document. The process also has three stages: first, load font files and both Word documents into the WASM virtual file system via FetchFileToVFS; then load the target and source documents, iterate through Body.ChildObjects under each section of the source, and append each element to the target document's first section using ChildObjects.Add(obj.Clone()); finally, read the merged file from VFS, wrap it as a Blob, and trigger a browser download. This approach keeps content flowing continuously on the same page without introducing section breaks.
function App() {
  const mergeOnSamePage = async () => {
    // Get the Spire.Doc WASM module
    const docModule = window.wasmModule?.spiredoc;

    // Check if the module is ready
    if (!docModule) {
      alert('Spire.Doc is not ready yet');
      return;
    }

    const inputFileName1 = 'Template_Docx_1.docx';
    await window.spire.FetchFileToVFS(inputFileName1, '', `${process.env.PUBLIC_URL}data/`);
    const inputFileName2 = 'Template_Docx_2.docx';
    await window.spire.FetchFileToVFS(inputFileName2, '', `${process.env.PUBLIC_URL}data/`);

    // Load the target document
    const destinationDocument = new docModule.Document();
    destinationDocument.LoadFromFile(inputFileName1);

    let count = destinationDocument.Sections.Count;

    // Load the source document
    const doc = new docModule.Document();
    doc.LoadFromFile(inputFileName2);

    // Iterate through all content elements in the source document
    // and clone them into the first section of the target document
    for (let i = 0; i < doc.Sections.Count; i++) {
      let section = doc.Sections.get_Item(i);
      for (let j = 0; j < section.Body.ChildObjects.Count; j++) {
        let obj = section.Body.ChildObjects.get_Item(j);
        destinationDocument.Sections.get_Item(count-1).Body.ChildObjects.Add(obj.Clone());
      }
    }

    // Define the output file name
    const outputFileName = 'MergeOnSamePage_out.docx';

    // Save the merged document
    destinationDocument.SaveToFile({ fileName: outputFileName, fileFormat: docModule.FileFormat.Docx2013 });

    // Read the merged file from VFS and trigger download
    const modifiedFileArray = window.dotnetRuntime.Module.FS.readFile(outputFileName);
    const blob = new Blob([modifiedFileArray], { type: 'application/vnd.openxmlformats-officedocument.wordprocessingml.document' });
    const url = URL.createObjectURL(blob);
    const a = document.createElement('a');
    a.href = url;
    a.download = outputFileName;
    a.click();
    URL.revokeObjectURL(url);

    // Release resources
    destinationDocument.Dispose();
    doc.Dispose();
  };

  return (
    <div style={{ textAlign: 'center', height: '300px' }}>
      <h1>Merge On Same Page</h1>
      <button onClick={mergeOnSamePage}>
        Generate
      </button>
    </div>
  );
}

export default App;
Source content is appended continuously to the same section of the target document without page breaks after same-page merging

FAQ
Formatting issues after merging
Cause: Style definitions (fonts, sizes, paragraph styles) differ between the source and target documents, causing style conflicts after merging. When merging by section, each section retains its own style settings, but cross-section style references may be lost.
Solution: Preserve the source document's original formatting by setting KeepSameFormat before merging:
srcDoc.KeepSameFormat = true;
Merged document cannot be opened
Cause: The MIME type or file extension of the output file is incorrect, preventing the browser or Word from properly identifying the file format. Alternatively, resources may not have been released correctly after saving, leaving VFS file handles open.
Solution: Use the correct DOCX MIME type:
const blob = new Blob([data], {
  type: 'application/vnd.openxmlformats-officedocument.wordprocessingml.document'
});
Also ensure that Dispose() is called on each Document object after every merge operation to avoid WASM memory leaks.
Get a Free License
Spire.Doc for JavaScript offers a 30-day full-featured free trial license with no functional limitations. If you would like to remove the evaluation message from the output document, contact sales to apply for a temporary license.
