
Knowledgebase (2417)
Children categories
Copying data within Excel files while preserving formatting is a common requirement in web-based spreadsheet applications. Spire.XLS for JavaScript runs entirely in the browser via WebAssembly, using a virtual file system (VFS) to manage input and output files — no backend server required. It provides comprehensive APIs to copy rows, columns, and cell ranges while keeping the original styles, fonts, colors, and other formatting intact.
This article covers three core features:
For installation and project setup, refer to Integrating Spire.XLS for JavaScript in a React Project. The examples below assume Spire.XLS is installed and the WebAssembly module is initialized.
Copy Rows in Excel
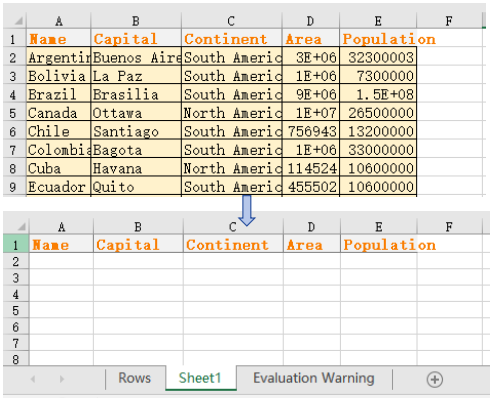
With Spire.XLS for JavaScript, you can copy rows within the same worksheet or across different worksheets while preserving all formatting, formulas, and styles. This is useful when you need to duplicate structured data such as headers, summary rows, or formatted templates. Through the CopyRangeOptions parameter, you can flexibly configure copy options such as copying all formats, conditional formatting, data validation, or only formula result values. The steps are as follows:
- Create a
Workbookobject and load an existing Excel file. - Get the source and destination worksheets via
workbook.Worksheets.get(). - Get the row to copy via
sheet.Rows[index]. - Use
sheet.Copy()with the source row, destination worksheet, destination row index, andCopyRangeOptions.Allto copy the row and its formatting. - Copy the column widths from the source row cells to the corresponding destination row cells.
- Save the workbook to an Excel file using
SaveToFile().
Below is a complete code example demonstrating how to copy rows in React:
function App() {
  const copyRows = async () => {
    // Get the Spire.XLS WASM module
    const xlsModule = window.wasmModule?.spirexls;

    // Check if the module is ready
    if (!xlsModule) {
      alert('Spire.Xls is not ready yet');
      return;
    }

    // Fetch the Excel file and add it to the Virtual File System (VFS)
    let excelFileName = 'Copying.xls';
    await window.spire.FetchFileToVFS(excelFileName, '', `${process.env.PUBLIC_URL}data/`);

    // Create a new workbook and load an existing file
    const workbook = new xlsModule.Workbook();
    workbook.LoadFromFile({ fileName: excelFileName });

    // Get the source and destination worksheets
    let sheet1 = workbook.Worksheets.get(0);
    let sheet2 = workbook.Worksheets.get(1);

    // Get the row to copy
    let row = sheet1.Rows[0];

    // Copy the row to the destination worksheet with all formatting
    sheet1.Copy({ sourceRange: row, destRange: sheet2.Rows[0], copyOptions: xlsModule.CopyRangeOptions.All });

    // Copy the column widths from source row to destination row
    let columns = sheet1.Columns.length;
    for (let i = 0; i < columns; i++) {
      let columnWidth = row.Columns[i].ColumnWidth;
      sheet2.Rows[0].Columns[i].ColumnWidth = columnWidth;
    }

    // Save the workbook
    const outputFileName = 'CopyRows_out.xlsx';
    workbook.SaveToFile({ fileName: outputFileName, version: xlsModule.ExcelVersion.Version2010 });
    workbook.Dispose();

    // Read the file from VFS and trigger download
    const fileArray = window.dotnetRuntime.Module.FS.readFile(outputFileName);
    const blob = new Blob([fileArray], { type: 'application/vnd.openxmlformats-officedocument.spreadsheetml.sheet' });
    const url = URL.createObjectURL(blob);
    const a = document.createElement('a');
    a.href = url;
    a.download = outputFileName;
    a.click();
    URL.revokeObjectURL(url);
  };

  return (
    <div style={{ textAlign: 'center', height: '300px' }}>
      <h1>Copy Excel Rows</h1>
      <button onClick={copyRows}>
        Generate
      </button>
    </div>
  );
}

export default App;
Row copy result
Copy Columns in Excel
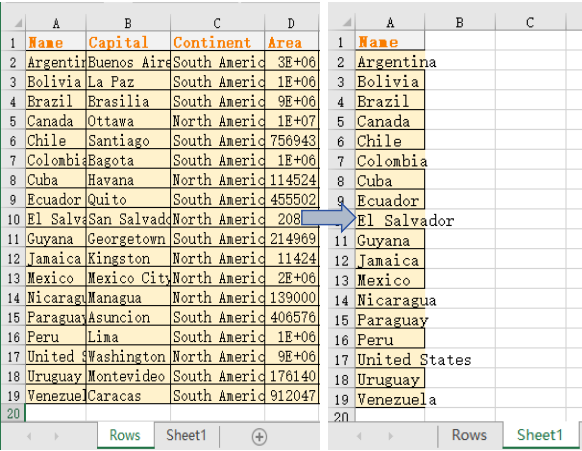
Copying columns is equally straightforward with Spire.XLS for JavaScript. You can duplicate a column within the same worksheet or copy it to another sheet, and all cell styles, number formats, and data will be preserved. Through the CopyRangeOptions parameter, you can flexibly configure which elements to copy. This is particularly helpful for reorganizing spreadsheet layouts or replicating data structures. The steps are as follows:
- Create a
Workbookobject and load an existing Excel file. - Get the source and destination worksheets.
- Get the column to copy via
sheet.Columns[index]. - Use
sheet.Copy()with the source column, destination worksheet, destination column index, andCopyRangeOptions.Allto copy the column and its formatting. - Copy the column widths and row heights from the source column cells to the corresponding destination column cells.
- Save the workbook to an Excel file using
SaveToFile().
Below is a complete code example demonstrating how to copy columns in React:
function App() {
  const copyColumns = async () => {
    // Get the Spire.XLS WASM module
    const xlsModule = window.wasmModule?.spirexls;

    // Check if the module is ready
    if (!xlsModule) {
      alert('Spire.Xls is not ready yet');
      return;
    }

    // Fetch the Excel file and add it to the Virtual File System (VFS)
    let excelFileName = 'Copying.xls';
    await window.spire.FetchFileToVFS(excelFileName, '', `${process.env.PUBLIC_URL}data/`);

    // Create a new workbook and load an existing file
    const workbook = new xlsModule.Workbook();
    workbook.LoadFromFile({ fileName: excelFileName });

    // Get the source and destination worksheets
    let sheet1 = workbook.Worksheets.get(0);
    let sheet2 = workbook.Worksheets.get(1);

    // Get the column to copy
    let column = sheet1.Columns[0];

    // Copy the column to the destination worksheet with all formatting
    sheet1.Copy({ sourceRange: column, destRange: sheet2.Columns[0], copyOptions: xlsModule.CopyRangeOptions.All });

    // Copy the column width and row heights from source column to destination column
    sheet2.Columns[0].ColumnWidth = column.ColumnWidth;
    let rows = column.Rows.length;
    for (let i = 0; i < rows; i++) {
      let rowHeight = column.Rows[i].RowHeight;
      sheet2.Columns[0].Rows[i].RowHeight = rowHeight;
    }

    // Save the workbook
    const outputFileName = 'CopyColumns_out.xlsx';
    workbook.SaveToFile({ fileName: outputFileName, version: xlsModule.ExcelVersion.Version2010 });
    workbook.Dispose();

    // Read the file from VFS and trigger download
    const fileArray = window.dotnetRuntime.Module.FS.readFile(outputFileName);
    const blob = new Blob([fileArray], { type: 'application/vnd.openxmlformats-officedocument.spreadsheetml.sheet' });
    const url = URL.createObjectURL(blob);
    const a = document.createElement('a');
    a.href = url;
    a.download = outputFileName;
    a.click();
    URL.revokeObjectURL(url);
  };

  return (
    <div style={{ textAlign: 'center', height: '300px' }}>
      <h1>Copy Excel Columns</h1>
      <button onClick={copyColumns}>
        Generate
      </button>
    </div>
  );
}

export default App;
Column copy result
Copy Cells in Excel
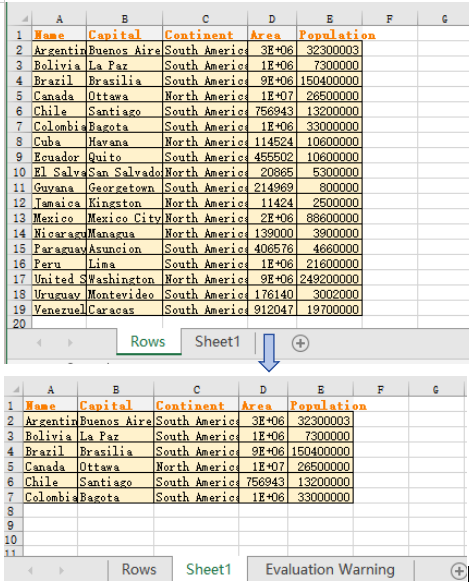
Beyond copying entire rows and columns, Spire.XLS for JavaScript also allows you to copy specific cell ranges from one location to another while preserving all formatting. The CellRange.Copy() method provides this capability with flexible options. This gives you fine-grained control over which cells to duplicate. You can copy a range of cells within the same worksheet or to a different worksheet. The steps are as follows:
- Create a
Workbookobject and load an existing Excel file. - Get the source and destination worksheets.
- Get the source cell range and destination cell range via
sheet.Range.get(). - Use
sourceRange.Copy()with the destination range andCopyRangeOptions.Allto copy the cell range with all formatting. - Copy the column widths and row heights from the source range to the destination range.
- Save the workbook to an Excel file using
SaveToFile().
Below is a complete code example demonstrating how to copy cells in React:
function App() {
  const copyCells = async () => {
    // Get the Spire.XLS WASM module
    const xlsModule = window.wasmModule?.spirexls;

    // Check if the module is ready
    if (!xlsModule) {
      alert('Spire.Xls is not ready yet');
      return;
    }

    // Fetch the Excel file and add it to the Virtual File System (VFS)
    let excelFileName = 'Copying.xls';
    await window.spire.FetchFileToVFS(excelFileName, '', `${process.env.PUBLIC_URL}data/`);

    // Create a new workbook and load an existing file
    const workbook = new xlsModule.Workbook();
    workbook.LoadFromFile({ fileName: excelFileName });

    // Get the source and destination worksheets
    let sheet1 = workbook.Worksheets.get(0);
    let sheet2 = workbook.Worksheets.get(1);

    // Get the source cell range and destination cell range
    let range1 = sheet1.Range.get("A1:E7");
    let range2 = sheet2.Range.get("A1:E7");

    // Copy the source range to the destination range with all formatting
    range1.Copy({ destRange: range2, copyOptions: xlsModule.CopyRangeOptions.All });

    // Copy the row heights and column widths from source to destination
    for (let i = 0; i < range1.Rows.length; i++) {
      let row = range1.Rows[i];
      for (let j = 0; j < row.Columns.length; j++) {
        let column = row.Columns[j];
        range2.Rows[i].Columns[j].ColumnWidth = column.ColumnWidth;
        range2.Rows[i].RowHeight = row.RowHeight;
      }
    }

    // Save the workbook
    const outputFileName = 'CopyCells.xlsx';
    workbook.SaveToFile({ fileName: outputFileName, version: xlsModule.ExcelVersion.Version2010 });
    workbook.Dispose();

    // Read the file from VFS and trigger download
    const fileArray = window.dotnetRuntime.Module.FS.readFile(outputFileName);
    const blob = new Blob([fileArray], { type: 'application/vnd.openxmlformats-officedocument.spreadsheetml.sheet' });
    const url = URL.createObjectURL(blob);
    const a = document.createElement('a');
    a.href = url;
    a.download = outputFileName;
    a.click();
    URL.revokeObjectURL(url);
  };

  return (
    <div style={{ textAlign: 'center', height: '300px' }}>
      <h1>Copy Excel Cells</h1>
      <button onClick={copyCells}>
        Generate
      </button>
    </div>
  );
}

export default App;
Cell copy result
FAQ
What happens if the target location already contains data
Cause: By default, the Copy() method overwrites existing data at the target location without merging or preserving the original content.
Solution: Choose an empty area as the destination range, or check whether the target range is empty before performing the copy. You can also back up the target data first, then execute the copy operation.
Can I copy only values without formulas
Cause: CopyRangeOptions.All copies formulas themselves, but sometimes you only need the calculated result values without preserving the formula logic.
Solution: Use the CopyRangeOptions.OnlyCopyFormulaValue option to copy only the calculated result values, not the formulas themselves:
sourceRange.Copy({ destRange: destRange, copyOptions: xlsModule.CopyRangeOptions.OnlyCopyFormulaValue });
Get a Free License
Spire.XLS for JavaScript offers a 30-day full-featured free trial license with no functional limitations. Apply here to evaluate before purchasing.
Configuring page setup is essential for preparing Excel documents for printing or PDF export. Spire.XLS for JavaScript runs entirely in the browser via WebAssembly, using a virtual file system (VFS) to manage input and output files — no backend server required. It provides comprehensive page setup capabilities through the PageSetup object, allowing you to control margins, orientation, paper size, print area, zoom scaling, and fit-to-page options.
The PageSetup object in Spire.XLS offers a rich set of properties for controlling how a worksheet is printed or displayed. Key properties include:
| Property | Description |
|---|---|
| TopMargin / BottomMargin / LeftMargin / RightMargin | Sets the page margins |
| Orientation | Sets the page orientation (Portrait or Landscape) |
| PaperSize | Sets the paper size (A4, Letter, etc.) |
| PrintArea | Specifies the cell range to print |
| Zoom | Sets the worksheet zoom scaling percentage |
| FitToPagesTall / FitToPagesWide | Scales the worksheet to fit a specified number of pages |
This article covers six core features:
- Adjust Excel Page Margins
- Adjust Excel Page Orientation
- Adjust Excel Paper Size
- Adjust Excel Print Area
- Adjust Excel Zoom Scale
- Fit Excel Table to 1 Page
For installation and project setup, refer to Integrating Spire.XLS for JavaScript in a React Project. The examples below assume Spire.XLS is installed and the WebAssembly module is initialized.
Adjust Excel Page Margins
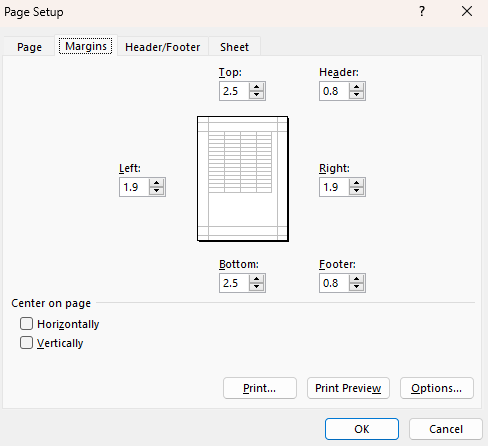
Page margins define the blank space around the edges of a printed worksheet. The steps are as follows:
- Create a
Workbookobject usingnew xlsModule.Workbook(). - Get the default worksheet using the
workbook.Worksheets.get(index)method. - Access the
PageSetupobject throughsheet.PageSetup. - Set page margins using the
TopMargin,BottomMargin,LeftMargin, andRightMarginproperties. - Save the workbook to an Excel file using the
workbook.SaveToFile()method.
Below is a complete code example demonstrating how to adjust page margins in React:
function App() {
  const adjustPageMargins = async () => {
    // Get the Spire.XLS WASM module
    const xlsModule = window.wasmModule?.spirexls;

    // Check if the module is ready
    if (!xlsModule) {
      alert('Spire.Xls is not ready yet');
      return;
    }

    // Create a workbook and load the existing file
    await window.spire.FetchFileToVFS('Sample.xlsx', '', `${process.env.PUBLIC_URL}data/`);

    const workbook = new xlsModule.Workbook();
    workbook.LoadFromFile({ fileName: 'Sample.xlsx' });
    const sheet = workbook.Worksheets.get(0);

    // Get the PageSetup object
    const pageSetup = sheet.PageSetup;

    // Set the top, bottom, left, right, header, and footer margins
    pageSetup.TopMargin = 1;
    pageSetup.BottomMargin = 1;
    pageSetup.LeftMargin = 0.75;
    pageSetup.RightMargin = 0.75;

    // Save the workbook
    const outputFileName = 'AdjustMargins.xlsx';
    workbook.SaveToFile(outputFileName);
    workbook.Dispose();

    // Read the file from VFS and trigger download
    const fileArray = window.dotnetRuntime.Module.FS.readFile(outputFileName);
    const blob = new Blob([fileArray], { type: 'application/vnd.openxmlformats-officedocument.spreadsheetml.sheet' });
    const url = URL.createObjectURL(blob);
    const a = document.createElement('a');
    a.href = url;
    a.download = outputFileName;
    a.click();
    URL.revokeObjectURL(url);
  };

  return (
    <div style={{ textAlign: 'center', height: '300px' }}>
      <h1>Adjust Page Margins</h1>
      <button onClick={adjustPageMargins}>
        Generate
      </button>
    </div>
  );
}

export default App;
Page margins adjusted with Spire.XLS for JavaScript
Adjust Excel Page Orientation
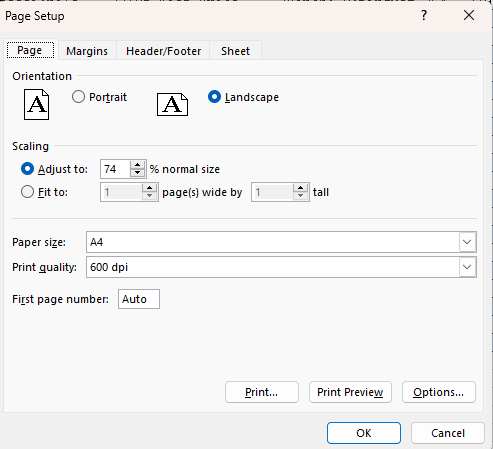
Page orientation determines whether a worksheet is printed in portrait (vertical) or landscape (horizontal) layout. Landscape orientation is especially useful for wide tables with many columns. The steps are as follows:
- Create a
Workbookobject usingnew xlsModule.Workbook(). - Get the default worksheet using the
workbook.Worksheets.get(index)method. - Access the
PageSetupobject throughsheet.PageSetup. - Set the page orientation using the
Orientationproperty. - Save the workbook to an Excel file using the
workbook.SaveToFile()method.
Below is a complete code example demonstrating how to set the page orientation to landscape in React:
function App() {
  const setPageOrientation = async () => {
    // Get the Spire.XLS WASM module
    const xlsModule = window.wasmModule?.spirexls;

    // Check if the module is ready
    if (!xlsModule) {
      alert('Spire.Xls is not ready yet');
      return;
    }

    // Create a workbook and load the existing file
    // Load the sample file into VFS
    await window.spire.FetchFileToVFS('Sample.xlsx', '', `${process.env.PUBLIC_URL}data/`);

    const workbook = new xlsModule.Workbook();
    workbook.LoadFromFile({ fileName: 'Sample.xlsx' });
    const sheet = workbook.Worksheets.get(0);

    // Set the page orientation to Landscape
    sheet.PageSetup.Orientation = xlsModule.PageOrientationType.Landscape;

    // Save the workbook
    const outputFileName = 'SetOrientation.xlsx';
    workbook.SaveToFile(outputFileName);
    workbook.Dispose();

    // Read the file from VFS and trigger download
    const fileArray = window.dotnetRuntime.Module.FS.readFile(outputFileName);
    const blob = new Blob([fileArray], { type: 'application/vnd.openxmlformats-officedocument.spreadsheetml.sheet' });
    const url = URL.createObjectURL(blob);
    const a = document.createElement('a');
    a.href = url;
    a.download = outputFileName;
    a.click();
    URL.revokeObjectURL(url);
  };

  return (
    <div style={{ textAlign: 'center', height: '300px' }}>
      <h1>Set Page Orientation</h1>
      <button onClick={setPageOrientation}>
        Generate
      </button>
    </div>
  );
}

export default App;
Page orientation set to landscape with Spire.XLS for JavaScript
Adjust Excel Paper Size
Different printers and regions use different standard paper sizes. Spire.XLS for JavaScript supports a wide range of paper sizes through the PaperSizeType enumeration, including A4, Letter, A3, and many more. The steps are as follows:
- Create a
Workbookobject usingnew xlsModule.Workbook(). - Get the default worksheet using the
workbook.Worksheets.get(index)method. - Access the
PageSetupobject throughsheet.PageSetup. - Set the paper size using the
PaperSizeproperty. - Save the workbook to an Excel file using the
workbook.SaveToFile()method.
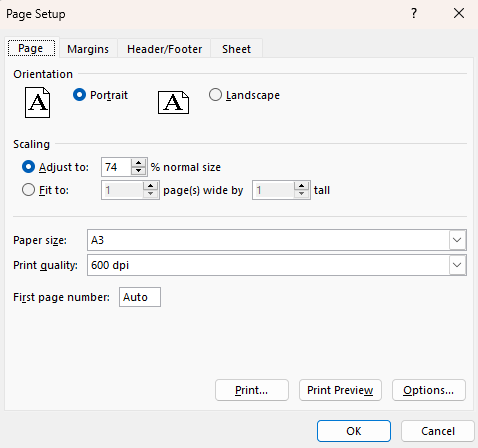
Below is a complete code example demonstrating how to set the paper size to A3 in React:
function App() {
  const setPaperSize = async () => {
    // Get the Spire.XLS WASM module
    const xlsModule = window.wasmModule?.spirexls;

    // Check if the module is ready
    if (!xlsModule) {
      alert('Spire.Xls is not ready yet');
      return;
    }

    // Create a workbook and load the existing file
    // Load the sample file into VFS
    await window.spire.FetchFileToVFS('Sample.xlsx', '', `${process.env.PUBLIC_URL}data/`);

    const workbook = new xlsModule.Workbook();
    workbook.LoadFromFile({ fileName: 'Sample.xlsx' });
    const sheet = workbook.Worksheets.get(0);

    // Get the PageSetup object
    const pageSetup = sheet.PageSetup;

    // Set the paper size to A3
    pageSetup.PaperSize = xlsModule.PaperSizeType.PaperA3;

    // Save the workbook
    const outputFileName = 'SetPaperSize.xlsx';
    workbook.SaveToFile(outputFileName);
    workbook.Dispose();

    // Read the file from VFS and trigger download
    const fileArray = window.dotnetRuntime.Module.FS.readFile(outputFileName);
    const blob = new Blob([fileArray], { type: 'application/vnd.openxmlformats-officedocument.spreadsheetml.sheet' });
    const url = URL.createObjectURL(blob);
    const a = document.createElement('a');
    a.href = url;
    a.download = outputFileName;
    a.click();
    URL.revokeObjectURL(url);
  };

  return (
    <div style={{ textAlign: 'center', height: '300px' }}>
      <h1>Set Paper Size</h1>
      <button onClick={setPaperSize}>
        Generate
      </button>
    </div>
  );
}

export default App;
Paper size set to A3 with Spire.XLS for JavaScript
Adjust Excel Print Area
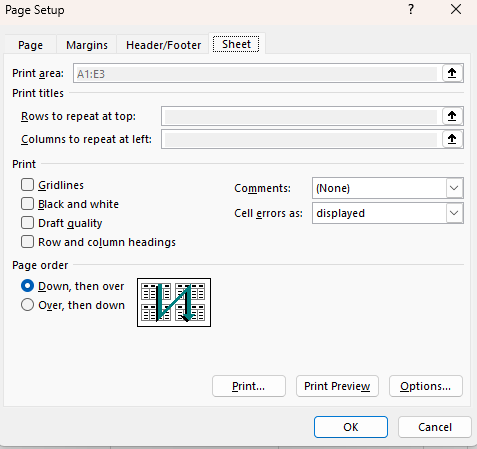
The print area defines which portion of a worksheet will be printed. The steps are as follows:
- Create a
Workbookobject usingnew xlsModule.Workbook(). - Get the default worksheet using the
workbook.Worksheets.get(index)method. - Populate sample data using the
sheet.Rangeproperty. - Access the
PageSetupobject throughsheet.PageSetup. - Set the print area using the
PrintAreaproperty. - Save the workbook to an Excel file using the
workbook.SaveToFile()method.
Below is a complete code example demonstrating how to set the print area in React:
function App() {
  const setPrintArea = async () => {
    // Get the Spire.XLS WASM module
    const xlsModule = window.wasmModule?.spirexls;

    // Check if the module is ready
    if (!xlsModule) {
      alert('Spire.Xls is not ready yet');
      return;
    }

    // Create a workbook and load the existing file
    // Load the sample file into VFS
    await window.spire.FetchFileToVFS('Sample.xlsx', '', `${process.env.PUBLIC_URL}data/`);

    const workbook = new xlsModule.Workbook();
    workbook.LoadFromFile({ fileName: 'Sample.xlsx' });
    const sheet = workbook.Worksheets.get(0);

    // Set the print area to A1:E3
    sheet.PageSetup.PrintArea = "A1:E3";

    // Save the workbook
    const outputFileName = 'SetPrintArea.xlsx';
    workbook.SaveToFile(outputFileName);
    workbook.Dispose();

    // Read the file from VFS and trigger download
    const fileArray = window.dotnetRuntime.Module.FS.readFile(outputFileName);
    const blob = new Blob([fileArray], { type: 'application/vnd.openxmlformats-officedocument.spreadsheetml.sheet' });
    const url = URL.createObjectURL(blob);
    const a = document.createElement('a');
    a.href = url;
    a.download = outputFileName;
    a.click();
    URL.revokeObjectURL(url);
  };

  return (
    <div style={{ textAlign: 'center', height: '300px' }}>
      <h1>Set Print Area</h1>
      <button onClick={setPrintArea}>
        Generate
      </button>
    </div>
  );
}

export default App;
Print area set with Spire.XLS for JavaScript
Adjust Excel Zoom Scale
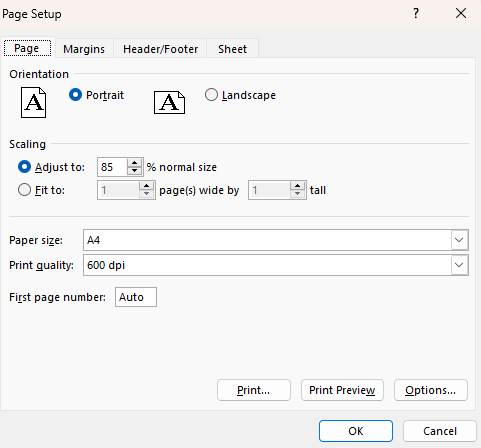
The zoom scale controls the magnification level at which a worksheet is displayed on screen. The value ranges from 10 to 400, representing a percentage of normal size. The steps are as follows:
- Create a
Workbookobject usingnew xlsModule.Workbook(). - Get the default worksheet using the
workbook.Worksheets.get(index)method. - Set the zoom scale using the
Zoomproperty. - Save the workbook to an Excel file using the
workbook.SaveToFile()method.
Below is a complete code example demonstrating how to set the zoom scale in React:
function App() {
  const setZoomScale = async () => {
    // Get the Spire.XLS WASM module
    const xlsModule = window.wasmModule?.spirexls;

    // Check if the module is ready
    if (!xlsModule) {
      alert('Spire.Xls is not ready yet');
      return;
    }

    // Create a workbook and load the existing file
    // Load the sample file into VFS
    await window.spire.FetchFileToVFS('Sample.xlsx', '', `${process.env.PUBLIC_URL}data/`);

    const workbook = new xlsModule.Workbook();
    workbook.LoadFromFile({ fileName: 'Sample.xlsx' });
    const sheet = workbook.Worksheets.get(0);

    // Set the zoom scale to 85%
    const pageSetup = sheet.PageSetup;
    pageSetup.Zoom = 85;

    // Save the workbook
    const outputFileName = 'SetZoomScale.xlsx';
    workbook.SaveToFile(outputFileName);
    workbook.Dispose();

    // Read the file from VFS and trigger download
    const fileArray = window.dotnetRuntime.Module.FS.readFile(outputFileName);
    const blob = new Blob([fileArray], { type: 'application/vnd.openxmlformats-officedocument.spreadsheetml.sheet' });
    const url = URL.createObjectURL(blob);
    const a = document.createElement('a');
    a.href = url;
    a.download = outputFileName;
    a.click();
    URL.revokeObjectURL(url);
  };

  return (
    <div style={{ textAlign: 'center', height: '300px' }}>
      <h1>Set Zoom Scale</h1>
      <button onClick={setZoomScale}>
        Generate
      </button>
    </div>
  );
}

export default App;
Zoom scale set to 85% with Spire.XLS for JavaScript
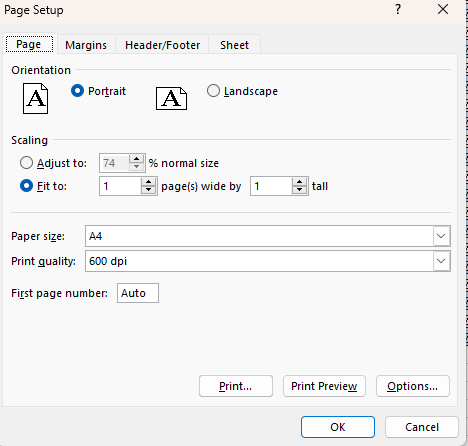
Fit Excel Table to 1 Page
When printing a large worksheet, the content may span multiple pages, making it difficult to read. The steps are as follows:
- Create a
Workbookobject usingnew xlsModule.Workbook(). - Get the default worksheet using the
workbook.Worksheets.get(index)method. - Populate sample data using the
sheet.Rangeproperty. - Access the
PageSetupobject throughsheet.PageSetup. - Set the fit-to-page properties using the
FitToPagesTallandFitToPagesWideproperties. - Save the workbook to an Excel file using the
workbook.SaveToFile()method.
Below is a complete code example demonstrating how to fit a worksheet to one page in React:
function App() {
  const fitToPage = async () => {
    // Get the Spire.XLS WASM module
    const xlsModule = window.wasmModule?.spirexls;

    // Check if the module is ready
    if (!xlsModule) {
      alert('Spire.Xls is not ready yet');
      return;
    }

    // Create a workbook and load the existing file
    // Load the sample file into VFS
    await window.spire.FetchFileToVFS('Sample.xlsx', '', `${process.env.PUBLIC_URL}data/`);

    const workbook = new xlsModule.Workbook();
    workbook.LoadFromFile({ fileName: 'Sample.xlsx' });
    const sheet = workbook.Worksheets.get(0);

    // Fit the worksheet content to 1 page
    const pageSetup = sheet.PageSetup;
    pageSetup.FitToPagesTall = 1;
    pageSetup.FitToPagesWide = 1;

    // Save the workbook
    const outputFileName = 'FitToPage.xlsx';
    workbook.SaveToFile(outputFileName);
    workbook.Dispose();

    // Read the file from VFS and trigger download
    const fileArray = window.dotnetRuntime.Module.FS.readFile(outputFileName);
    const blob = new Blob([fileArray], { type: 'application/vnd.openxmlformats-officedocument.spreadsheetml.sheet' });
    const url = URL.createObjectURL(blob);
    const a = document.createElement('a');
    a.href = url;
    a.download = outputFileName;
    a.click();
    URL.revokeObjectURL(url);
  };

  return (
    <div style={{ textAlign: 'center', height: '300px' }}>
      <h1>Fit Worksheet to 1 Page</h1>
      <button onClick={fitToPage}>
        Generate
      </button>
    </div>
  );
}

export default App;
Worksheet scaled to fit one page with Spire.XLS for JavaScript
FAQ
How to print gridlines or row/column headings
Cause: By default, gridlines and row/column headings are not printed, which can make the data harder to read on paper.
Solution: Use the IsPrintGridlines and IsPrintHeadings properties of the PageSetup object:
pageSetup.IsPrintGridlines = true;
pageSetup.IsPrintHeadings = true;
How to get the actual page dimensions
Cause: You may need to know the actual width and height of the current paper size to adjust content layout.
Solution: Retrieve the values using the PageWidth and PageHeight properties of the PageSetup object:
var pageWidth = pageSetup.PageWidth;
var pageHeight = pageSetup.PageHeight;
Get a Free License
Spire.XLS for JavaScript offers a 30-day full-featured free trial license with no functional limitations. Apply here to evaluate before purchasing.
Adding charts to Excel files is one of the most common data visualization requirements in web applications. Spire.XLS for JavaScript runs entirely in the browser via WebAssembly, using a virtual file system (VFS) to manage input and output files — no backend server required. It supports creating a wide variety of chart types, including column charts, pie charts, doughnut charts, line charts, scatter charts, and more.
This article covers three core features:
For installation and project setup, refer to Integrating Spire.XLS for JavaScript in a React Project. The examples below assume Spire.XLS is installed and the WebAssembly module is initialized.
Create a Column Chart
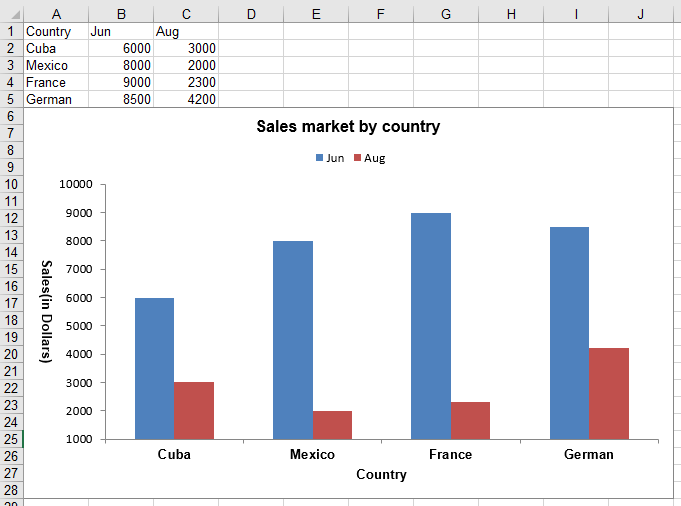
Column charts are one of the most commonly used chart types for comparing values across categories. With Spire.XLS for JavaScript, you can create a clustered column chart by first populating a worksheet with data, then adding a chart object, setting the chart type to ColumnClustered, and configuring the chart title, axes, and data labels. The steps are as follows:
- Create a
Workbookobject and get the default worksheet. - Populate the worksheet with category labels and numeric data.
- Add a chart to the worksheet using
sheet.Charts.Add(). - Set the chart's
DataRangeto the data range and specify the chart type asExcelChartType.ColumnClustered. - Configure the chart position, title, axis titles, and legend.
- Save the workbook to an Excel file using
SaveToFile().
Below is a complete code example demonstrating how to create a clustered column chart in React:
function App() {
  const createColumnChart = async () => {
    // Get the Spire.XLS WASM module
    const xlsModule = window.wasmModule?.spirexls;

    // Check if the module is ready
    if (!xlsModule) {
      alert('Spire.Xls is not ready yet');
      return;
    }

    // Create a new workbook and get the default worksheet
    const workbook = new xlsModule.Workbook();
    const sheet = workbook.Worksheets.get(0);
    sheet.Name = "ClusteredColumn";

    // Populate chart data
    sheet.Range.get("A1").Value = "Country";
    sheet.Range.get("A2").Value = "Cuba";
    sheet.Range.get("A3").Value = "Mexico";
    sheet.Range.get("A4").Value = "France";
    sheet.Range.get("A5").Value = "German";

    sheet.Range.get("B1").Value = "Jun";
    sheet.Range.get("B2").NumberValue = 6000;
    sheet.Range.get("B3").NumberValue = 8000;
    sheet.Range.get("B4").NumberValue = 9000;
    sheet.Range.get("B5").NumberValue = 8500;

    sheet.Range.get("C1").Value = "Aug";
    sheet.Range.get("C2").NumberValue = 3000;
    sheet.Range.get("C3").NumberValue = 2000;
    sheet.Range.get("C4").NumberValue = 2300;
    sheet.Range.get("C5").NumberValue = 4200;

    // Add a chart and set its data range
    const chart = sheet.Charts.Add();
    chart.DataRange = sheet.Range.get("A1:C5");
    chart.SeriesDataFromRange = false;

    // Set the chart position
    chart.LeftColumn = 1;
    chart.TopRow = 6;
    chart.RightColumn = 11;
    chart.BottomRow = 29;

    // Set the chart type to clustered column
    chart.ChartType = xlsModule.ExcelChartType.ColumnClustered;

    // Configure chart title
    chart.ChartTitle = "Sales market by country";
    chart.ChartTitleArea.IsBold = true;
    chart.ChartTitleArea.Size = 12;

    // Configure axis titles
    chart.PrimaryCategoryAxis.Title = "Country";
    chart.PrimaryCategoryAxis.Font.IsBold = true;
    chart.PrimaryCategoryAxis.TitleArea.IsBold = true;

    chart.PrimaryValueAxis.Title = "Sales(in Dollars)";
    chart.PrimaryValueAxis.HasMajorGridLines = false;
    chart.PrimaryValueAxis.MinValue = 1000;
    chart.PrimaryValueAxis.TitleArea.IsBold = true;
    chart.PrimaryValueAxis.TitleArea.TextRotationAngle = 90;

    // Configure data labels: show numeric value on each data point
    for (let i = 0; i < chart.Series.Length; i++) {
      let cs = chart.Series.get(i);
      cs.Format.Options.IsVaryColor = true;
      cs.DataPoints.DefaultDataPoint.DataLabels.HasValue = true; // Show value labels
    }

    // Set legend position
    chart.Legend.Position = xlsModule.LegendPositionType.Top;

    // Save the workbook
    const outputFileName = 'ClusteredColumn.xlsx';
    workbook.SaveToFile(outputFileName);
    workbook.Dispose();

    // Read the file from VFS and trigger download
    const fileArray = window.dotnetRuntime.Module.FS.readFile(outputFileName);
    const blob = new Blob([fileArray], { type: 'application/vnd.openxmlformats-officedocument.spreadsheetml.sheet' });
    const url = URL.createObjectURL(blob);
    const a = document.createElement('a');
    a.href = url;
    a.download = outputFileName;
    a.click();
    URL.revokeObjectURL(url);
  };

  return (
    <div style={{ textAlign: 'center', height: '300px' }}>
      <h1>Create Clustered Column Chart</h1>
      <button onClick={createColumnChart}>
        Generate
      </button>
    </div>
  );
}

export default App;
Clustered column chart created with Spire.XLS for JavaScript
Create a Pie Chart
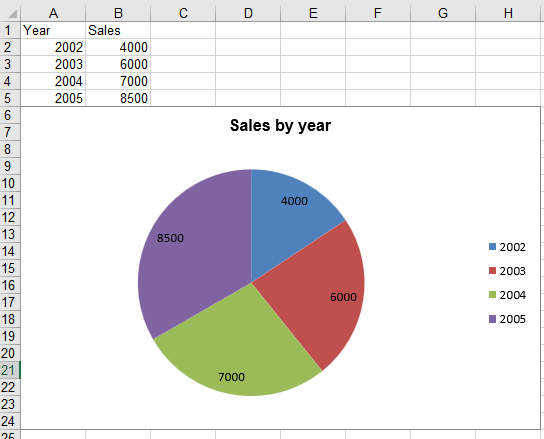
Pie charts are ideal for displaying the proportional distribution of data across categories. With Spire.XLS for JavaScript, you can create a pie chart by specifying the chart type as Pie when adding the chart, then binding category labels and data values. The steps are as follows:
- Create a
Workbookobject and get the default worksheet. - Populate the worksheet with category labels and numeric values.
- Add a chart with
ExcelChartType.Pieusingsheet.Charts.Add(). - Set the chart data range and bind category labels and values.
- Configure the chart position, title, and data labels.
- Save the workbook to an Excel file using
SaveToFile().
Below is a complete code example demonstrating how to create a pie chart in React:
function App() {
  const createPieChart = async () => {
    // Get the Spire.XLS WASM module
    const xlsModule = window.wasmModule?.spirexls;

    // Check if the module is ready
    if (!xlsModule) {
      alert('Spire.Xls is not ready yet');
      return;
    }

    // Create a new workbook and get the default worksheet
    const workbook = new xlsModule.Workbook();
    let sheet = workbook.Worksheets.get(0);
    sheet.Name = "Pie Chart";

    // Populate chart data
    sheet.Range.get("A1").Value = "Year";
    sheet.Range.get("A2").Value = "2002";
    sheet.Range.get("A3").Value = "2003";
    sheet.Range.get("A4").Value = "2004";
    sheet.Range.get("A5").Value = "2005";

    sheet.Range.get("B1").Value = "Sales";
    sheet.Range.get("B2").NumberValue = 4000;
    sheet.Range.get("B3").NumberValue = 6000;
    sheet.Range.get("B4").NumberValue = 7000;
    sheet.Range.get("B5").NumberValue = 8500;

    // Add a pie chart
    let chart = sheet.Charts.Add({ chartType: xlsModule.ExcelChartType.Pie });
    chart.DataRange = sheet.Range.get("B2:B5");
    chart.SeriesDataFromRange = false;

    // Set the chart position
    chart.LeftColumn = 1;
    chart.TopRow = 6;
    chart.RightColumn = 9;
    chart.BottomRow = 25;

    // Configure chart title
    chart.ChartTitle = "Sales by year";
    chart.ChartTitleArea.IsBold = true;
    chart.ChartTitleArea.Size = 12;

    // Bind category labels and values
    let cs = chart.Series.get(0);
    cs.CategoryLabels = sheet.Range.get("A2:A5");
    cs.Values = sheet.Range.get("B2:B5");
    cs.DataPoints.DefaultDataPoint.DataLabels.HasValue = true; // Show value labels

    chart.PlotArea.Fill.Visible = false;

    // Save the workbook
    const outputFileName = 'Pie.xlsx';
    workbook.SaveToFile(outputFileName);
    workbook.Dispose();

    // Read the file from VFS and trigger download
    const fileArray = window.dotnetRuntime.Module.FS.readFile(outputFileName);
    const blob = new Blob([fileArray], { type: 'application/vnd.openxmlformats-officedocument.spreadsheetml.sheet' });
    const url = URL.createObjectURL(blob);
    const a = document.createElement('a');
    a.href = url;
    a.download = outputFileName;
    a.click();
    URL.revokeObjectURL(url);
  };

  return (
    <div style={{ textAlign: 'center', height: '300px' }}>
      <h1>Create Pie Chart</h1>
      <button onClick={createPieChart}>
        Generate
      </button>
    </div>
  );
}

export default App;
Pie chart created with Spire.XLS for JavaScript
Create a Doughnut Chart
A doughnut chart is similar to a pie chart but with a hollow center, which can display multiple data series. With Spire.XLS for JavaScript, you can create a doughnut chart by setting the chart type to Doughnut and configuring percentage data labels. The steps are as follows:
- Create a
Workbookobject and get the default worksheet. - Populate the worksheet with category labels and numeric values.
- Add a chart and set its
ChartTypetoExcelChartType.Doughnut. - Configure the chart position, title, and percentage data labels.
- Save the workbook to an Excel file using
SaveToFile().
Below is a complete code example demonstrating how to create a doughnut chart in React:
function App() {
  const createDoughnutChart = async () => {
    // Get the Spire.XLS WASM module
    const xlsModule = window.wasmModule?.spirexls;

    // Check if the module is ready
    if (!xlsModule) {
      alert('Spire.Xls is not ready yet');
      return;
    }

    // Create a new workbook and get the default worksheet
    const workbook = new xlsModule.Workbook();
    let sheet = workbook.Worksheets.get(0);

    // Populate chart data
    sheet.Range.get("A1").Value = "Country";
    sheet.Range.get("A1").Style.Font.IsBold = true;
    sheet.Range.get("A2").Value = "Cuba";
    sheet.Range.get("A3").Value = "Mexico";
    sheet.Range.get("A4").Value = "France";
    sheet.Range.get("A5").Value = "German";
    sheet.Range.get("B1").Value = "Sales";
    sheet.Range.get("B1").Style.Font.IsBold = true;
    sheet.Range.get("B2").NumberValue = 6000;
    sheet.Range.get("B3").NumberValue = 8000;
    sheet.Range.get("B4").NumberValue = 9000;
    sheet.Range.get("B5").NumberValue = 8500;

    // Add a doughnut chart
    let chart = sheet.Charts.Add();
    chart.ChartType = xlsModule.ExcelChartType.Doughnut;
    chart.DataRange = sheet.Range.get("A1:B5");
    chart.SeriesDataFromRange = false;

    // Set the chart position
    chart.LeftColumn = 4;
    chart.TopRow = 2;
    chart.RightColumn = 12;
    chart.BottomRow = 22;

    // Configure chart title
    chart.ChartTitle = "Market share by country";
    chart.ChartTitleArea.IsBold = true;
    chart.ChartTitleArea.Size = 12;

    // Show percentage data labels
    for (let i = 0; i < chart.Series.Count; i++) {
      chart.Series.get(i).DataPoints.DefaultDataPoint.DataLabels.HasPercentage = true;
    }

    // Set legend position
    chart.Legend.Position = xlsModule.LegendPositionType.Top;

    // Save the workbook
    const outputFileName = 'CreateDoughnutChart.xlsx';
    workbook.SaveToFile(outputFileName);
    workbook.Dispose();

    // Read the file from VFS and trigger download
    const fileArray = window.dotnetRuntime.Module.FS.readFile(outputFileName);
    const blob = new Blob([fileArray], { type: 'application/vnd.openxmlformats-officedocument.spreadsheetml.sheet' });
    const url = URL.createObjectURL(blob);
    const a = document.createElement('a');
    a.href = url;
    a.download = outputFileName;
    a.click();
    URL.revokeObjectURL(url);
  };

  return (
    <div style={{ textAlign: 'center', height: '300px' }}>
      <h1>Create Doughnut Chart</h1>
      <button onClick={createDoughnutChart}>
        Generate
      </button>
    </div>
  );
}

export default App;
Doughnut chart created with Spire.XLS for JavaScript
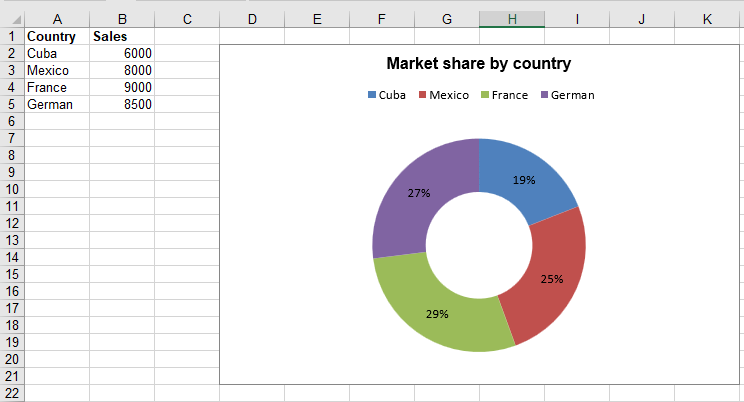
Chart Type Reference
The examples above covered column charts, pie charts, and doughnut charts. In addition, Spire.XLS supports all standard Excel chart types, which are defined in the Spire.Xls.ExcelChartType enumeration. The complete list of 81 chart types is as follows:
| Chart Type | Description |
|---|---|
| 1. ColumnClustered | Represents Clustered Column Chart |
| 2. ColumnStacked | Represents Stacked Column Chart |
| 3. Column100PercentStacked | Represents 100% Stacked Column Chart |
| 4. Column3DClustered | Represents 3D Clustered Column Chart |
| 5. Column3DStacked | Represents 3D Stacked Column Chart |
| 6. Column3D100PercentStacked | Represents 3D 100% Stacked Column Chart |
| 7. Column3D | Represents 3D Column Chart |
| 8. BarClustered | Represents Clustered Bar Chart |
| 9. BarStacked | Represents Stacked Bar Chart |
| 10. Bar100PercentStacked | Represents 100% Stacked Bar Chart |
| 11. Bar3DClustered | Represents 3D Clustered Bar Chart |
| 12. Bar3DStacked | Represents 3D Stacked Bar Chart |
| 13. Bar3D100PercentStacked | Represents 100% 3D Stacked Bar Chart |
| 14. Line | Represents Line Chart |
| 15. LineStacked | Represents Stacked Line Chart |
| 16. Line100PercentStacked | Represents 100% Stacked Line Chart |
| 17. LineMarkers | Represents Markers Line Chart |
| 18. LineMarkersStacked | Represents Stacked Markers Line Chart |
| 19. LineMarkers100PercentStacked | Represents 100% Stacked Markers Line Chart |
| 20. Line3D | Represents 3D Line Chart |
| 21. Pie | Represents Pie Chart |
| 22. Pie3D = 21 | Represents 3D Pie Chart |
| 23. PieOfPie | Represents Pie of Pie chart |
| 24. PieExploded | Represents Exploded Pie Chart |
| 25. Pie3DExploded | Represents 3D Exploded Pie Chart |
| 26. PieBar | Represents Bar Pie Chart |
| 27. ScatterMarkers | Represents Markers Scatter Chart |
| 28. ScatterSmoothedLineMarkers | Represents ScatterSmoothedLineMarkers Chart |
| 29. ScatterSmoothedLine | Represents ScatterSmoothedLine Chart |
| 30. ScatterLineMarkers | Represents ScatterLineMarkers Chart |
| 31. ScatterLine | Represents ScatterLine Chart |
| 32. Area | Represents Area Chart |
| 33. AreaStacked | Represents AreaStacked Chart |
| 34. Area100PercentStacked | Represents Area100PercentStacked Chart |
| 35. Area3D | Represents Area3D Chart |
| 36. Area3DStacked | Represents Area3DStacked Chart |
| 37. Area3D100PercentStacked | Represents Area3D100PercentStacked Chart |
| 38. Doughnut | Represents Doughnut Chart |
| 39. DoughnutExploded | Represents DoughnutExploded Chart |
| 40. Radar | Represents Radar Chart |
| 41. RadarMarkers | Represents RadarMarkers Chart |
| 42. RadarFilled | Represents RadarFilled Chart |
| 43. Surface3D | Represents Surface3D Chart |
| 44. Surface3DNoColor | Represents Surface3DNoColor Chart |
| 45. SurfaceContour | Represents SurfaceContour Chart |
| 46. SurfaceContourNoColor | Represents SurfaceContourNoColor Chart |
| 47. Bubble | Represents Bubble Chart |
| 48. Bubble3D | Represents Bubble3D Chart |
| 49. StockHighLowClose | Represents StockHighLowClose Chart |
| 50. StockOpenHighLowClose | Represents StockOpenHighLowClose Chart |
| 51. StockVolumeHighLowClose | Represents StockVolumeHighLowClose Chart |
| 52. StockVolumeOpenHighLowClose | Represents StockVolumeOpenHighLowClose Chart |
| 53. CylinderClustered | Represents CylinderClustered Chart |
| 54. CylinderStacked | Represents CylinderStacked Chart |
| 55. Cylinder100PercentStacked | Represents Cylinder100PercentStacked Chart |
| 56. CylinderBarClustered | Represents CylinderBarClustered Chart |
| 57. CylinderBarStacked | Represents CylinderBarStacked Chart |
| 58. CylinderBar100PercentStacked | Represents CylinderBar100PercentStacked Chart |
| 59. Cylinder3DClustered | Represents Cylinder3DClustered Chart |
| 60. ConeClustered | Represents ConeClustered Chart |
| 61. ConeStacked | Represents ConeStacked Chart |
| 62. Cone100PercentStacked | Represents Cone100PercentStacked Chart |
| 63. ConeBarClustered | Represents ConeBarClustered Chart |
| 64. ConeBarStacked | Represents ConeBarStacked Chart |
| 65. ConeBar100PercentStacked | Represents ConeBar100PercentStacked Chart |
| 66. Cone3DClustered | Represents Cone3DClustered Chart |
| 67. PyramidClustered | Represents PyramidClustered Chart |
| 68. PyramidStacked | Represents PyramidStacked Chart |
| 69. Pyramid100PercentStacked | Represents Pyramid100PercentStacked Chart |
| 70. PyramidBarClustered | Represents PyramidBarClustered Chart |
| 71. PyramidBarStacked | Represents PyramidBarStacked Chart |
| 72. PyramidBar100PercentStacked | Represents PyramidBar100PercentStacked Chart |
| 73. Pyramid3DClustered | Represents Pyramid3DClustered Chart |
| 74. CombinationChart | Represents Combination Chart |
| 75. Funnel | Represents Funnel Chart |
| 76. WaterFall | Represents Waterfall Chart |
| 77. BoxAndWhisker | Represents Box and Whisker Chart |
| 78. Histogram | Represents Histogram Chart |
| 79. Pareto | Represents Pareto Chart |
| 80. TreeMap | Represents Tree Map Chart |
| 81. SunBurst | Represents Sunburst Chart |
FAQ
How to show values or percentages on pie/doughnut chart labels
Solution: Choose the appropriate label property based on your needs:
// Show value labels
cs.DataPoints.DefaultDataPoint.DataLabels.HasValue = true; // Show value labels
// Or show percentage labels
cs.DataPoints.DefaultDataPoint.DataLabels.HasPercentage = true;
Legend in the generated Excel file is truncated or not fully displayed
Cause: The chart area is too small to accommodate all legend items, or the legend position setting causes overlap with the chart data area.
Solution: Increase the vertical range of the chart or adjust the legend position:
// Increase chart height
chart.BottomRow = 35;
// Or adjust legend position
chart.Legend.Position = xlsModule.LegendPositionType.Bottom;
Get a Free License
Spire.XLS for JavaScript offers a 30-day full-featured free trial license with no functional limitations. Apply here to evaluate before purchasing.
