
Python (365)
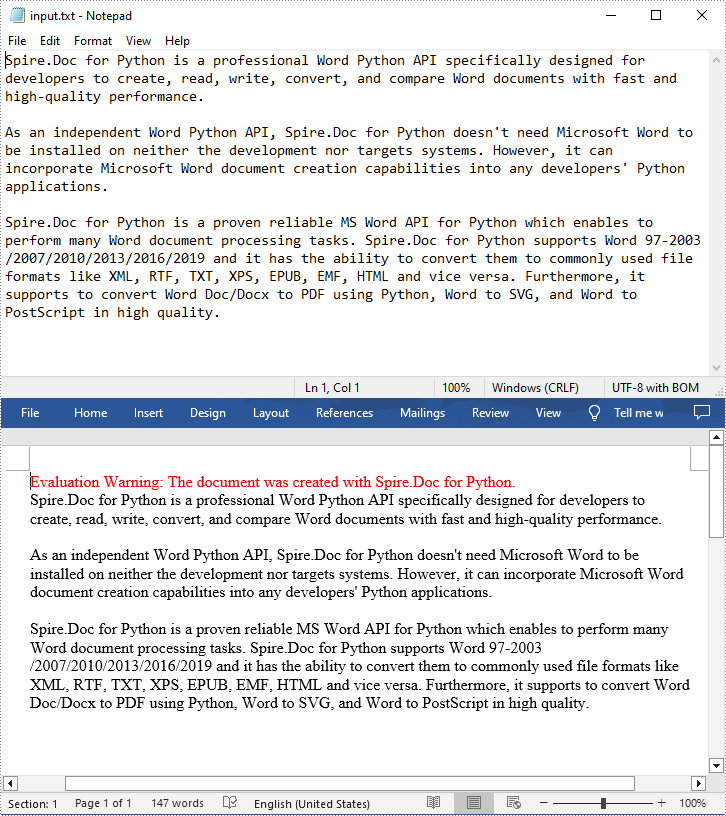
Text files are a common file type that contain only plain text without any formatting or styles. If you want to apply formatting or add images, charts, tables, and other media elements to text files, one of the recommended solutions is to convert them to Word files.
Conversely, if you want to efficiently extract content or reduce the file size of Word documents, you can convert them to text format. This article will demonstrate how to programmatically convert text files to Word format and convert Word files to text format using Spire.Doc for Python.
Install Spire.Doc for Python
This scenario requires Spire.Doc for Python and plum-dispatch v1.7.4. They can be easily installed in your Windows through the following pip commands.
pip install Spire.Doc
If you are unsure how to install, please refer to this tutorial: How to Install Spire.Doc for Python on Windows
Convert Text (TXT) to Word in Python
Conversion from TXT to Word is quite simple that requires only a few lines of code. The following are the detailed steps.
- Create a Document object.
- Load a text file using Document.LoadFromFile(string fileName) method.
- Save the text file as a Word file using Document.SaveToFile(string fileName, FileFormat fileFormat) method.
- Python
from spire.doc import *
from spire.doc.common import *

# Create a Document object
document = Document()

# Load a TXT file
document.LoadFromFile("input.txt")

# Save the TXT file as Word
document.SaveToFile("TxtToWord.docx", FileFormat.Docx2016)
document.Close()
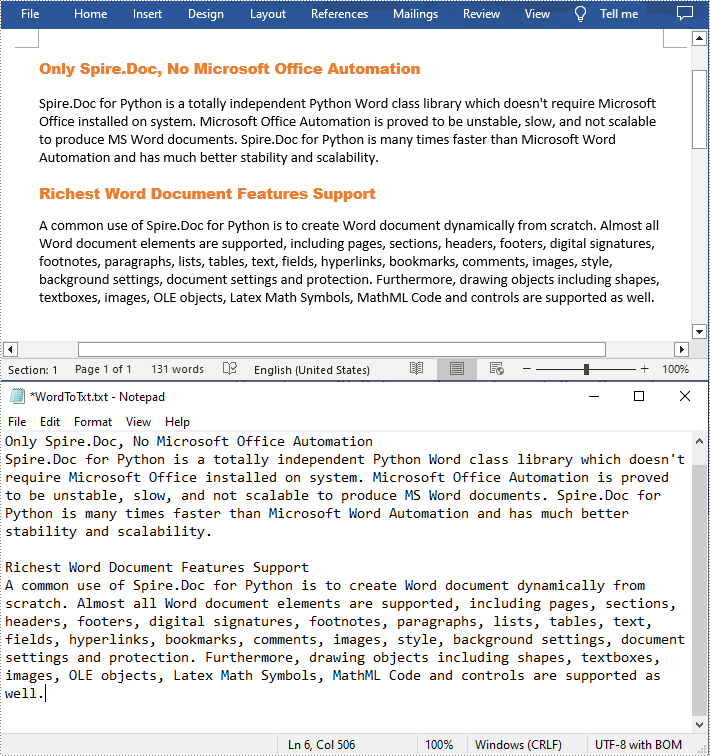
Convert Word to Text (TXT) in Python
The Document.SaveToFile(string fileName, FileFormat.Txt) method provided by Spire.Doc for Python allows you to export a Word file to text format. The following are the detailed steps.
- Create a Document object.
- Load a Word file using Document.LoadFromFile(string fileName) method.
- Save the Word file in txt format using Document.SaveToFile(string fileName, FileFormat.Txt) method.
- Python
from spire.doc import *
from spire.doc.common import *

# Create a Document object
document = Document()

# Load a Word file from disk
document.LoadFromFile("Input.docx")

# Save the Word file in txt format
document.SaveToFile("WordToTxt.txt", FileFormat.Txt)
document.Close()
Get a Free License
To fully experience the capabilities of Spire.Doc for Python without any evaluation limitations, you can request a free 30-day trial license.
Comment in Excel is a function that allows users to add extra details or remarks as explanatory notes. Comments can be in the form of text or images. It enables users to provide additional information to explain or supplement the data in specified cells. After adding a comment, users can view the content of the comment by hovering the mouse over the cell with the comment. This feature enhances the readability and comprehensibility of the document, helping readers better understand and handle the data in Excel. In this article, we will show you how to add comments in Excel by using Spire.XLS for Python.
Install Spire.XLS for Python
This scenario requires Spire.XLS for Python and plum-dispatch v1.7.4. They can be easily installed in your Windows through the following pip command.
pip install Spire.XLS
If you are unsure how to install, please refer to this tutorial: How to Install Spire.XLS for Python on Windows
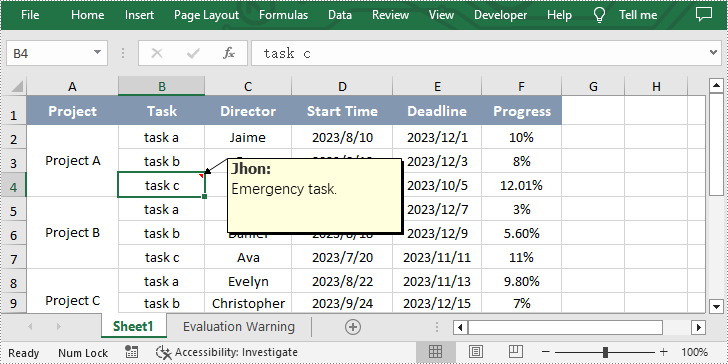
Add Comment with Text in Excel
Spire.XLS for Python allows users to add comment with text in Excel by calling CellRange.AddComment() method. The following are detailed steps.
- Create an object of Workbook class.
- Load an Excel file using Workbook.LoadFromFile() method.
- Get the first worksheet of this file using Workbook.Worksheets[] property.
- Get the specified cell by using Worksheet.Range[] property.
- Set the author and content of the comment and add them to the obtained cell using CellRange.AddComment() method.
- Set the font of the comment.
- Save the result file using Workbook.SaveToFile() method.
- Python
from spire.xls import *
from spire.xls.common import *

inputFile = "sample.xlsx"
outputFile = "CommentWithAuthor.xlsx"

#Create an object of Workbook class
workbook = Workbook()

#Load the sample file from disk
workbook.LoadFromFile(inputFile)

#Get the first worksheet
sheet = workbook.Worksheets[0]

#Get the specified cell
range = sheet.Range["B4"]

#Set the author and content of the comment
author = "Jhon"
text = "Emergency task."

#Add comment to the obtained cell
comment = range.AddComment()
comment.Width = 200
comment.Visible = True
comment.Text = author + ":\n" + text

#Set the font of the comment
font = workbook.CreateFont()
font.FontName = "Tahoma"
font.KnownColor = ExcelColors.Black
font.IsBold = True
comment.RichText.SetFont(0, len(author), font)

#Save the result file
workbook.SaveToFile(outputFile, ExcelVersion.Version2013)
workbook.Dispose()
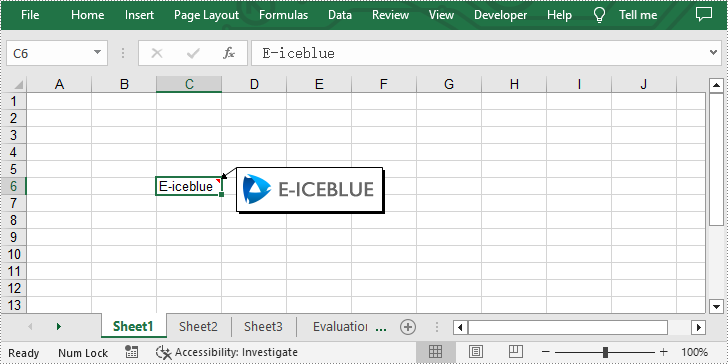
Add Comment with Picture in Excel
Additionally, Spire.XLS for Python also enable users to add comment with picture to the specified cell in Excel by using CellRange.AddComment() and ExcelCommentObject.Fill.CustomPicture() methods. The following are detailed steps.
- Create an object of Workbook class.
- Get the first worksheet using Workbook.Worksheets[] property.
- Get the specified cell by using Worksheet.Range[] property and set text for it.
- Add comment to the obtained cell by using CellRange.AddComment() method.
- Load an image and fill the comment with it by calling ExcelCommentObject.Fill.CustomPicture() method.
- Set the height and width of the comment.
- Save the result file using Workbook.SaveToFile() method.
- Python
from spire.xls import *
from spire.xls.common import *

inputFile = "logo.png"
outputFile = "CommentWithPicture.xlsx"

#Create an object of Workbook class
workbook = Workbook()

#Get the first worksheet
sheet = workbook.Worksheets[0]

#Get the specified cell and set text for it
range = sheet.Range["C6"]
range.Text = "E-iceblue"

#Add comment to the obtained cell
comment = range["C6"].AddComment()

#Load an image file and fill the comment with it
image = Image.FromFile(inputFile)
comment.Fill.CustomPicture(image, "logo.png")

#Set the height and width of the comment
comment.Height = image.Height
comment.Width = image.Width
comment.Visible = True

#Save the result file
workbook.SaveToFile(outputFile, ExcelVersion.Version2010)
workbook.Dispose()
Apply for a Temporary License
If you'd like to remove the evaluation message from the generated documents, or to get rid of the function limitations, please request a 30-day trial license for yourself.
Hyperlinks are a commonly used tool in Excel that facilitates navigation between different sheets, workbooks, websites, or even specific cells within a worksheet. There are instances where you may need to manage hyperlinks in Excel files, such as extracting hyperlinks for further analysis, modifying existing links, or removing them entirely. In this article, we will introduce how to extract, modify, and remove hyperlinks in Excel in Python using Spire.XLS for Python.
- Extract Hyperlinks from Excel in Python
- Modify Hyperlinks in Excel in Python
- Remove Hyperlinks from Excel in Python
Install Spire.XLS for Python
This scenario requires Spire.XLS for Python and plum-dispatch v1.7.4. They can be easily installed in your Windows through the following pip command.
pip install Spire.XLS
If you are unsure how to install, please refer to this tutorial: How to Install Spire.XLS for Python on Windows
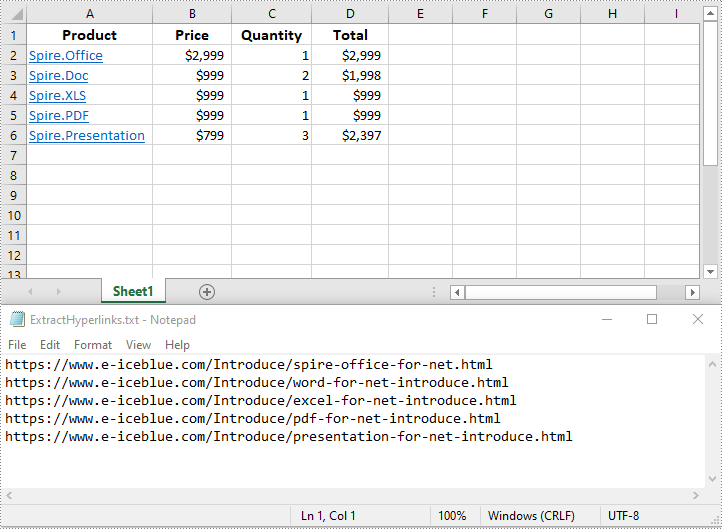
Extract Hyperlinks from Excel in Python
Extracting hyperlinks from an Excel worksheet can be beneficial when you need to analyze or export the link data for further processing.
The following steps demonstrate how to extract hyperlinks from an Excel worksheet in Python using Spire.XLS for Python:
- Create a Workbook object.
- Load an Excel file using Workbook.LoadFromFile() method.
- Get a specific worksheet using Workbook.Worksheets[] property.
- Get the collection of all hyperlinks in the worksheet using Worksheet.HyperLinks property.
- Create an empty list to store the extracted hyperlink information.
- Loop through the hyperlinks in the hyperlink collection.
- Get the address of each hyperlink using XlsHyperlink.Address property and append the address to the list.
- Write the addresses in the list into a text file.
- Python
from spire.xls import *
from spire.xls.common import *

# Create a Workbook object
workbook = Workbook()
# Load an Excel file
workbook.LoadFromFile("Hyperlinks.xlsx")

# Get the first worksheet of the file
sheet = workbook.Worksheets[0]

# Get the hyperlink collection of the worksheet
links = sheet.HyperLinks

# Create an empty list to store the extracted hyperlinks
list = []

# Loop through the hyperlinks in the hyperlink collection
for link in links:
    # Get the address of each hyperlink
    address = link.Address
    # Append the address to the list
    list.append(address)

# Write the extracted hyperlink addresses to a text file
with open("ExtractHyperlinks.txt", "w", encoding = "utf-8") as file:
    for item in list:
        file.write(item + "\n")

workbook.Dispose()
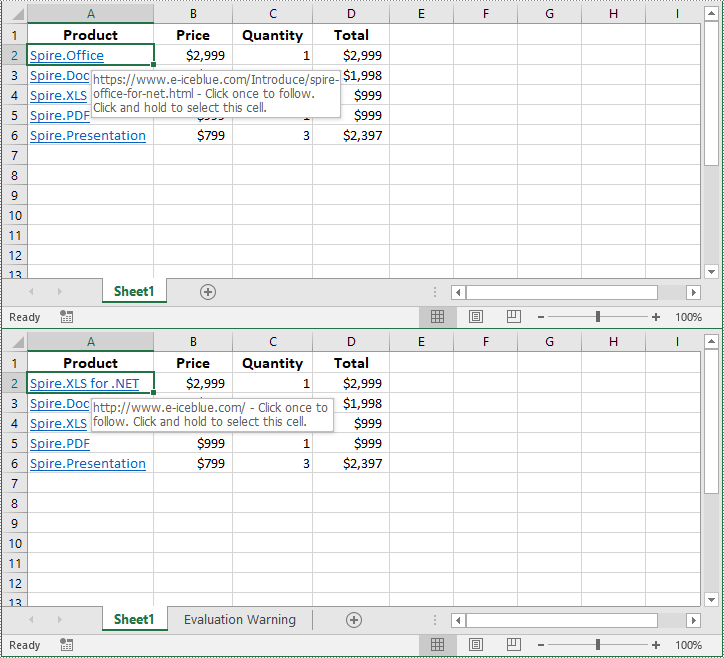
Modify Hyperlinks in Excel in Python
Modifying hyperlinks allows you to update URLs or alter the display text to suit your needs.
The following steps demonstrate how to modify an existing hyperlink in an Excel worksheet in Python using Spire.XLS for Python:
- Create a Workbook object.
- Load an Excel file using Workbook.LoadFromFile() method.
- Get a specific worksheet using Workbook.Worksheets[] property.
- Get a specific hyperlink in the worksheet using Worksheet.HyperLinks[] property.
- Modify the display text and address of the hyperlink using XlsHyperlink.TextToDisplay and XlsHyperlink.Address properties.
- Save the resulting file using Workbook.SaveToFile() method.
- Python
from spire.xls import *
from spire.xls.common import *

# Create a Workbook object
workbook = Workbook()
# Load an Excel file
workbook.LoadFromFile("Hyperlinks.xlsx")

# Get the first worksheet of the file
sheet = workbook.Worksheets[0]

# Get the first hyperlink in the worksheet
link = sheet.HyperLinks[0]

# Change the display text of the hyperlink
link.TextToDisplay = "Spire.XLS for .NET"
# Change the address of the hyperlink
link.Address = "http://www.e-iceblue.com"

# Save the resulting file
workbook.SaveToFile("ModifyHyperlink.xlsx", ExcelVersion.Version2016)

workbook.Dispose()
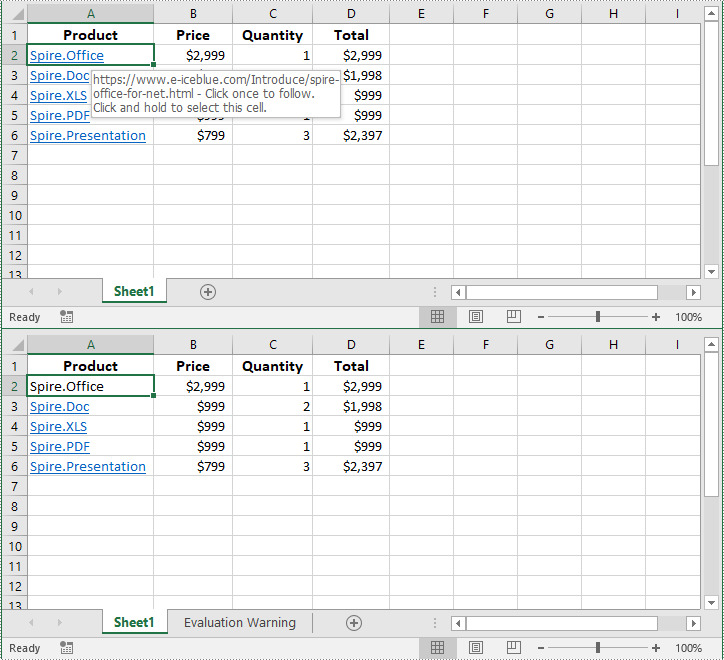
Remove Hyperlinks from Excel in Python
Removing hyperlinks can help eliminate unnecessary links and clean up your spreadsheet.
The following steps demonstrate how to remove a specific hyperlink from an Excel worksheet in Python using Spire.XLS for Python:
- Create a Workbook object.
- Load an Excel file using Workbook.LoadFromFile() method.
- Get a specific worksheet using Workbook.Worksheets[] property.
- Remove a specific hyperlink from the worksheet using Worksheet.Hyperlinks.RemoveAt() method.
- Save the resulting file using Workbook.SaveToFile() method.
- Python
from spire.xls import *
from spire.xls.common import *

# Create a Workbook object
workbook = Workbook()
# Load an Excel file
workbook.LoadFromFile("Hyperlinks.xlsx")

# Get the first worksheet of the file
sheet = workbook.Worksheets[0]

# Remove the first hyperlink and keep its display text
sheet.HyperLinks.RemoveAt(0)

# Save the resulting file
workbook.SaveToFile("RemoveHyperlink.xlsx", ExcelVersion.Version2016)

workbook.Dispose()
Apply for a Temporary License
If you'd like to remove the evaluation message from the generated documents, or to get rid of the function limitations, please request a 30-day trial license for yourself.
By extracting text from Word documents, you can effortlessly obtain the written information contained within them. This allows for easier manipulation, analysis, and organization of textual content, enabling tasks such as text mining, sentiment analysis, and natural language processing. Extracting images, on the other hand, provides access to visual elements embedded within Word documents, which can be crucial for tasks like image recognition, content extraction, or creating image databases. In this article, you will learn how to extract text and images from a Word document in Python using Spire.Doc for Python.
- Extract Text from a Specific Paragraph in Python
- Extract Text from an Entire Word Document in Python
- Extract Images from an Entire Word Document in Python
Install Spire.Doc for Python
This scenario requires Spire.Doc for Python and plum-dispatch v1.7.4. They can be easily installed in your Windows through the following pip command.
pip install Spire.Doc
If you are unsure how to install, please refer to this tutorial: How to Install Spire.Doc for Python on Windows
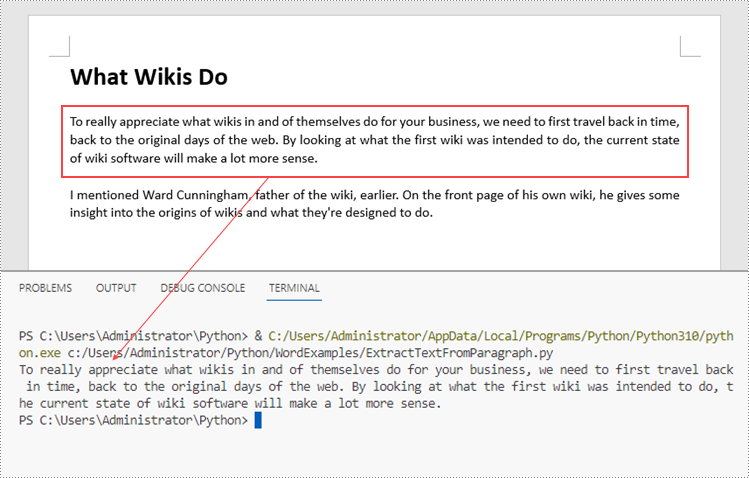
Extract Text from a Specific Paragraph in Python
To get a certain paragraph from a section, use Section.Paragraphs[index] property. Then, you can get the text of the paragraph through Paragraph.Text property. The detailed steps are as follows.
- Create a Document object.
- Load a Word file using Document.LoadFromFile() method.
- Get a specific section through Document.Sections[index] property.
- Get a specific paragraph through Section.Paragraphs[index] property.
- Get text from the paragraph through Paragraph.Text property.
- Python
from spire.doc import *
from spire.doc.common import *

# Create a Document object
doc = Document()

# Load a Word document
doc.LoadFromFile("C:\\Users\\Administrator\\Desktop\\input.docx")

# Get a specific section
section = doc.Sections.get_Item(0)

# Get a specific paragraph
paragraph = section.Paragraphs.get_Item(2)

# Get text from the paragraph
str = paragraph.Text

# Print result
print(str)
Extract Text from an Entire Word Document in Python
If you want to get text from a whole document, you can simply use Document.GetText() method. Below are the steps.
- Create a Document object.
- Load a Word file using Document.LoadFromFile() method.
- Get text from the document using Document.GetText() method.
- Python
from spire.doc import *
from spire.doc.common import *

# Create a Document object
doc = Document()

# Load a Word file
doc.LoadFromFile("C:\\Users\\Administrator\\Desktop\\input.docx")

# Get text from the entire document
str = doc.GetText()

# Print result
print(str)

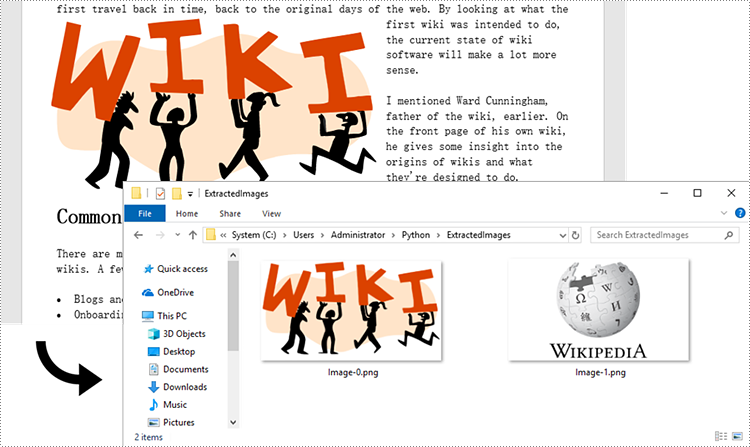
Extract Images from an Entire Word Document in Python
Spire.Doc for Python does not provide a straightforward method to get images from a Word document. You need to iterate through the child objects in the document, and determine if a certain a child object is a DocPicture. If yes, you get the image data using DocPicture.ImageBytes property and then save it as a popular image format file. The main steps are as follows.
- Create a Document object.
- Load a Word file using Document.LoadFromFile() method.
- Loop through the child objects in the document.
- Determine if a specific child object is a DocPicture. If yes, get the image data through DocPicture.ImageBytes property.
- Write the image data as a PNG file.
- Python
import queue
from spire.doc import *
from spire.doc.common import *

# Create a Document object
doc = Document()

# Load a Word file
doc.LoadFromFile("C:\\Users\\Administrator\\Desktop\\input.docx")

# Create a Queue object
nodes = queue.Queue()
nodes.put(doc)

# Create a list
images = []

while nodes.qsize() > 0:
    node = nodes.get()

    # Loop through the child objects in the document
    for i in range(node.ChildObjects.Count):
        child = node.ChildObjects.get_Item(i)

        # Determine if a child object is a picture
        if child.DocumentObjectType == DocumentObjectType.Picture:
            picture = child if isinstance(child, DocPicture) else None
            dataBytes = picture.ImageBytes

            # Add the image data to the list
            images.append(dataBytes)

        elif isinstance(child, ICompositeObject):
            nodes.put(child if isinstance(child, ICompositeObject) else None)

# Loop through the images in the list
for i, item in enumerate(images):
    fileName = "Image-{}.png".format(i)
    with open("ExtractedImages/"+fileName,'wb') as imageFile:

        # Write the image to a specified path
        imageFile.write(item)
doc.Close()
Apply for a Temporary License
If you'd like to remove the evaluation message from the generated documents, or to get rid of the function limitations, please request a 30-day trial license for yourself.
How to Convert PDF to Excel with Formatting in Python (Step-by-Step Guide)
2023-09-07 01:11:29 Written by Koohji
Converting PDF files to Excel spreadsheets in Python is an effective way to extract structured data for analysis, reporting, and automation. While PDFs are excellent for preserving layout across platforms, their static format often makes data extraction challenging.
Excel, on the other hand, provides robust features for sorting, filtering, calculating, and visualizing data. By using Python along with the Spire.PDF for Python library, you can automate the entire PDF to Excel conversion process — from basic one-page documents to complex, multi-page PDFs.
Whether you're automating data extraction from PDFs or integrating PDF content into Excel workflows, this tutorial will walk you through both quick-start and advanced methods for reliable Python PDF to Excel conversion.
Table of Contents
- Why Convert PDF to Excel Programmatically in Python
- Setting Up Your Development Environment
- Quick Start: Convert PDF to Excel in Python
- Advanced PDF to Excel Conversion with Layout Control and Formatting Options
- Conclusion
Why Convert PDF to Excel Programmatically in Python
PDFs are ideal for sharing documents with consistent formatting, but their fixed structure makes them difficult to analyze or reuse, especially if they contain tables.
Converting PDF to Excel allows you to:
- Extract tabular data for analysis or visualization
- Automate monthly or recurring report extraction
- Enable downstream processing in Excel
- Save hours of manual copy-pasting
Using Python for this task adds automation, flexibility, and scalability — ideal for integration into data pipelines or backend services.
Setting Up Your Development Environment
Before you start converting PDF files to Excel using Python, it’s essential to set up your development environment properly. This ensures you have all the necessary tools and libraries installed to follow the tutorial smoothly.
Install Python
If you haven’t already installed Python on your system, download and install the latest version from the official website.
Make sure to add Python to your system PATH during installation to run Python commands from the terminal or command prompt easily.
Install Spire.PDF for Python
Spire.PDF for Python is the core library used in this tutorial to load, manipulate, and convert PDF documents.
To install it, open your terminal and run:
pip install Spire.PDF
This command downloads and installs Spire.PDF along with any required dependencies.
If you encounter any issues or need detailed installation help, please refer to our step-by-step guide: How to Install Spire.PDF for Python on Windows
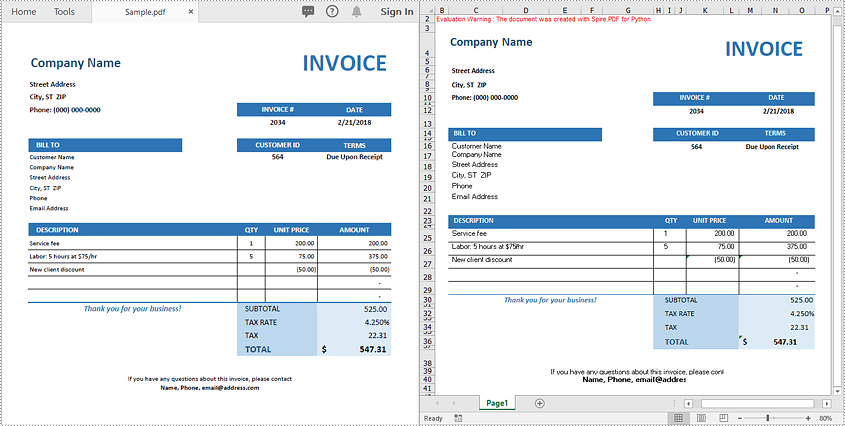
Quick Start: Convert PDF to Excel in Python
If your PDF has a clean and simple layout without complex formatting or multiple page structures, you can convert it directly to Excel with just 3 lines of code using Spire.PDF for Python.
Steps to Quickly Export PDF to Excel
Follow these straightforward steps to export your PDF file to an Excel spreadsheet in Python:
- Import the required classes.
- Create a PdfDocument object.
- Load your PDF file with the LoadFromFile method.
- Export the PDF to Excel (.xlsx) format using the SaveToFile method and specify FileFormat.XLSX as the output format.
Code Example
from spire.pdf import *

# Create a PdfDocument object
pdf = PdfDocument()

# Load your PDF file
pdf.LoadFromFile("Sample.pdf")

# Convert and save the PDF to Excel
pdf.SaveToFile("output.xlsx", FileFormat.XLSX)

# Close the document
pdf.Close()
Advanced PDF to Excel Conversion with Layout Control and Formatting Options
For more complex PDF documents—such as those containing multiple pages, rotated text, table cells with multiple lines of text, or overlapping content - you can use the XlsxLineLayoutOptions class to gain precise control over the conversion process.
This allows you to preserve the original structure and formatting of your PDF more accurately when exporting to Excel.
Layout Options You Can Configure
The XlsxLineLayoutOptions class in Spire.PDF provides several properties that give you granular control over how PDF content is exported to Excel. Below is a breakdown of each option and its behavior:
| Option | Description |
|---|---|
| convertToMultipleSheet | Determines whether to convert each PDF page into a separate worksheet. The default value is true. |
| rotatedText | Specifies whether to preserve the original rotation of angled text. The default value is true. |
| splitCell | Determines whether to split a PDF table cell with multiple lines of text into separate rows in the Excel output. The default value is true. |
| wrapText | Determines whether to enable word wrap inside Excel cells. The default value is true. |
| overlapText | Specifies whether text overlapping in the original PDF should be preserved in the Excel output. The default value is false. |
Code Example
from spire.pdf import *

# Create a PdfDocument object
pdf = PdfDocument()

# Load your PDF file
pdf.LoadFromFile("Sample.pdf")

# Define layout options
# Parameters: convertToMultipleSheet, rotatedText, splitCell, wrapText, overlapText
layout_options = XlsxLineLayoutOptions(True, True, False, True, False)

# Apply layout options
pdf.ConvertOptions.SetPdfToXlsxOptions(layout_options)

# Convert and save the PDF to Excel
pdf.SaveToFile("advanced_output.xlsx", FileFormat.XLSX)

# Close the document
pdf.Close()
Conclusion
Converting PDF files to Excel in Python is an efficient way to automate data extraction and processing tasks. Whether you need a quick conversion or fine-grained layout control, Spire.PDF for Python offers flexible options that scale from simple to complex scenarios.
Ready to automate your PDF to Excel conversions?
Get a free trial license for Spire.PDF for Python and explore the full Spire.PDF Documentation to get started today!
FAQs
Q1: Can I convert each PDF page into a separate Excel worksheet?
A1: Yes. Use the convertToMultipleSheet=True option in the XlsxLineLayoutOptions class to export each page to its own sheet.
Q2. What Excel format does Spire.PDF export to?
A2: Spire.PDF converts PDFs to .xlsx, the modern Excel format supported by Excel 2007 and later.
Q3: Can I convert a PDF to Excel in Python without losing formatting?
A3: Yes. Using Spire.PDF for Python, you can retain the original formatting, including merged cells, cell background colors, and other format settings when saving PDFs to Excel.
Q4: Can I extract only a specific table from a PDF to Excel instead of converting the whole document?
A4: Yes, Spire.PDF for Python supports extracting specific tables from PDF files. You can then write the extracted table data to Excel using our Excel processing library - Spire.XLS for Python.
Merging PDF files is a common task in many applications, from combining report sections to creating comprehensive document collections. For developers, using Python to merge PDF files programmatically can significantly streamline the process and help build automated workflows.
This article explores how to merge PDFs in Python using Spire.PDF for Python - a robust library designed for efficient PDF manipulation.
Table of Contents:
- 5 Reasons Why You Should Use Python to Combine PDFs
- Step-by-Step: Merge PDF Files in Python
- Advanced: Merge Selected Pages from PDFs in Python
- Batch Processing: Merge Multiple PDF Files in a Folder
- Frequently Asked Questions
- Conclusion
5 Reasons Why You Should Use Python to Combine PDFs
While GUI tools like Adobe Acrobat offer PDF merging capabilities, Python provides distinct advantages for developers and enterprises. Python’s PDF merging feature shines when you need to:
- Process documents in bulk
- Schedule scripts to run automatically (e.g., daily report merging).
- Integrate with data workflows
- Implement business-specific logic
- Deploy in server/cloud environments
Step-by-Step: Merge PDF Files in Python
Step 1: Install Spire.PDF for Python
Before you can start combining PDFs with Spire.PDF for Python, you need to install the library. You can do this using pip, the Python package manager. Open your terminal and run the following command:
pip install Spire.PDF
Step 2: Merge Multiple PDF Files into One
Now, let's dive into the Python code for merging multiple PDF files into a single PDF.
1. Import the Required Classes
First, import the necessary classes from the Spire.PDF library:
from spire.pdf.common import *
from spire.pdf import *
2. Define Paths of PDFs to Merge
Define three PDF file paths and stored them in a list. You can modify these paths or adjust the number of files according to your needs.
inputFile1 = "Sample1.pdf"
inputFile2 = "Sample2.pdf"
inputFile3 = "Sample3.pdf"
files = [inputFile1, inputFile2, inputFile3]
3. Merge PDF Files
The MergeFiles() method combines all PDFs in the list into a new PDF document object.
pdf = PdfDocument.MergeFiles(files)
4. Save the Merged PDF Finally, save the combined PDF to a specified output path.
pdf.Save("output/MergePDF.pdf", FileFormat.PDF)
Full Python Code to Combine PDFs:
from spire.pdf.common import *
from spire.pdf import *

# Create a list of the PDF file paths
inputFile1 = "Sample1.pdf"
inputFile2 = "Sample2.pdf"
inputFile3 = "Sample3.pdf"
files = [inputFile1, inputFile2, inputFile3]

# Merge the PDF documents
pdf = PdfDocument.MergeFiles(files)

# Save the result document
pdf.Save("output/MergePDF.pdf", FileFormat.PDF)
pdf.Close()
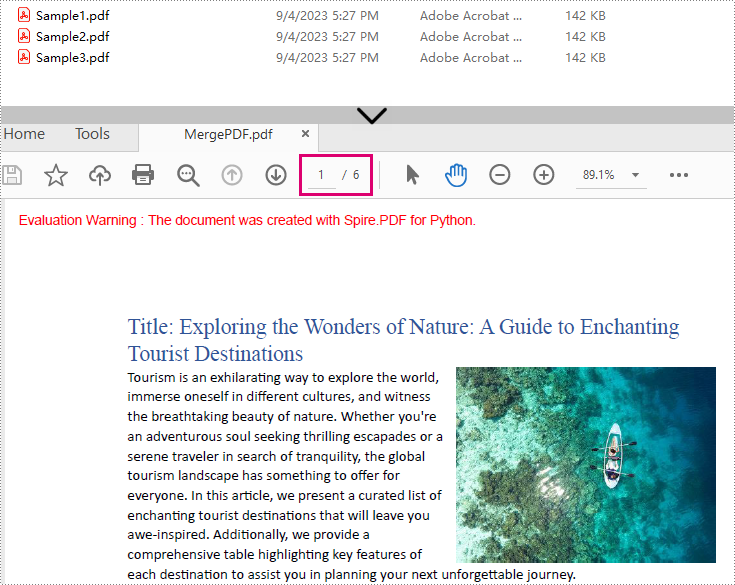
Result: Combine three PDF files (total of 6 pages) into one PDF file.
Advanced: Merge Selected Pages from PDFs in Python
In some cases, you may only want to merge specific pages of multiple PDFs. Spire.PDF for Python makes this easy by allowing you to select pages from different PDF documents and insert them into a new PDF file.
from spire.pdf import *
from spire.pdf.common import *

# Create a list of the PDF file paths
file1 = "Sample1.pdf"
file2 = "Sample2.pdf"
file3 = "Sample3.pdf"
files = [file1, file2, file3]

# Load each PDF file as an PdfDocument object and add them to a list
pdfs = []
for file in files:
    pdfs.append(PdfDocument(file))

# Create an object of PdfDocument class
newPdf = PdfDocument()

# Insert the selected pages from the loaded PDF documents into the new document
newPdf.InsertPage(pdfs[0], 0)
newPdf.InsertPage(pdfs[1], 1)
newPdf.InsertPageRange(pdfs[2], 0, 1)

# Save the new PDF document
newPdf.SaveToFile("output/SelectedPages.pdf")
Explanation:
- PdfDocument(): Initializes a new PDF document object.
- InsertPage(): Insert a specified page to the new PDF (Page index starts at 0).
- InsertPageRange(): Inserts a range of pages to the new PDF.
- SaveToFile(): Save the combined PDF to the specified output path.
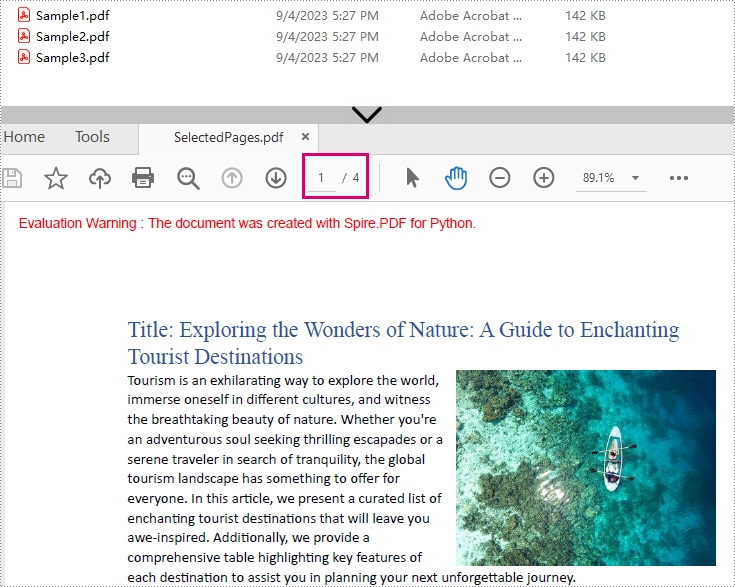
Result: Combine selected pages from three separate PDF files into a new PDF.
Batch Processing: Merge Multiple PDF Files in a Folder
The Python script loops through each source PDF in a specified folder, then appends all pages from the source PDFs to a new PDF file.
import os
from spire.pdf.common import *
from spire.pdf import *

# Specify the directory where the source PDFs are stored
folder = "pdf_folder/"

# Create a new PDF to hold the combined content.
merged_pdf = PdfDocument()

# Loop through each source PDF
for file in os.listdir(folder):
    if file.endswith(".pdf"):
        pdf = PdfDocument(os.path.join(folder, file))
        # Appends all pages from each source PDF to the new PDF
        merged_pdf.AppendPage(pdf)
        pdf.Close()  # Close source PDF

# Save the merged PDF after processing all files
merged_pdf.SaveToFile("BatchCombinePDFs.pdf")
merged_pdf.Close()  # Release resources
Frequently Asked Questions
Q1: Is Spire.PDF for Python free?
A: Spire.PDF for Python offers a 30-day free trial with full features. There’s also a free version available but with page limits.
Q2: Can I merge scanned/image-based PDFs?
A: Yes, Spire.PDF handles image-only PDFs. However, OCR/text extraction requires the Spire.OCR for Python library.
Q3: How to add page numbers to the merged PDF?
A: Refer to this comprehensive guide: Add Page Numbers to PDF in Python
Q4: How to reduce the size of the merged PDF?
A: You can compress the high-resolution images and fonts contained in the merged PDF file. A related tutorial: Compress PDF Documents in Python.
Conclusion
Merging PDFs with Python doesn't have to be a complex task. With Spire.PDF for Python, you can efficiently combine multiple PDF files into a single document with just a few lines of code. Whether you need to merge entire documents, specific pages, or a batch merge, this guide outlines step-by-step instructions to help you automate the PDF merging process.
Explore Spire.PDF's online documentation for more PDF prcessing features with Python.
Creating, reading, and updating Word documents is a common need for many developers working with the Python programming language. Whether it's generating reports, manipulating existing documents, or automating document creation processes, having the ability to work with Word documents programmatically can greatly enhance productivity and efficiency. In this article, you will learn how to create, read, or update Word documents in Python using Spire.Doc for Python.
- Create a Word Document from Scratch in Python
- Read Text of a Word Document in Python
- Update a Word Document in Python
Install Spire.Doc for Python
This scenario requires Spire.Doc for Python and plum-dispatch v1.7.4. They can be easily installed in your Windows through the following pip command.
pip install Spire.Doc
If you are unsure how to install, please refer to this tutorial: How to Install Spire.Doc for Python on Windows
Create a Word Document from Scratch in Python
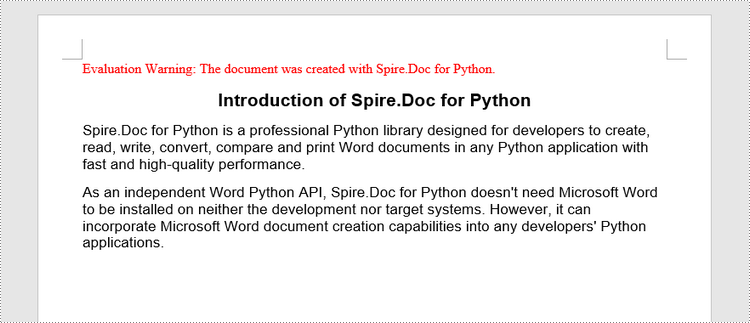
Spire.Doc for Python offers the Document class to represent a Word document model. A document must contain at least one section (represented by the Section class) and each section is a container for various elements such as paragraphs, tables, charts, and images. This example shows you how to create a simple Word document containing several paragraphs using Spire.Doc for Python.
- Create a Document object.
- Add a section using Document.AddSection() method.
- Set the page margins through Section.PageSetUp.Margins property.
- Add several paragraphs to the section using Section.AddParagraph() method.
- Add text to the paragraphs using Paragraph.AppendText() method.
- Create a ParagraphStyle object, and apply it to a specific paragraph using Paragraph.ApplyStyle() method.
- Save the document to a Word file using Document.SaveToFile() method.
- Python
from spire.doc import *
from spire.doc.common import *

# Create a Document object
doc = Document()

# Add a section
section = doc.AddSection()

# Set the page margins
section.PageSetup.Margins.All = 40

# Add a title
titleParagraph = section.AddParagraph()
titleParagraph.AppendText("Introduction of Spire.Doc for Python")

# Add two paragraphs
bodyParagraph_1 = section.AddParagraph()
bodyParagraph_1.AppendText("Spire.Doc for Python is a professional Python library designed for developers to " +
                           "create, read, write, convert, compare and print Word documents in any Python application " +
                           "with fast and high-quality performance.")

bodyParagraph_2 = section.AddParagraph()
bodyParagraph_2.AppendText("As an independent Word Python API, Spire.Doc for Python doesn't need Microsoft Word to " +
                           "be installed on neither the development nor target systems. However, it can incorporate Microsoft Word " +
                           "document creation capabilities into any developers' Python applications.")

# Apply heading1 to the title
titleParagraph.ApplyStyle(BuiltinStyle.Heading1)

# Create a style for the paragraphs
style2 = ParagraphStyle(doc)
style2.Name = "paraStyle"
style2.CharacterFormat.FontName = "Arial"
style2.CharacterFormat.FontSize = 13
doc.Styles.Add(style2)
bodyParagraph_1.ApplyStyle("paraStyle")
bodyParagraph_2.ApplyStyle("paraStyle")

# Set the horizontal alignment of the paragraphs
titleParagraph.Format.HorizontalAlignment = HorizontalAlignment.Center
bodyParagraph_1.Format.HorizontalAlignment = HorizontalAlignment.Left
bodyParagraph_2.Format.HorizontalAlignment = HorizontalAlignment.Left

# Set the after spacing
titleParagraph.Format.AfterSpacing = 10
bodyParagraph_1.Format.AfterSpacing = 10

# Save to file
doc.SaveToFile("output/WordDocument.docx", FileFormat.Docx2019)
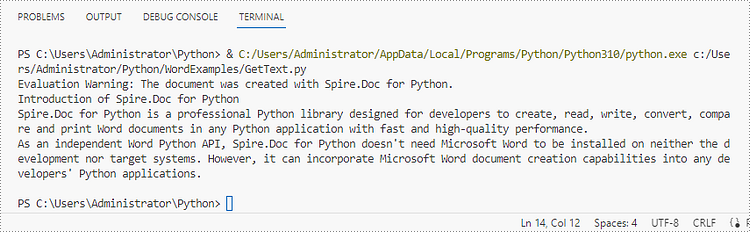
Read Text of a Word Document in Python
To get the text of an entire Word document, you could simply use Document.GetText() method. The following are the detailed steps.
- Create a Document object.
- Load a Word document using Document.LoadFromFile() method.
- Get text from the entire document using Document.GetText() method.
- Python
from spire.doc import *
from spire.doc.common import *

# Create a Document object
doc = Document()

# Load a Word file
doc.LoadFromFile("C:\\Users\\Administrator\\Desktop\\WordDocument.docx")

# Get text from the entire document
text = doc.GetText()

# Print text
print(text)
Update a Word Document in Python
To access a specific paragraph, you can use the Section.Paragraphs[index] property. If you want to modify the text of the paragraph, you can reassign text to the paragraph through the Paragraph.Text property. The following are the detailed steps.
- Create a Document object.
- Load a Word document using Document.LoadFromFile() method.
- Get a specific section through Document.Sections[index] property.
- Get a specific paragraph through Section.Paragraphs[index] property.
- Change the text of the paragraph through Paragraph.Text property.
- Save the document to another Word file using Document.SaveToFile() method.
- Python
from spire.doc import *
from spire.doc.common import *
# Create a Document object
doc = Document()
# Load a Word file
doc.LoadFromFile("C:\\Users\\Administrator\\Desktop\\WordDocument.docx")
# Get a specific section
section = doc.Sections.get_Item(0)
# Get a specific paragraph
paragraph = section.Paragraphs.get_Item(1)
# Change the text of the paragraph
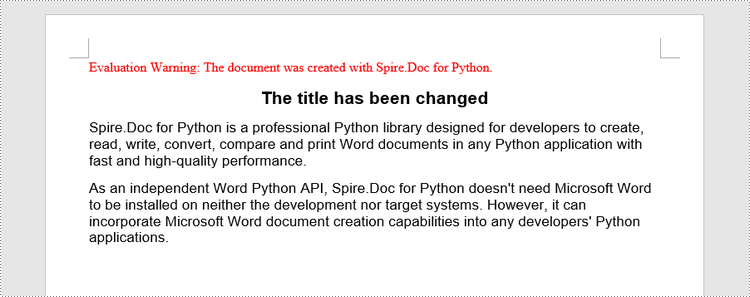
paragraph.Text = "The title has been changed"
# Save to file
doc.SaveToFile("output/Updated.docx", FileFormat.Docx2019)
Apply for a Temporary License
If you'd like to remove the evaluation message from the generated documents, or to get rid of the function limitations, please request a 30-day trial license for yourself.
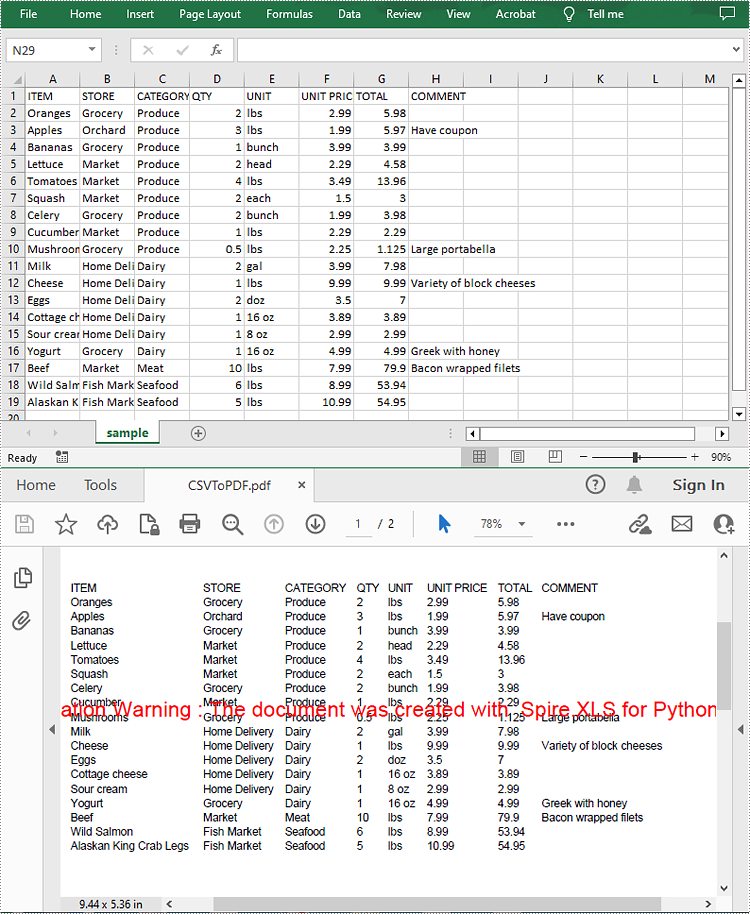
A CSV (Comma-Separated Values) file is a plain text file used to store tabular data. Although CSV files are widely supported by spreadsheet programs, there may still be times when you need to convert them to PDF files to ensure broader accessibility and also enable security features. This article will demonstrate how to convert CSV to PDF in Python using Spire.XLS for Python.
Install Spire.XLS for Python
This scenario requires Spire.XLS for Python and plum-dispatch v1.7.4. They can be easily installed in your Windows through the following pip command.
pip install Spire.XLS
If you are unsure how to install, please refer to this tutorial: How to Install Spire.XLS for Python on Windows
Convert CSV to PDF in Python
The Workbook.SaveToFile() method provided by Spire.XLS for Python allows to save a CSV file as a PDF file. The following are the detailed steps.
- Create a Workbook object.
- Load a CSV file using Workbook.LoadFromFile() method.
- Set the Workbook.ConverterSetting.SheetFitToPage property as true to ensure the worksheet is rendered to one PDF page.
- Get the first worksheet in the Workbook using Workbook.Worksheets[] property.
- Loop through the columns in the worksheet and auto-fit the width of each column using Worksheet.AutoFitColumn() method.
- Convert the CSV file to PDF using Workbook.SaveToFile() method.
- Python
from spire.xls import *
from spire.xls.common import *

# Create a Workbook object
workbook = Workbook()

# Load a CSV file
workbook.LoadFromFile("sample.csv", ",", 1, 1)

# Set the SheetFitToPage property as true
workbook.ConverterSetting.SheetFitToPage = True

# Get the first worksheet
sheet = workbook.Worksheets[0]

# Autofit columns in the worksheet
i = 1
while i < sheet.Columns.Length:
    sheet.AutoFitColumn(i)
    i += 1

# Save the CSV file to PDF
workbook.SaveToFile("CSVToPDF.pdf", FileFormat.PDF)
workbook.Dispose()
Apply for a Temporary License
If you'd like to remove the evaluation message from the generated documents, or to get rid of the function limitations, please request a 30-day trial license for yourself.
A watermark is a semitransparent text or an image placed behind the content of a document. In Word, you can add a watermark to protect the intellectual property of the document, for example to include a copyright symbol, author's name or company logo. Or you can use it to indicate the status of a document, such as "Draft", "Confidential", or "Final". This article will demonstrate how to add text watermarks and image watermarks to Word in Python using Spire.Doc for Python.
Install Spire.Doc for Python
This scenario requires Spire.Doc for Python and plum-dispatch v1.7.4. They can be easily installed in your Windows through the following pip commands.
pip install Spire.Doc
If you are unsure how to install, please refer to this tutorial: How to Install Spire.Doc for Python on Windows
Add a Text Watermark to a Word Document in Python
Spire.Doc for Python provides the TextWatermark class to set a text watermark, and then you can add it to Word document through Document.Watermark property. The following are the detailed steps.
- Create a Document object.
- Load a sample Word document using Document.LoadFromFile() method.
- Create an instance of TextWatermark class.
- Set the text, font size, color and layout of the text watermark using the methods of TextWatermark class.
- Add the text watermark to the Word document using Document.Watermark property.
- Save the result document using Document.SaveToFile() method.
- Python
from spire.doc import *
from spire.doc.common import *
# Create a Document object
document = Document()
# Load a Word document
document.LoadFromFile("test.docx")
# Create a TextWatermark object
txtWatermark = TextWatermark()
# Set the format of the text watermark
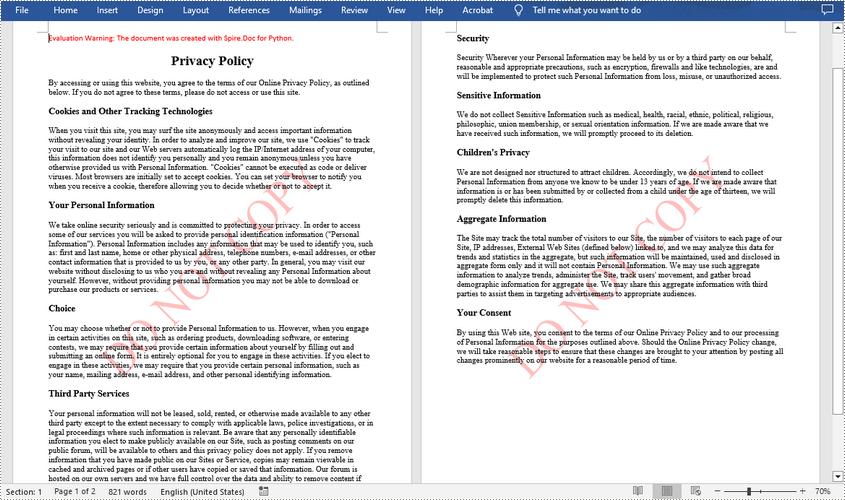
txtWatermark.Text = "DO NOT COPY"
txtWatermark.FontSize = 65
txtWatermark.Color = Color.get_Red()
txtWatermark.Layout = WatermarkLayout.Diagonal
# Add the text watermark to document
document.Watermark = txtWatermark
#Save the result document
document.SaveToFile("Output/TextWatermark.docx", FileFormat.Docx)
document.Close()
Add an Image Watermark in a Word Document in Python
To set the image watermark, you can use the methods of PictureWatermark class. The following are the detailed steps.
- Create a Document object.
- Load a sample Word document using Document.LoadFromFile() method.
- Create an instance of PictureWatermark class.
- Load an image as the image watermark using PictureWatermark.SetPicture() method, and then set scaling as well as washout property of the image watermark.
- Add the image watermark to the Word document using Document.Watermark property.
- Save the result document using Document.SaveToFile() method.
- Python
from spire.doc import *
from spire.doc.common import *
# Create a Document object
document = Document()
# Load a Word document
document.LoadFromFile("test.docx")
# Create a PictureWatermark object
picture = PictureWatermark()
# Set the format of the picture watermark
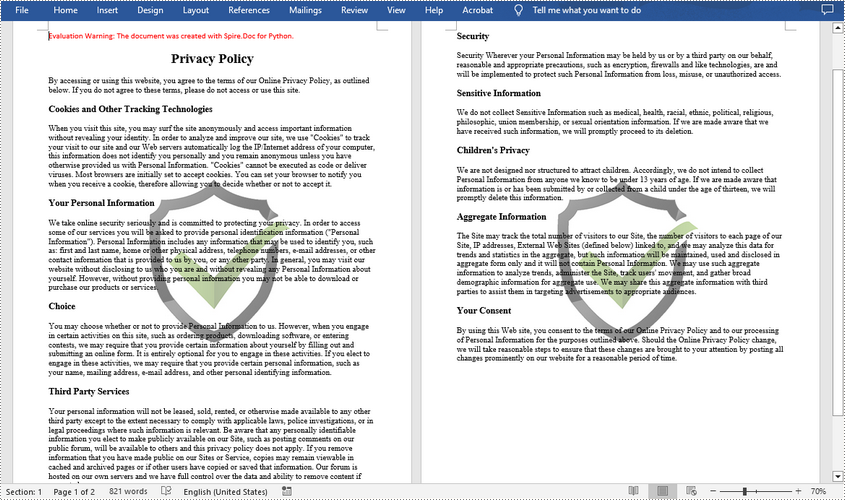
picture.SetPicture("logo.png")
picture.Scaling = 100
picture.IsWashout = False
# Add the image watermark to document
document.Watermark = picture
#Save the result document
document.SaveToFile("Output/ImageWatermark.docx", FileFormat.Docx)
document.Close()
Apply for a Temporary License
If you'd like to remove the evaluation message from the generated documents, or to get rid of the function limitations, please request a 30-day trial license for yourself.
Adding background colors or pictures to your Word documents is a powerful way to enhance their visual appeal and captivate your audience. Whether you're creating a professional report, a creative flyer, or a personal invitation, incorporating a well-chosen background color or image can transform an ordinary document into a visually captivating piece. In this article, we will demonstrate how to add a background color or picture to a Word document in Python using Spire.Doc for Python.
- Add a Background Color to Word in Python
- Add a Gradient Background to Word in Python
- Add a Background Picture to Word in Python
Install Spire.Doc for Python
This scenario requires Spire.Doc for Python and plum-dispatch v1.7.4. They can be easily installed in your Windows through the following pip command.
pip install Spire.Doc
If you are unsure how to install, please refer to this tutorial: How to Install Spire.Doc for Python on Windows
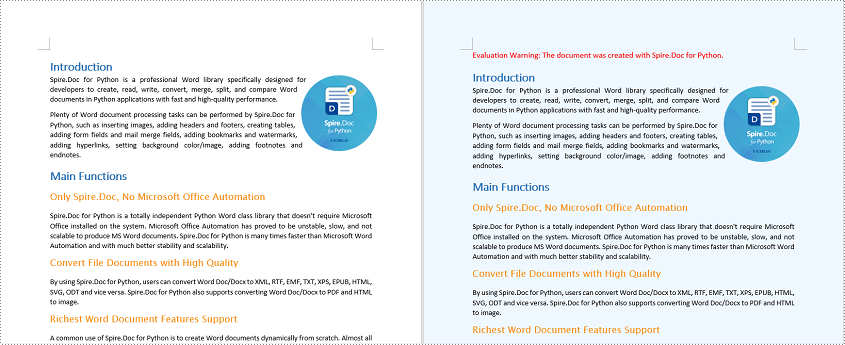
Add a Background Color to Word in Python
You can set a background color for a Word document by changing its background type to "Color" and then selecting a color as the background. The detailed steps are as follows.
- Create a Document object.
- Load a Word document using Document.LoadFromFile() method.
- Get the background of the document using Document.Background property.
- Set the background type as Color using Background.Type property.
- Set a color as the background using Background.Color property.
- Save the resulting document using Document.SaveToFile() method.
- Python
from spire.doc import *
from spire.doc.common import *

# Create a Document object
document = Document()
# Load a Word document
document.LoadFromFile("Sample.docx")

# Get the document's background
background = document.Background

# Set the background type as Color
background.Type = BackgroundType.Color
# Set the background color
background.Color = Color.get_AliceBlue()

#save the resulting document
document.SaveToFile("AddBackgroundColor.docx", FileFormat.Docx2016)
document.Close()
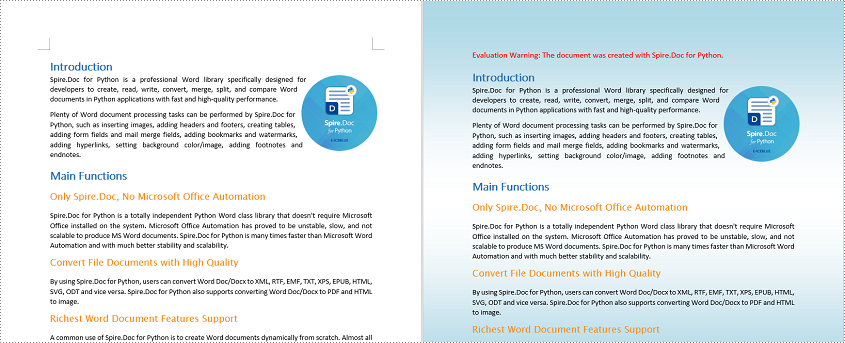
Add a Gradient Background to Word in Python
A gradient background refers to a background style that transitions smoothly between two or more colors. To add a gradient background, you need to change the background type as "Gradient", specify the gradient colors and then set the gradient shading variant and style. The detailed steps are as follows.
- Create a Document object.
- Load a Word document using Document.LoadFromFile() method.
- Get the background of the document using Document.Background property.
- Set the background type as Gradient using Background.Type property.
- Set two gradient colors using Background.Gradient.Color1 and Background.Gradient.Color2 properties.
- Set gradient shading variant and style using Background.Gradient.ShadingVariant and Background.Gradient.ShadingStyle properties.
- Save the resulting document using Document.SaveToFile() method.
- Python
from spire.doc import *
from spire.doc.common import *

# Create a Document object
document = Document()
# Load a Word document
document.LoadFromFile("Sample.docx")

# Get the document's background
background = document.Background

# Set the background type as Gradient
background.Type = BackgroundType.Gradient

# Set two gradient colors
background.Gradient.Color1 = Color.get_White()
background.Gradient.Color2 = Color.get_LightBlue()

# Set gradient shading variant and style
background.Gradient.ShadingVariant = GradientShadingVariant.ShadingDown
background.Gradient.ShadingStyle = GradientShadingStyle.Horizontal

#Save the resulting document
document.SaveToFile("AddGradientBackground.docx", FileFormat.Docx2016)
document.Close()
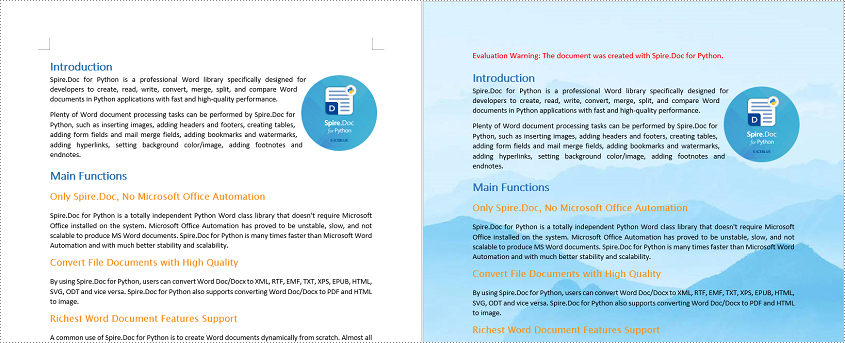
Add a Background Picture to Word in Python
To add a background picture to a Word document, you need to change the background type as "Picture", and then set a picture as the background. The detailed steps are as follows.
- Create a Document object.
- Load a Word document using Document.LoadFromFile() method.
- Get the background of the document using Document.Background property.
- Set the background type as Picture using Background.Type property.
- Set a picture as the background using Background.SetPicture() method.
- Save the resulting document using Document.SaveToFile() method.
- Python
from spire.doc import *
from spire.doc.common import *

# Create a Document object
document = Document()
# Load a Word document
document.LoadFromFile("Sample.docx")

# Get the document's background
background = document.Background

# Set the background type as Picture
background.Type = BackgroundType.Picture

# Set the background picture
background.SetPicture("background.jpg")

#save the resulting document
document.SaveToFile("AddBackgroundPicture.docx", FileFormat.Docx2016)
document.Close()
Apply for a Temporary License
If you'd like to remove the evaluation message from the generated documents, or to get rid of the function limitations, please request a 30-day trial license for yourself.
