In a sales report, a grade sheet, or a metrics dashboard, how values compare matters more than the values themselves. Inserting a chart for every column makes the worksheet crowded, while data bars, color scales, and icon sets show magnitude right inside the cells—through bar length, color intensity, and icon shape—without consuming extra rows or columns. All three belong to Excel conditional formatting, found under Home → Conditional Formatting in the Excel UI.Spire.XLS for JavaScript performs this work directly in the browser through WebAssembly, managing input and output files with a virtual file system (VFS) and requiring no backend service.
This article covers three key features:
For installation and project setup, see Integrating Spire.XLS for JavaScript in a React Project. The examples below assume Spire.XLS is already installed and the WebAssembly module has been initialized.
Apply Data Bars to a Cell Range
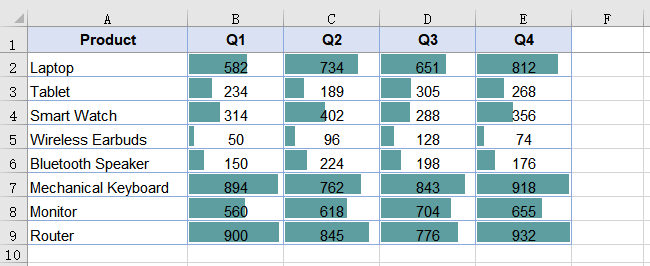
Data bars draw a horizontal colored band inside each cell, and the length of the band is proportional to how large the value is compared with the rest of the selected range. With Spire.XLS for JavaScript, ConditionalFormats.Add creates a conditional format collection, AddRange binds it to a range, and AddCondition returns the condition object; setting FormatType to ConditionalFormatType.DataBar produces data bars, whose fill color is controlled by DataBar.BarColor. The steps are as follows:
- Load the font and the test data file into the VFS.
- Load the workbook and get the worksheet.
- Call
ConditionalFormats.Addto create a conditional format, and bind the data range withAddRange. - Call
AddConditionto add a condition, setFormatTypetoDataBar, and set the bar color. - Save the workbook.
The complete code example below applies data bars to a sales figures table in React:
function App() {
  const applyDataBars = async () => {
    // Get the Spire.XLS WASM module
    const xlsModule = window.wasmModule?.spirexls;

    // Check whether the module is ready
    if (!xlsModule) {
      alert('Spire.Xls is not ready yet');
      return;
    }

    // Load the font and the test data file into the VFS
    await window.spire.FetchFileToVFS('ARIAL.TTF', '/Library/Fonts/', `${process.env.PUBLIC_URL}/font/`);
    const inputFileName = 'SalesData.xlsx';
    await window.spire.FetchFileToVFS(inputFileName, '', `${process.env.PUBLIC_URL}data/`);

    // Load the workbook and get the first worksheet
    const workbook = new xlsModule.Workbook();
    workbook.LoadFromFile({ fileName: inputFileName });
    const sheet = workbook.Worksheets.get(0);

    // Select the data range that receives the data bars
    const dataRange = sheet.Range.get("B2:E9");

    // Create a conditional format and bind it to that range
    const xcfs = sheet.ConditionalFormats.Add();
    xcfs.AddRange(dataRange);

    // Add a data bar condition and set the bar color
    const format = xcfs.AddCondition();
    format.FormatType = xlsModule.ConditionalFormatType.DataBar;
    format.DataBar.BarColor = xlsModule.Color.get_CadetBlue();

    // Save the workbook
    const outputFileName = "ApplyDataBars.xlsx";
    workbook.SaveToFile({ fileName: outputFileName, version: xlsModule.ExcelVersion.Version2010 });

    // Dispose of the workbook object to free resources
    workbook.Dispose();

    // Read the result file from the VFS and trigger the download
    const fileArray = window.dotnetRuntime.Module.FS.readFile(outputFileName);
    const blob = new Blob([fileArray], { type: 'application/vnd.openxmlformats-officedocument.spreadsheetml.sheet' });
    const url = URL.createObjectURL(blob);
    const a = document.createElement('a');
    a.href = url;
    a.download = outputFileName;
    a.click();
    URL.revokeObjectURL(url);
  };

  return (
    <div style={{ textAlign: 'center', height: '300px' }}>
      <h1>Apply Data Bars</h1>
      <button onClick={applyDataBars}>Start</button>
    </div>
  );
}

export default App;
After running, the effect of applying data bars to a cell range:
Apply Color Scales to a Cell Range
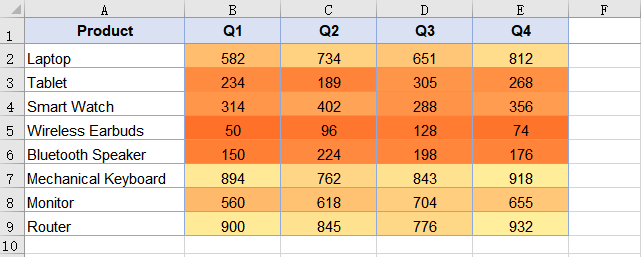
A color scale uses shading to express magnitude: the larger a cell's value is within the range, the closer its color sits to the high end of the scale. Color scales are added through the same ConditionalFormats API as data bars—the only difference is setting FormatType to ConditionalFormatType.ColorScale. No color arguments are required; when none are specified, the result is a two-color scale that takes orange at the range minimum and pale yellow at the maximum, with intermediate values shaded proportionally between the two. The steps are as follows:
- Load the font and the test data file into the VFS.
- Load the workbook and get the worksheet.
- Call
ConditionalFormats.Addto create a conditional format, and bind the data range withAddRange. - Call
AddConditionto add a condition, and setFormatTypetoColorScale. - Save the workbook.
The complete code example below applies color scales to a sales figures table in React:
function App() {
  const applyColorScales = async () => {
    // Get the Spire.XLS WASM module
    const xlsModule = window.wasmModule?.spirexls;

    // Check whether the module is ready
    if (!xlsModule) {
      alert('Spire.Xls is not ready yet');
      return;
    }

    // Load the font and the test data file into the VFS
    await window.spire.FetchFileToVFS('ARIAL.TTF', '/Library/Fonts/', `${process.env.PUBLIC_URL}/font/`);
    const inputFileName = 'SalesData.xlsx';
    await window.spire.FetchFileToVFS(inputFileName, '', `${process.env.PUBLIC_URL}data/`);

    // Load the workbook and get the first worksheet
    const workbook = new xlsModule.Workbook();
    workbook.LoadFromFile({ fileName: inputFileName });
    const sheet = workbook.Worksheets.get(0);

    // Select the data range that receives the color scales
    const dataRange = sheet.Range.get("B2:E9");

    // Create a conditional format and bind it to that range
    const xcfs = sheet.ConditionalFormats.Add();
    xcfs.AddRange(dataRange);

    // Add a color scale condition; colors transition with the values
    const format = xcfs.AddCondition();
    format.FormatType = xlsModule.ConditionalFormatType.ColorScale;

    // Save the workbook
    const outputFileName = "ApplyColorScales.xlsx";
    workbook.SaveToFile({ fileName: outputFileName, version: xlsModule.ExcelVersion.Version2010 });

    // Dispose of the workbook object to free resources
    workbook.Dispose();

    // Read the result file from the VFS and trigger the download
    const fileArray = window.dotnetRuntime.Module.FS.readFile(outputFileName);
    const blob = new Blob([fileArray], { type: 'application/vnd.openxmlformats-officedocument.spreadsheetml.sheet' });
    const url = URL.createObjectURL(blob);
    const a = document.createElement('a');
    a.href = url;
    a.download = outputFileName;
    a.click();
    URL.revokeObjectURL(url);
  };

  return (
    <div style={{ textAlign: 'center', height: '300px' }}>
      <h1>Apply Color Scales</h1>
      <button onClick={applyColorScales}>Start</button>
    </div>
  );
}

export default App;
After running, the effect of applying color scales to a cell range:
Apply Icon Sets to a Cell Range
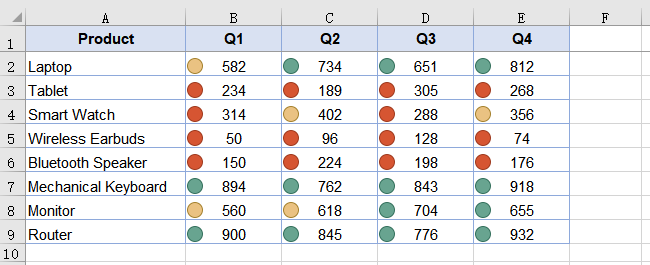
An icon set places a different icon in each cell according to the band its value falls into—for example, red, yellow, and green traffic lights for low, medium, and high. It uses the same API: set FormatType to ConditionalFormatType.IconSet and pick an icon style with IconSet.IconSetType; the example uses IconSetType.ThreeTrafficLights1. The steps are as follows:
- Load the font and the test data file into the VFS.
- Load the workbook and get the worksheet.
- Call
ConditionalFormats.Addto create a conditional format, and bind the data range withAddRange. - Call
AddConditionto add a condition, setFormatTypetoIconSet, and specify the icon set type. - Save the workbook.
The complete code example below applies icon sets to a sales figures table in React:
function App() {
  const applyIconSets = async () => {
    // Get the Spire.XLS WASM module
    const xlsModule = window.wasmModule?.spirexls;

    // Check whether the module is ready
    if (!xlsModule) {
      alert('Spire.Xls is not ready yet');
      return;
    }

    // Load the font and the test data file into the VFS
    await window.spire.FetchFileToVFS('ARIAL.TTF', '/Library/Fonts/', `${process.env.PUBLIC_URL}/font/`);
    const inputFileName = 'SalesData.xlsx';
    await window.spire.FetchFileToVFS(inputFileName, '', `${process.env.PUBLIC_URL}data/`);

    // Load the workbook and get the first worksheet
    const workbook = new xlsModule.Workbook();
    workbook.LoadFromFile({ fileName: inputFileName });
    const sheet = workbook.Worksheets.get(0);

    // Select the data range that receives the icon sets
    const dataRange = sheet.Range.get("B2:E9");

    // Create a conditional format and bind it to that range
    const xcfs = sheet.ConditionalFormats.Add();
    xcfs.AddRange(dataRange);

    // Add an icon set condition and set the icon style to three traffic lights
    const format = xcfs.AddCondition();
    format.FormatType = xlsModule.ConditionalFormatType.IconSet;
    format.IconSet.IconSetType = xlsModule.IconSetType.ThreeTrafficLights1;

    // Save the workbook
    const outputFileName = "ApplyIconSets.xlsx";
    workbook.SaveToFile({ fileName: outputFileName, version: xlsModule.ExcelVersion.Version2010 });

    // Dispose of the workbook object to free resources
    workbook.Dispose();

    // Read the result file from the VFS and trigger the download
    const fileArray = window.dotnetRuntime.Module.FS.readFile(outputFileName);
    const blob = new Blob([fileArray], { type: 'application/vnd.openxmlformats-officedocument.spreadsheetml.sheet' });
    const url = URL.createObjectURL(blob);
    const a = document.createElement('a');
    a.href = url;
    a.download = outputFileName;
    a.click();
    URL.revokeObjectURL(url);
  };

  return (
    <div style={{ textAlign: 'center', height: '300px' }}>
      <h1>Apply Icon Sets</h1>
      <button onClick={applyIconSets}>Start</button>
    </div>
  );
}

export default App;
An icon set divides the range into bands, so the same icon covers a different span of values in different ranges.
After running, the effect of applying icon sets to a cell range:
FAQ
Why do the text cells in the target range get no data bars?
Cause: A data bar expresses how large a value is relative to the rest of the range, so only numeric cells are shaded and text cells inside the range are skipped. Even when the range covers the product-name column or the header row, those cells show no bars—the result still covers the numeric area alone.
Solution: This is the expected behavior and needs no workaround; just keep the range limited to the numeric area. If the numeric area itself shows no bars either, check that the range passed to AddRange matches where the data actually is.
Can the color and border of a data bar be customized?
Cause: A data bar's appearance is controlled by the DataBar property of the condition object. The fill color comes from DataBar.BarColor; setting only FormatType without BarColor yields the default blue bars. Data bars have no border by default, so assigning BarBorder.Color on its own has no effect.
Solution: Set the border type through DataBar.BarBorder.Type first, then set the border color—the two go together:
// Set the border type first so that the border color takes effect
format.DataBar.BarBorder.Type = xlsModule.DataBarBorderType.DataBarBorderSolid;
format.DataBar.BarBorder.Color = xlsModule.Color.get_Red();

// Fill color of the bar
format.DataBar.BarColor = xlsModule.Color.get_GreenYellow();
Get a Free License
Spire.XLS for JavaScript offers a 30-day full-featured free trial license with no functional limitations. Apply here to evaluate before purchasing.
