
.NET (1327)
Children categories
Print Multiple PDF Pages per Sheet and Print Single PDF Page to Multiple Sheets in C#
2017-10-24 08:04:36 Written by KoohjiWhen it comes to printing, Spire.PDF offers users a wide range of options to fulfil their printing needs. Two of these options are “print multiple PDF pages per sheet” and “print single PDF page to multiple sheets”. This article elaborates how to achieve these two options using Spire.PDF and C#.
Print Multiple PDF Pages per Sheet
Uses can invoke the SelectMultiPageLayout(int rows, int columns) method of the PdfPrintSettings class to print multiple PDF pages per sheet of paper.
using Spire.Pdf;


namespace PrintPDF
{
    class Program
    {
        static void Main(string[] args)
        {
            //Initialize a PdfDocument object
            PdfDocument pdf = new PdfDocument();
            //Load the pdf file
            pdf.LoadFromFile("Input.pdf");

            //Print two PDF pages per sheet
            pdf.PrintSettings.SelectMultiPageLayout(1, 2);
            pdf.Print();
        }
    }
}
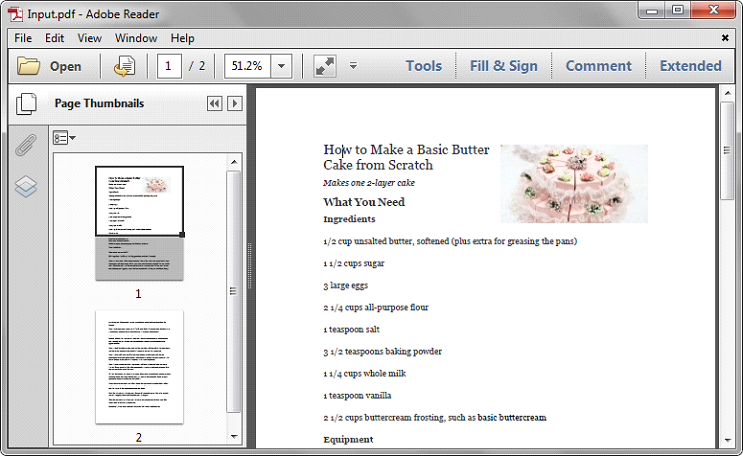
Below screenshot shows the sample pdf document which contains two pages:
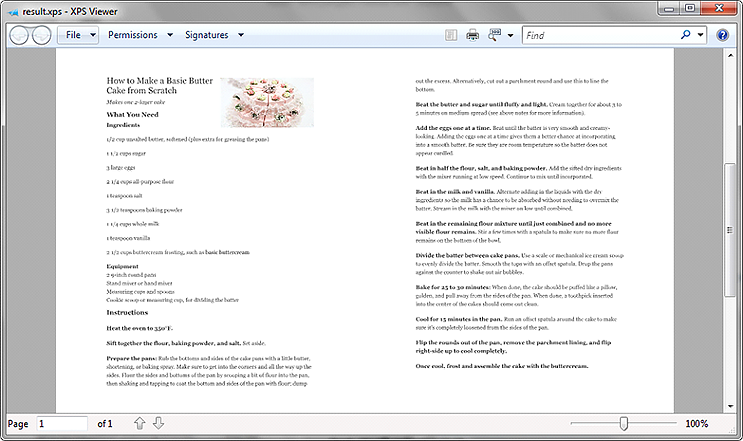
Screenshot after printing to XPS:
Print Single PDF Page to Multiple Sheets
The SelectSplitPageLayout() method of the PdfPrintSettings class can be used when printing a large PDF page to multiple sheets. This method splits the PDF page to multiple pages according to the standard A4 paper size: 595pt*842pt.
using Spire.Pdf;


namespace PrintPDF2
{
    class Program
    {
        static void Main(string[] args)
        {
            //Initialize a PdfDocument object
            PdfDocument pdf = new PdfDocument();
            //Load the pdf file
            pdf.LoadFromFile("Input1.pdf");

            //Print the PDF page to multiple sheets
            pdf.PrintSettings.SelectSplitPageLayout();
            pdf.Print();
        }
    }
}
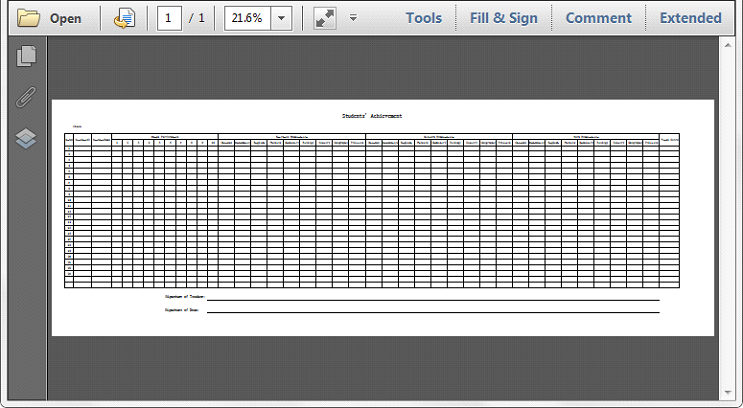
Below screenshot shows the sample pdf document which contains a single page with a size of 2100pt*750pt:
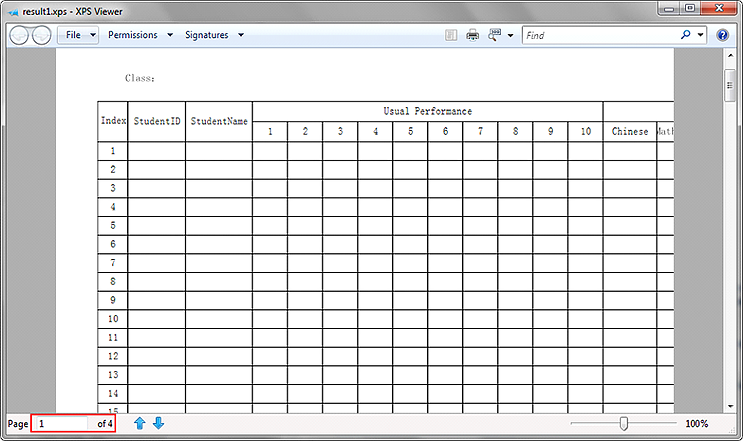
Screenshot after printing to XPS:
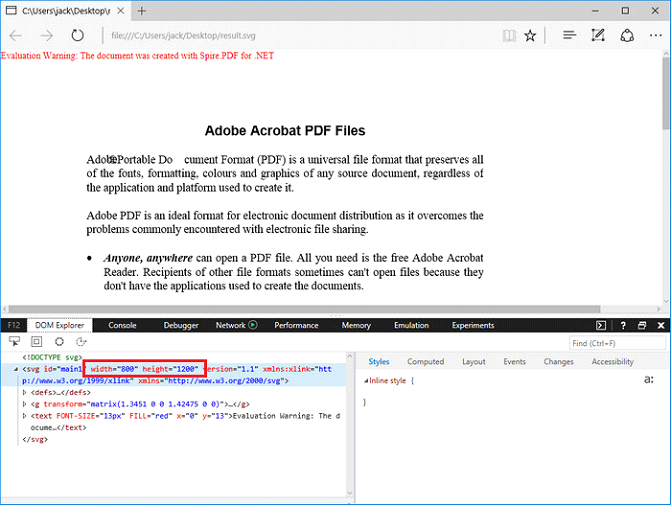
Convert PDF to SVG with Custom Width and Height in C#, VB.NET
2017-10-24 07:04:26 Written by AdministratorWe've have demonstrated how to convert PDF page to SVG file format in the previous post. This guidance shows you how we can specify the width and height of output file using the latest version of Spire.PDF with C# and VB.NET.
Step 1: Load a sample PDF document to PdfDocument instance.
PdfDocument document = new PdfDocument();
document.LoadFromFile("pdf-sample.pdf");
Step 2: Specify the output file size through ConvertOptions.SetPdfToSvgOptions() method.
PdfToSvgConverter converter = new PdfToSvgConverter(inputFile);
    converter.SvgOptions.ScaleX = (float)0.5;
    converter.SvgOptions.ScaleY = (float)0.5;
    converter.Convert(outputFile);
Step 3: Save PDF to SVG file format.
document.SaveToFile("result.svg", FileFormat.SVG);
Output:
Full Code:
using Spire.Pdf;
using Spire.Pdf.Conversion;

namespace ConvertPDFtoSVG
{
    class Program
    {
        static void Main(string[] args)
        {
            PdfDocument document = new PdfDocument();
            PdfToSvgConverter converter = new PdfToSvgConverter(inputFile);
            converter.SvgOptions.ScaleX = (float)0.5;
            converter.SvgOptions.ScaleY = (float)0.5;
            converter.Convert(outputFile);
        }
    }
}
Imports Spire.Pdf
Imports Spire.Pdf.Conversion

Namespace ConvertPDFtoSVG
    Class Program
        Private Shared Sub Main(args As String())
            Dim document As New PdfDocument()
            document.LoadFromFile("pdf-sample.pdf")
            ' Specify the width And height of output SVG file
            Dim Converter As New PdfToSvgConverter(inputFile)
            Converter.SvgOptions.ScaleX = CSng(0.5)
            Converter.SvgOptions.ScaleY = CSng(0.5)
            Converter.Convert(outputFile)
            document.SaveToFile("result.svg", FileFormat.SVG)
        End Sub
    End Class
End Namespace
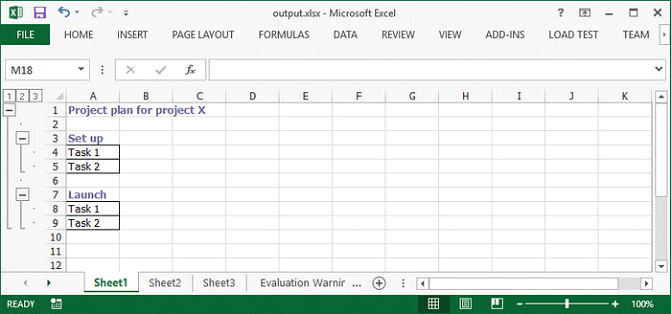
Nested group is a group that contains multiple inner, nested groups. This article demonstrates how to create groups and how to outline the outer and inner groups using Spire.XLS with C# and VB.NET.
Step 1: Create a Workbook instance and get the first worksheet.
Workbook workbook = new Workbook();
Worksheet sheet = workbook.Worksheets[0];
Step 2: Insert sample data to cells.
sheet.Range["A1"].Value = "Project plan for project X";
sheet.Range["A3"].Value = "Set up";
sheet.Range["A4"].Value = "Task 1";
sheet.Range["A5"].Value = "Task 2";
sheet.Range["A7"].Value = "Launch";
sheet.Range["A8"].Value = "Task 1";
sheet.Range["A9"].Value = "Task 2";
Step 3: Set the IsSummaryRowBelow property as false, which indicates the summary rows appear above detail rows.
sheet.PageSetup.IsSummaryRowBelow = false;
Step 4: Group the rows that you want to group.
sheet.GroupByRows(2, 9, false);
sheet.GroupByRows(4, 5, false);
sheet.GroupByRows(8, 9, false);
Step 5: Save the file.
workbook.SaveToFile("output.xlsx", ExcelVersion.Version2013);
Output:
Full Code:
using Spire.Xls;
using System.Drawing;
namespace CreateNestedGroup
{
    class Program
    {
        static void Main(string[] args)
        {
            Workbook workbook = new Workbook();
            Worksheet sheet = workbook.Worksheets[0];

            CellStyle style = workbook.Styles.Add("style");
            style.Font.Color = Color.CadetBlue;
            style.Font.IsBold = true;

            sheet.PageSetup.IsSummaryRowBelow = false;
            sheet.Range["A1"].Value = "Project plan for project X";
            sheet.Range["A1"].CellStyleName = style.Name;

            sheet.Range["A3"].Value = "Set up";
            sheet.Range["A3"].CellStyleName = style.Name;
            sheet.Range["A4"].Value = "Task 1";
            sheet.Range["A5"].Value = "Task 2";
            sheet.Range["A4:A5"].BorderAround(LineStyleType.Thin);
            sheet.Range["A4:A5"].BorderInside(LineStyleType.Thin);

            sheet.Range["A7"].Value = "Launch";
            sheet.Range["A7"].CellStyleName = style.Name;
            sheet.Range["A8"].Value = "Task 1";
            sheet.Range["A9"].Value = "Task 2";
            sheet.Range["A8:A9"].BorderAround(LineStyleType.Thin);
            sheet.Range["A8:A9"].BorderInside(LineStyleType.Thin);

            sheet.GroupByRows(2, 9, false);
            sheet.GroupByRows(4, 5, false);
            sheet.GroupByRows(8, 9, false);
            workbook.SaveToFile("output.xlsx", ExcelVersion.Version2013);
        }
    }
}
Imports Spire.Xls
Imports System.Drawing
Namespace CreateNestedGroup
	Class Program
		Private Shared Sub Main(args As String())
			Dim workbook As New Workbook()
			Dim sheet As Worksheet = workbook.Worksheets(0)

			Dim style As CellStyle = workbook.Styles.Add("style")
			style.Font.Color = Color.CadetBlue
			style.Font.IsBold = True

			sheet.PageSetup.IsSummaryRowBelow = False
			sheet.Range("A1").Value = "Project plan for project X"
			sheet.Range("A1").CellStyleName = style.Name

			sheet.Range("A3").Value = "Set up"
			sheet.Range("A3").CellStyleName = style.Name
			sheet.Range("A4").Value = "Task 1"
			sheet.Range("A5").Value = "Task 2"
			sheet.Range("A4:A5").BorderAround(LineStyleType.Thin)
			sheet.Range("A4:A5").BorderInside(LineStyleType.Thin)

			sheet.Range("A7").Value = "Launch"
			sheet.Range("A7").CellStyleName = style.Name
			sheet.Range("A8").Value = "Task 1"
			sheet.Range("A9").Value = "Task 2"
			sheet.Range("A8:A9").BorderAround(LineStyleType.Thin)
			sheet.Range("A8:A9").BorderInside(LineStyleType.Thin)

			sheet.GroupByRows(2, 9, False)
			sheet.GroupByRows(4, 5, False)
			sheet.GroupByRows(8, 9, False)
			workbook.SaveToFile("output.xlsx", ExcelVersion.Version2013)
		End Sub
	End Class
End Namespace
PDF layer is a feature that arranges the content of a PDF file in layers, which allows users to selectively set some content to be visible and others to be invisible in the same PDF file. PDF layers are a common element used in layered artwork, maps and CAD drawings. This article will demonstrate how to programmatically add, hide or delete layers in a PDF file using Spire.PDF for .NET.
- Add Layers to a PDF Document in C# and VB.NET
- Set Visibility of Layers in a PDF Document in C# and VB.NET
- Delete Layers in a PDF Document in C# and VB.NET
Install Spire.PDF for .NET
To begin with, you need to add the DLL files included in the Spire.PDF for.NET package as references in your .NET project. The DLLs files can be either downloaded from this link or installed via NuGet.
PM> Install-Package Spire.PDF
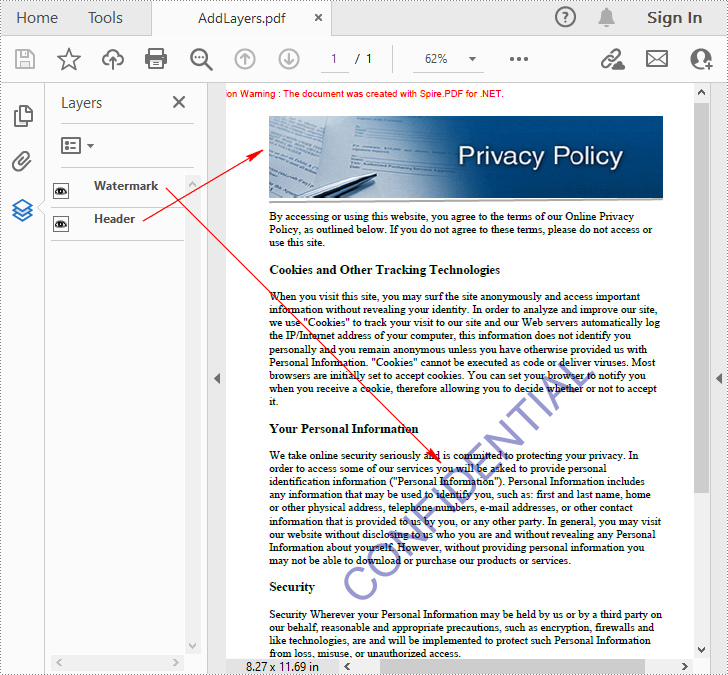
Add Layers to a PDF Document in C# and VB.NET
Spire.PDF for .NET provides PdfDocument.Layers.AddLayer() method to add a layer in a PDF document, and you can then draw text, lines, images or shapes on the PDF layer. The detailed steps are as follows.
- Create a PdfDocument instance.
- Load a sample PDF file using PdfDocument.LoadFromFile() method.
- Add a layer with specified name in the PDF using PdfDocument.Layers.AddLayer(String) method. Or you can also set the visibility of the layer while adding it using PdfDocument.Layers.AddLayer(String, PdfVisibility) method.
- Create a canvas for the layer using PdfLayer.CreateGraphics() method.
- Draw text, image or other elements on the canvas.
- Save the result document using PdfDocument.SaveToFile() method.
- C#
- VB.NET
using Spire.Pdf;
using Spire.Pdf.Graphics;
using Spire.Pdf.Graphics.Layer;
using System.Drawing;

namespace AddLayersToPdf
{
    class Program
    {
        static void Main(string[] args)
        {
            //Create a PdfDocument instance and load a sample PDF file
            PdfDocument pdf = new PdfDocument();
            pdf.LoadFromFile(@"C:\Users\Administrator\Desktop\Sample.pdf");

            //Invoke AddLayerWatermark method to add a watermark layer
            AddLayerWatermark(pdf);

            //Invoke AddLayerHeader method to add a header layer
            AddLayerHeader(pdf);

            //Save to file
            pdf.SaveToFile("AddLayers.pdf");
            pdf.Close();
        }

        private static void AddLayerWatermark(PdfDocument doc)
        {
            //Create a layer named "Watermark"
            PdfLayer layer = doc.Layers.AddLayer("Watermark");

            //Create a font
            PdfTrueTypeFont font = new PdfTrueTypeFont(new Font("Arial", 48), true);

            //Specify the watermark text
            string watermarkText = "CONFIDENTIAL";

            //Get text size
            SizeF fontSize = font.MeasureString(watermarkText);

            //Calculate two offsets
            float offset1 = (float)(fontSize.Width * System.Math.Sqrt(2) / 4);
            float offset2 = (float)(fontSize.Height * System.Math.Sqrt(2) / 4);

            //Get page count
            int pageCount = doc.Pages.Count;

            //Declare two variables
            PdfPageBase page;
            PdfCanvas canvas;

            //Loop through the pages
            for (int i = 0; (i < pageCount); i++)
            {
                page = doc.Pages[i];

                //Create a canvas from layer
                canvas = layer.CreateGraphics(page.Canvas);
                canvas.TranslateTransform(page.Canvas.Size.Width / 2 - offset1 - offset2, page.Canvas.Size.Height / 2 + offset1 - offset2);
                canvas.SetTransparency(0.4f);
                canvas.RotateTransform(-45);

                //Draw sting on the canvas of layer
                canvas.DrawString(watermarkText, font, PdfBrushes.DarkBlue, 0, 0);
            }
        }
        private static void AddLayerHeader(PdfDocument doc)
        {
            // Create a layer named "Header"
            PdfLayer layer = doc.Layers.AddLayer("Header");

            //Get page size
            SizeF size = doc.Pages[0].Size;

            //Specify the initial values of X and y
            float x = 90;
            float y = 40;

            //Get page count
            int pageCount = doc.Pages.Count;

            //Declare two variables
            PdfPageBase page;
            PdfCanvas canvas;

            //Loop through the pages
            for (int i = 0; (i < pageCount); i++)
            {
                //Draw an image on the layer
                PdfImage pdfImage = PdfImage.FromFile(@"C:\Users\Administrator\Desktop\img.jpg");
                float width = pdfImage.Width;
                float height = pdfImage.Height;
                page = doc.Pages[i];
                canvas = layer.CreateGraphics(page.Canvas);
                canvas.DrawImage(pdfImage, x, y, width, height);

                //Draw a line on the layer
                PdfPen pen = new PdfPen(PdfBrushes.DarkGray, 2);
                canvas.DrawLine(pen, x, (y + (height + 5)), (size.Width - x), (y + (height + 2)));
            }
        }
    }
}
Set Visibility of Layers in a PDF Document in C# and VB.NET
To set the visibility of an existing layer, you'll need to get a specified layer by its index or name using PdfDocument.Layers property, and then show or hide the layer using PdfLayer.Visibility property. The detailed steps are as follows.
- Create a PdfDocument instance.
- Load a sample PDF document using PdfDocument.LoadFromFile() method.
- Set the visibility of a specified layer using PdfDocument.Layers.Visibility property.
- Save the result document using PdfDocument.SaveToFile() method.
- C#
- VB.NET
using Spire.Pdf;
using Spire.Pdf.Graphics.Layer;

namespace HideLayer
{
    class Program
    {
        static void Main(string[] args)
        {
            //Create a PdfDocument instance
            PdfDocument pdf = new PdfDocument();

            //Load a sample PDF document
            pdf.LoadFromFile("AddLayers.pdf");

            //Hide a specified layer by index
            pdf.Layers[0].Visibility = PdfVisibility.Off;

            //Hide a specified layer by name
            //pdf.Layers["Watermark"].Visibility = PdfVisibility.Off;

            //Save the result document
            pdf.SaveToFile("HideLayer.pdf");
        }
    }
}

Delete Layers in a PDF Document in C# and VB.NET
Spire.PDF for .NET also allows you to remove an existing layer by its name using PdfDocument.Layers.RemoveLayer(String) method. But kindly note that the names of PDF layers may not be unique and this method will remove all PDF layers with the same name. The detailed steps are as follows.
- Create a PdfDocument instance.
- Load a sample PDF document using PdfDocument.LoadFromFile() method.
- Delete a specified layer by its name using PdfDocument.Layers.RemoveLayer(String) method.
- Save the result document using PdfDocument.SaveToFile() method.
- C#
- VB.NET
using Spire.Pdf;

namespace DeleteLayer
{
    class Program
    {
        static void Main(string[] args)
        {
            //Create a PdfDocument instance
            PdfDocument pdf = new PdfDocument();

            //Load a sample PDF document
            pdf.LoadFromFile("AddLayers.pdf");

            //Remove a layer by name
            pdf.Layers.RemoveLayer(("Watermark"));

            //Save the result document
            pdf.SaveToFile("DeleteLayer.pdf", FileFormat.PDF);
        }
    }
}

Apply for a Temporary License
If you'd like to remove the evaluation message from the generated documents, or to get rid of the function limitations, please request a 30-day trial license for yourself.
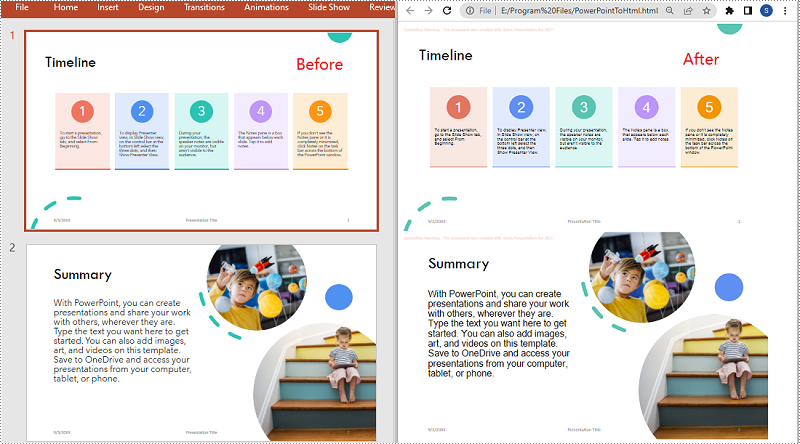
When you share a PowerPoint presentation online, people have to download it to their computers before they can view it. Sometimes the downloading process can be quite annoying and time-consuming, especially when the file is very large. A good solution to this problem is to convert your presentation to HTML so that people can view it directly online. In this article, we will demonstrate how to programmatically convert PowerPoint presentations to HTML format in C# and VB.NET using Spire.Presentation for .NET.
Install Spire.Presentation for .NET
To begin with, you need to add the DLL files included in the Spire.Presentation for.NET package as references in your .NET project. The DLL files can be either downloaded from this link or installed via NuGet.
PM> Install-Package Spire.Presentation
Convert a PowerPoint Presentation to HTML in C# and VB.NET
In Spire.Presentation for .NET, the Presentation.SaveToFile(String, FileFormat) method is used to convert a PowerPoint presentation to other file formats such as PDF, XPS, and HTML. In the following steps, we will show you how to convert a PowerPoint presentation to HTML using Spire.Presentation for .NET:
- Initialize an instance of the Presentation class.
- Load a PowerPoint presentation using Presentation.LoadFromFile(String) method.
- Save the PowerPoint presentation to HTML format using Presentation.SaveToFile(String, FileFormat) method.
- C#
- VB.NET
using Spire.Presentation;

namespace ConvertPowerPointToHtml
{
    class Program
    {
        static void Main(string[] args)
        {
            //Initialize an instance of the Presentation class
            Presentation ppt = new Presentation();
            //Load a PowerPoint presentation
            ppt.LoadFromFile(@"E:\Program Files\Sample.pptx");

            //Specify the file path of the output HTML file
            String result = @"E:\Program Files\PowerPointToHtml.html";

            //Save the PowerPoint presentation to HTML format
            ppt.SaveToFile(result, FileFormat.Html);
        }
    }
}
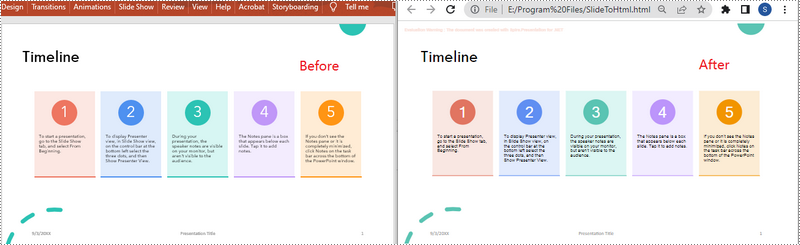
Convert a Specific PowerPoint Slide to HTML in C# and VB.NET
In some cases, you may need to convert a specific slide instead of the whole presentation to HTML. Spire.Presentation offers the ISlide.SaveToFile(String, FileFormat) method to convert a PowerPoint slide to HTML. The following are the detailed steps:
- Initialize an instance of the Presentation class.
- Load a PowerPoint presentation using Presentation.LoadFromFile() method.
- Get a specific slide in the PowerPoint presentation by its index through Presentation.Slides[int] property.
- Save the PowerPoint slide to HTML format using ISlide.SaveToFile(String, FileFormat) method.
- C#
- VB.NET
using Spire.Presentation;
using System;

namespace ConvertPowerPointSlideToHtml
{
    class Program
    {
        static void Main(string[] args)
        {
            //Initialize an instance of the Presentation class
            Presentation presentation = new Presentation();
            //Load the PowerPoint presentation
            presentation.LoadFromFile(@"E:\Program Files\Sample.pptx");

            //Get the first slide
            ISlide slide = presentation.Slides[0];

            //Specify the file path of the output HTML file
            String result = @"E:\Program Files\SlideToHtml.html";

            //Save the first slide to HTML format
            slide.SaveToFile(result, FileFormat.Html);
        }
    }
}
Apply for a Temporary License
If you'd like to remove the evaluation message from the generated documents, or to get rid of the function limitations, please request a 30-day trial license for yourself.
CSV is one of the commonly used file formats for exchanging tabular data between applications. However, in some circumstances, CSV may not be the most appropriate file format. For instance, if you have a CSV report that needs to be sent to an important customer, the best way to ensure the file appears as-is on the customer's device is to convert it to PDF. This article will demonstrate how to convert CSV to PDF in C# and VB.NET using Spire.XLS for .NET.
Install Spire.XLS for .NET
To begin with, you need to add the DLL files included in the Spire.XLS for .NET package as references in your .NET project. The DLL files can be either downloaded from this link or installed via NuGet.
PM> Install-Package Spire.XLS
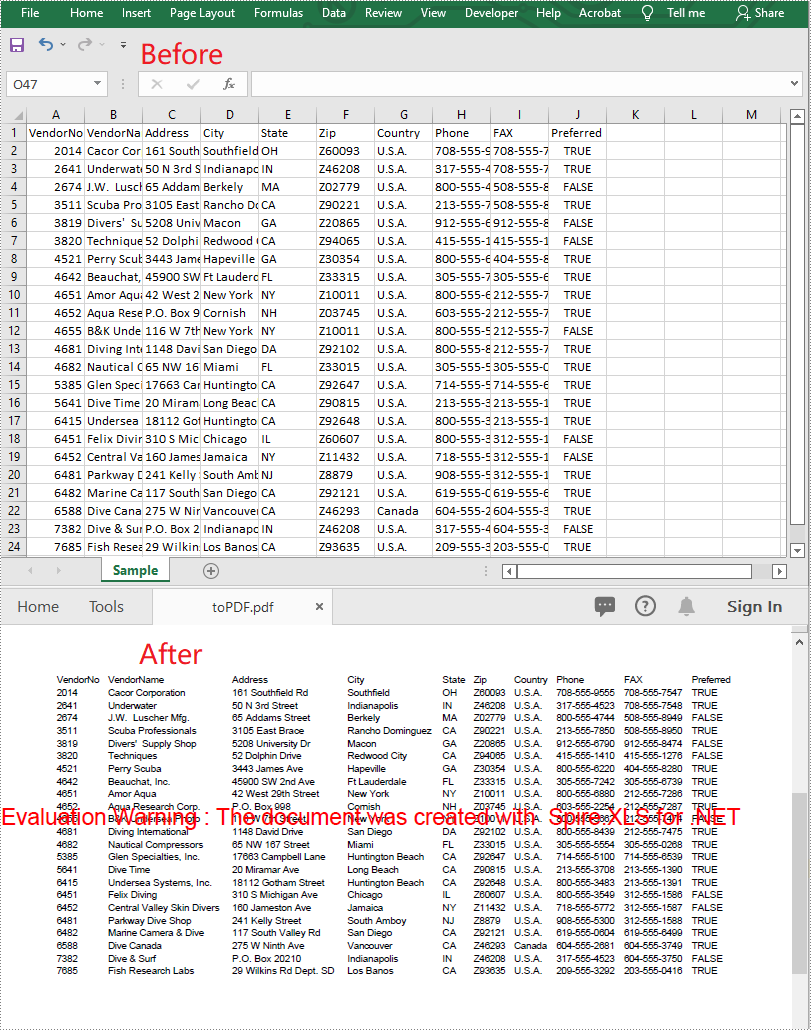
Convert CSV to PDF in C# and VB.NET
The following are the steps to convert a CSV file to PDF:
- Create an instance of Workbook class.
- Load the CSV file using Workbook.LoadFromFile(filePath, separator) method.
- Set the Workbook.ConverterSetting.SheetFitToPage property as true to ensure the worksheet is rendered to one PDF page.
- Get the first worksheet in the Workbook using Workbook.Worksheets[0] property.
- Loop through the columns in the worksheet and auto-fit the width of each column using Worksheet.AutoFitColumn() method.
- Save the worksheet to PDF using Worksheet.SaveToPdf() method.
- C#
- VB.NET
using Spire.Xls;

namespace ConvertCsvToPdf
{
    class Program
    {
        static void Main(string[] args)
        {
            //Create a Workbook instance
            Workbook wb = new Workbook();
            //Load a CSV file
            wb.LoadFromFile("Sample.csv", ",");

            //Set SheetFitToPage property as true to ensure the worksheet is converted to 1 PDF page
            wb.ConverterSetting.SheetFitToPage = true;

            //Get the first worksheet
            Worksheet sheet = wb.Worksheets[0];

            //Loop through the columns in the worksheet
            for (int i = 1; i < sheet.Columns.Length; i++)
            {
                //AutoFit columns
                sheet.AutoFitColumn(i);
            }

            //Save the worksheet to PDF
            sheet.SaveToPdf("toPDF.pdf");
        }
    }
}
Apply for a Temporary License
If you'd like to remove the evaluation message from the generated documents, or to get rid of the function limitations, please request a 30-day trial license for yourself.
Shapes are powerful tools for improving the aesthetics and functionality of your Excel documents. Whether you're looking to add visual elements to charts, highlight important data, or create engaging presentations, mastering shape manipulation is essential. In this article, we will explore how to add, format, and remove shapes in Excel in C# using Spire.XLS for .NET, providing you with practical tips and techniques to elevate your spreadsheet.
Install Spire.XLS for .NET
To begin with, you need to add the DLL files included in the Spire.XLS for .NET package as references in your .NET project. The DLL files can be either downloaded from this link or installed via NuGet.
PM> Install-Package Spire.XLS
Add Shapes in Excel in C#
Spire.XLS for .NET provides the Worksheet.PrstGeomShapes.AddPrstGeomShape(int row, int column, int width, int height, PrstGeomShapeType shapeType) method for adding shapes to a worksheet. The first four parameters define the shape's position and dimensions, while the fifth parameter specifies the shape type. The PrstGeomShapeType enumeration includes 188 different shape types preset in Excel.
To add a specific type of shape to a worksheet in C#, follow these steps:
- Create a Workbook object.
- Get a specific worksheet using the Workbook.Worksheets[index] property.
- Add a shape to the worksheet using the Worksheet.PrstGeomShapes.AddPrstGeomShape() method, specifying the location, size and type of the shape.
- Save the workbook to an Excel file.
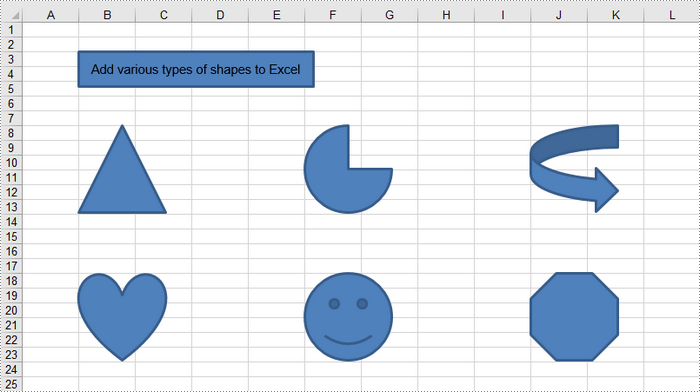
The following code demonstrates how to generate an Excel file and add various geometric shapes, including a rectangle, a triangle, a heart, a pie, and a smiley face, using the Spire.XLS for .NET library.
- C#
using Spire.Xls;
using Spire.Xls.Core;

namespace AddShapesInExcel
{
    class Program
    {
        static void Main(string[] args)
        {
            // Create a Workbook object
            Workbook workbook = new Workbook();

            // Get the first worksheet
            Worksheet sheet = workbook.Worksheets[0];

            // Add a rectangle
            IPrstGeomShape rectangle = sheet.PrstGeomShapes.AddPrstGeomShape(3, 2, 270, 40, PrstGeomShapeType.Rect);

            // Set text for the shape
            rectangle.Text = "Add various types of shapes to Excel";
            rectangle.TextVerticalAlignment = ExcelVerticalAlignment.MiddleCentered;

            // Add a triangle, a pie, a curved right arrow, a heart, a smile face, and an octagon to the worksheet
            sheet.PrstGeomShapes.AddPrstGeomShape(8, 2, 100, 100, PrstGeomShapeType.Triangle);
            sheet.PrstGeomShapes.AddPrstGeomShape(8, 6, 100, 100, PrstGeomShapeType.Pie);
            sheet.PrstGeomShapes.AddPrstGeomShape(8, 10, 100, 100, PrstGeomShapeType.CurvedRightArrow);

            sheet.PrstGeomShapes.AddPrstGeomShape(18, 2, 100, 100, PrstGeomShapeType.Heart);
            sheet.PrstGeomShapes.AddPrstGeomShape(18, 6, 100, 100, PrstGeomShapeType.SmileyFace);
            sheet.PrstGeomShapes.AddPrstGeomShape(18, 10, 100, 100, PrstGeomShapeType.Octagon);

            // Save the workbook to an Excel file
            workbook.SaveToFile("AddShapes.xlsx", ExcelVersion.Version2016);

            // Dispose resources
            workbook.Dispose();
        }
    }
}
Format Shapes in Excel in C#
Formatting shapes enhances the visual appeal of your worksheets and improves information conveyance. Spire.XLS for Java provides interfaces such as IShapeLineFormat, IShapeFill, and IShadow, enabling users to customize the line style, line color, fill, and shadow effect of a shape.
The steps to format a shape in Excel are as follows:
- Create a Workbook object.
- Get a specific worksheet using the Workbook.Worksheets[index] property.
- Add a shape to the worksheet using the Worksheet.PrstGeomShapes.AddPrstGeomShape() method, specifying the location, size and type of the shape.
- Get the IShapeLineFormat object through the IShape.Line property.
- Set the line style, color, width and visibility using the properties under the IShapeLineFormat object.
- Get the IShapeFill object through the IShape.Fill property.
- Set the fill type, and fill color (or image, pattern, texture) using the properties under the IShapeFill object.
- Save the workbook to an Excel file.
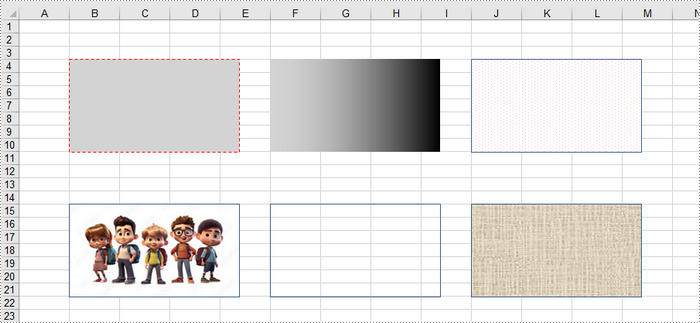
The following code demonstrates various methods for customizing shapes in Excel, including line styles, fill types (solid, gradient, pattern, texture), and the use of images.
- C#
using Spire.Xls;
using Spire.Xls.Core;
using System.Drawing;

namespace FormatShapesInExcel
{
    class Program
    {
        static void Main(string[] args)
        {
            // Create a Workbook object
            Workbook workbook = new Workbook();

            // Get the first worksheet
            Worksheet sheet = workbook.Worksheets[0];

            // Add the first rectangle to the worksheet
            IPrstGeomShape rectangle_one = sheet.PrstGeomShapes.AddPrstGeomShape(4, 2, 220, 120, PrstGeomShapeType.Rect);

            // Set the line style, width, and color
            rectangle_one.Line.DashStyle = ShapeDashLineStyleType.Dashed;
            rectangle_one.Line.Weight = 1.0;
            rectangle_one.Line.ForeColor = Color.Red;

            // Set the fill type and fore color
            rectangle_one.Fill.FillType = ShapeFillType.SolidColor;
            rectangle_one.Fill.ForeColor = Color.LightGray;

            // Add the second rectangle and format the shape
            IPrstGeomShape rectangle_two = sheet.PrstGeomShapes.AddPrstGeomShape(4, 6, 220, 120, PrstGeomShapeType.Rect);
            rectangle_two.Line.Visible = false;
            rectangle_two.Fill.FillType = ShapeFillType.Gradient;
            rectangle_two.Fill.ForeColor = Color.LightGray;
            rectangle_two.Fill.GradientStyle = GradientStyleType.Vertical;

            // Add the third rectangle and format the shape
            IPrstGeomShape rectangle_three = sheet.PrstGeomShapes.AddPrstGeomShape(4, 10, 220, 120, PrstGeomShapeType.Rect);
            rectangle_three.Line.Weight = 1.0;
            rectangle_three.Fill.FillType = ShapeFillType.Pattern;
            rectangle_three.Fill.Pattern = GradientPatternType.Pat80Percent;
            rectangle_three.Fill.ForeColor = Color.White;
            rectangle_three.Fill.BackColor = Color.Pink;

            // Add the fourth rectangle and format the shape
            IPrstGeomShape rectangle_four = sheet.PrstGeomShapes.AddPrstGeomShape(15, 2, 220, 120, PrstGeomShapeType.Rect);
            rectangle_four.Line.Weight = 1.0;
            rectangle_four.Fill.CustomPicture("C:\\Users\\Administrator\\Desktop\\cartoon.jpeg");

            // Add the fifth rectangle and format the shape
            IPrstGeomShape rectangle_five = sheet.PrstGeomShapes.AddPrstGeomShape(15, 6, 220, 120, PrstGeomShapeType.Rect);
            rectangle_five.Line.Weight = 1.0;
            rectangle_five.Fill.FillType  = ShapeFillType.NoFill;

            // Add the sixth rectangle and format the shape
            IPrstGeomShape rectangle_six = sheet.PrstGeomShapes.AddPrstGeomShape(15, 10, 220, 120, PrstGeomShapeType.Rect);
            rectangle_six.Line.Weight = 1.0;
            rectangle_six.Fill.FillType = ShapeFillType.Texture;
            rectangle_six.Fill.Texture = GradientTextureType.Canvas;

            // Save the workbook to an Excel file
            workbook.SaveToFile("FormatShapes.xlsx", ExcelVersion.Version2016);

            // Dispose resources
            workbook.Dispose();
        }
    }
}
Remove Shapes from Excel in C#
The Worksheet.PrstGeomShapes property returns a collection of shapes within a worksheet. To remove a specific shape from the collection, use the PrstGeomShapeCollection[index].Remove() method, where the index specifies the shape's position. To delete all shapes, you can iterate through the collection and remove each shape individually.
The steps to remove a shape in an Excel worksheet are as follows:
- Create a Workbook object.
- Load an Excel file using the Workbook.LoadFromFile() method.
- Get a specific worksheet through the Workbook.Worksheets[index] property.
- Get the shape collection through the Worksheet.PrstGeomShapes property.
- Remove a specific shape using the PrstGeomShapeCollection[index].Remove() method.
- Save the workbook to a different Excel file.
The following code demonstrates how to load an existing Excel file, remove specific shapes or all shapes from a worksheet.
- C#
using Spire.Xls;
using Spire.Xls.Core.Spreadsheet.Collections;

namespace RemoveShapesFromExcel
{
    class Program
    {
        static void Main(string[] args)
        {
            // Create a Workbook object
            Workbook workbook = new Workbook();

            // Load an Excel file
            workbook.LoadFromFile("C:\\Users\\Administrator\\Desktop\\Shapes.xlsx");

            // Get a specific worksheet
            Worksheet sheet = workbook.Worksheets[0];

            // Get the shape collection from the worksheet
            PrstGeomShapeCollection shapes = sheet.PrstGeomShapes;

            // Remove a specific shape
            shapes[1].Remove();

            /*
            // Remove all shapes
            for (int i = shapes.Count - 1; i >= 0; i--)
            {
                shapes[i].Remove();
            }
            */

            // Save the workbook to an Excel file
            workbook.SaveToFile("RemoveShape.xlsx", ExcelVersion.Version2013);

            // Dispose resources
            workbook.Dispose();
        }
    }
}
Apply for a Temporary License
If you'd like to remove the evaluation message from the generated documents, or to get rid of the function limitations, please request a 30-day trial license for yourself.
Spire.Presentation has a powerful function to print PowerPoint document. From Spire.Presentation v 2.8.59, it supports to use the PrintDocument object to print the presentation slides. This example shows how to print presentation slides using C# via the following print methods:
- Print PowerPoint document to default printer.
- Print PowerPoint document to virtual printer.
- Print some pages from the PowerPoint document and set the document name, number of copies while printing the presentation slides.
Print presentation slides to default printer and print all the pages on the PowerPoint document.
using Spire.Presentation;
using System.Drawing.Printing;
namespace PrintPPT
{

    class Program
    {

        static void Main(string[] args)
        {
            Presentation ppt = new Presentation();
            ppt.LoadFromFile("Sample.pptx");

            PresentationPrintDocument document = new PresentationPrintDocument(ppt);
            document.PrintController = new StandardPrintController();

            ppt.Print(document);


        }
    }
}
Print PowerPoint document to virtual printer (Microsoft XPS Document Writer).
using Spire.Presentation;
namespace PrintPPT
{

    class Program
    {

        static void Main(string[] args)
        {
            Presentation ppt = new Presentation();
            ppt.LoadFromFile("Sample.pptx");

            PresentationPrintDocument document = new PresentationPrintDocument(ppt);
            document.PrinterSettings.PrinterName = "Microsoft XPS Document Writer";

            ppt.Print(document);


        }
    }
}
Print some pages from the PowerPoint document and set the document name, number of copies while printing the presentation slides.
using Spire.Presentation;
using System.Drawing.Printing;
namespace PrintPPT
{

    class Program
    {

        static void Main(string[] args)
        {
            Presentation ppt = new Presentation();
            ppt.LoadFromFile("Sample.pptx");

            PresentationPrintDocument document = new PresentationPrintDocument(ppt);

            //Set the document name to display while printing the document
            document.DocumentName = "Print PowerPoint";

            //Choose to print some pages from the PowerPoint document
            document.PrinterSettings.PrintRange = PrintRange.SomePages;
            document.PrinterSettings.FromPage = 1;
            document.PrinterSettings.ToPage = 2;

            //Set the number of copies of the document to print
            document.PrinterSettings.Copies = 2;

            ppt.Print(document);


        }
    }
}
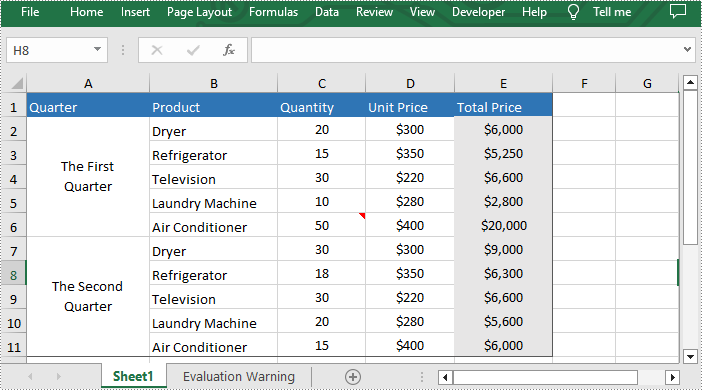
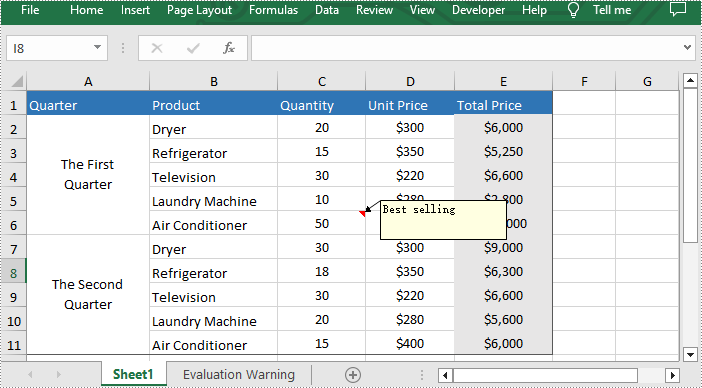
Comments in Excel are blocks of text that can be added to cells, mainly used to provide additional explanation or supplemental information about the cell contents. Users can add comments to the specific cells to better explain the data of worksheets. However, sometimes too many comments will cause visual clutter or obstruct other content. To avoid this issue, existing comments can be hidden programmatically to make the worksheet more organized and readable. Hidden comments can also be easily displayed when necessary. In this article, you will learn how to hide or show comments in excel by using Spire.XLS for .NET.
Install Spire.XLS for .NET
To begin with, you need to add the DLL files included in the Spire.XLS for.NET package as references in your .NET project. The DLLs files can be either downloaded from this link or installed via NuGet.
PM> Install-Package Spire.XLS
Hide Comments in Excel
Spire.XLS for .NET provides the Worksheet.Comments[].IsVisble property to control the visibility of comments. You can easily hide existing comments by setting this property to "false". The following are the detailed steps to hide comments in excel.
- Initialize a Workbook instance.
- Load a sample file using Workbook.LoadFromFile() method.
- Get the desired worksheet through Workbook.Worksheets[] property.
- Hide the specific comment in the worksheet by setting Worksheet.Comments[].IsVisble property to "false".
- Finally, save the result file using Workbook.SavaToFile() method.
- C#
- VB.NET
using Spire.Xls;

namespace ShowExcelComments
{
    class Program
    {
        static void Main(string[] args)
        {
            {
                //Initialize a Workbook instance and load the excel document
                Workbook workbook = new Workbook();
                workbook.LoadFromFile("Comments.xlsx");

                //Get the first worksheet
                Worksheet sheet = workbook.Worksheets[0];

                //Hide the specific comment in the worksheet
                sheet.Comments[0].IsVisible = false;

                //Save the document
                workbook.SaveToFile("HideComment.xlsx", ExcelVersion.Version2013);
                workbook.Dispose();
            }
        }
    }
}
Show Comments in Excel
Hidden comments can also be easily displayed when necessary. If you want to show it again, please set Worksheet.Comments[].IsVisble property to "ture". The following are the steps to show comments in excel.
- Initialize a Workbook instance.
- Load a sample file using Workbook.LoadFromFile() method.
- Get the desired worksheet through Workbook.Worksheets[] property.
- Show the specific comment in the worksheet By setting Worksheet.Comments[].IsVisble property to "true".
- Finally, save the result file using Workbook.SavaToFile() method.
- C#
- VB.NET
using Spire.Xls;

namespace ShowExcelComments
{
    class Program
    {
        static void Main(string[] args)
        {
            {
                //Initialize a Workbook instance and load the excel document
                Workbook workbook = new Workbook();
                workbook.LoadFromFile("HideComment.xlsx");

                //Get the first worksheet
                Worksheet sheet = workbook.Worksheets[0];

                //Show the specific comment in the worksheet
                sheet.Comments[0].IsVisible = true;

                //Save the document
                workbook.SaveToFile("ShowComment.xlsx", ExcelVersion.Version2013);
                workbook.Dispose();
            }
        }
    }
}
Apply for a Temporary License
If you'd like to remove the evaluation message from the generated documents, or to get rid of the function limitations, please request a 30-day trial license for yourself.
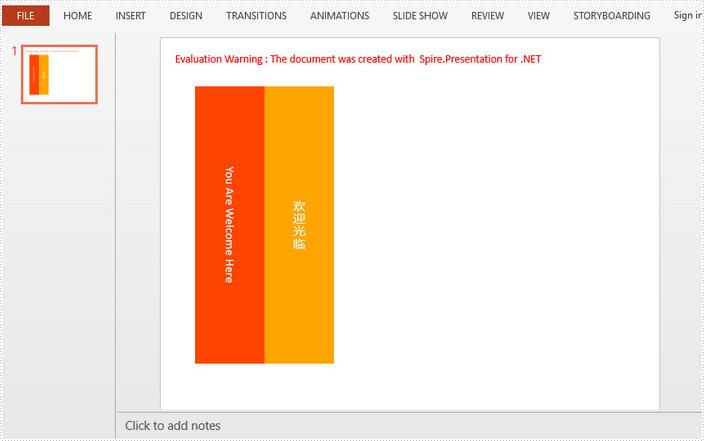
You may sometimes want your text to display vertically (letters stacked one on top of the other), horizontally, or rotated facing the right margin or the left margin. This tutorial shows you how to change the text direction using VerticalTextType property in Spire.Presentation.
Step 1: Initialize an instance of Prensentation class.
Presentation ppt = new Presentation();
Step 2: Append a shape with text to the first slide.
IAutoShape textboxShape = ppt.Slides[0].Shapes.AppendShape(ShapeType.Rectangle, new RectangleF(50, 70, 100, 400));
textboxShape.ShapeStyle.LineColor.Color = Color.Transparent;
textboxShape.Fill.FillType = Spire.Presentation.Drawing.FillFormatType.Solid;
textboxShape.Fill.SolidColor.Color = Color.OrangeRed;
textboxShape.TextFrame.Text = "You Are Welcome Here";
Step 3: Set the text direction to vertical.
textboxShape.TextFrame.VerticalTextType = VerticalTextType.Vertical;
Step 4: Append another shape with text to the slide.
textboxShape = ppt.Slides[0].Shapes.AppendShape(ShapeType.Rectangle, new RectangleF(150, 70, 100, 400));
textboxShape.ShapeStyle.LineColor.Color = Color.Transparent;
textboxShape.Fill.FillType = Spire.Presentation.Drawing.FillFormatType.Solid;
textboxShape.Fill.SolidColor.Color = Color.Orange;
textboxShape.TextFrame.Text = "欢迎光临";
Step 5: For asian characters, you can set the VerticalTextType as EastAsianVertical to aviod rotating text 90 degrees.
textboxShape.TextFrame.VerticalTextType = VerticalTextType.EastAsianVertical;
Step 6: Save the file.
ppt.SaveToFile("output.pptx", FileFormat.Pptx2013);
Output:
Full Code:
using Spire.Presentation;
using System.Drawing;
namespace ChangeTextDirection
{
    class Program
    {
        static void Main(string[] args)
        {

            Presentation ppt = new Presentation();

            IAutoShape textboxShape = ppt.Slides[0].Shapes.AppendShape(ShapeType.Rectangle, new RectangleF(50, 70, 100, 400));
            textboxShape.ShapeStyle.LineColor.Color = Color.Transparent;
            textboxShape.Fill.FillType = Spire.Presentation.Drawing.FillFormatType.Solid;
            textboxShape.Fill.SolidColor.Color = Color.OrangeRed;
            textboxShape.TextFrame.Text = "You Are Welcome Here";
            textboxShape.TextFrame.VerticalTextType = VerticalTextType.Vertical;

            textboxShape = ppt.Slides[0].Shapes.AppendShape(ShapeType.Rectangle, new RectangleF(150, 70, 100, 400));
            textboxShape.ShapeStyle.LineColor.Color = Color.Transparent;
            textboxShape.Fill.FillType = Spire.Presentation.Drawing.FillFormatType.Solid;
            textboxShape.Fill.SolidColor.Color = Color.Orange;
            textboxShape.TextFrame.Text = "欢迎光临";
            textboxShape.TextFrame.VerticalTextType = VerticalTextType.EastAsianVertical;

            ppt.SaveToFile("output.pptx", FileFormat.Pptx2013);

        }
    }
}
Imports Spire.Presentation
Imports System.Drawing
Namespace ChangeTextDirection
	Class Program
		Private Shared Sub Main(args As String())

			Dim ppt As New Presentation()

			Dim textboxShape As IAutoShape = ppt.Slides(0).Shapes.AppendShape(ShapeType.Rectangle, New RectangleF(50, 70, 100, 400))
			textboxShape.ShapeStyle.LineColor.Color = Color.Transparent
			textboxShape.Fill.FillType = Spire.Presentation.Drawing.FillFormatType.Solid
			textboxShape.Fill.SolidColor.Color = Color.OrangeRed
			textboxShape.TextFrame.Text = "You Are Welcome Here"
			textboxShape.TextFrame.VerticalTextType = VerticalTextType.Vertical

			textboxShape = ppt.Slides(0).Shapes.AppendShape(ShapeType.Rectangle, New RectangleF(150, 70, 100, 400))
			textboxShape.ShapeStyle.LineColor.Color = Color.Transparent
			textboxShape.Fill.FillType = Spire.Presentation.Drawing.FillFormatType.Solid
			textboxShape.Fill.SolidColor.Color = Color.Orange
			textboxShape.TextFrame.Text = "欢迎光临"
			textboxShape.TextFrame.VerticalTextType = VerticalTextType.EastAsianVertical

			ppt.SaveToFile("output.pptx", FileFormat.Pptx2013)

		End Sub
	End Class
End Namespace
