
.NET (1327)
Children categories
How to Create Chart Using Excel Data in PowerPoint in C#, VB.NET
2017-09-08 07:11:15 Written by KoohjiWhen creating charts from scratch in PowerPoint slide, an Excel sheet with some dummy data will automatically be generated. The dummy data can be overwritten with the data from data source as well as from an existing Excel file. This article demonstrates how we can create chart in PowerPoint using the data in Excel file.
This solution requires Spire.Presneation.dll and Spire.Xls.dll to be added as references in project. Please download Spire.Office and reference the corresponding DLLs from it.
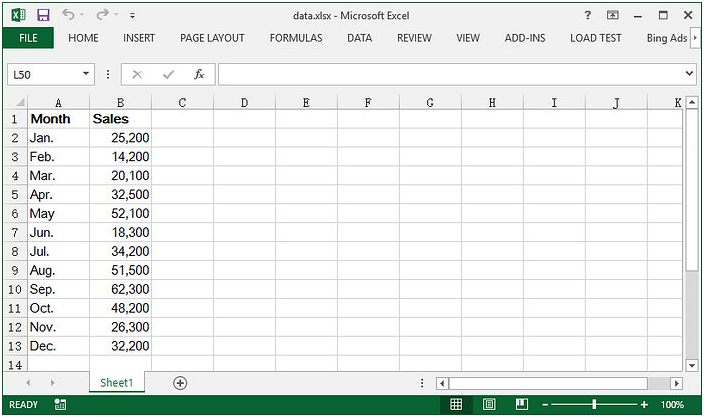
Here is the Excel sheet containing our sample data.
Step 1: Create a Presentation document.
Presentation ppt = new Presentation();
Step 2: Append a column chart in the first slide.
RectangleF rect = new RectangleF(40, 100, 550, 320);
IChart chart = ppt.Slides[0].Shapes.AppendChart(ChartType.ColumnClustered, rect);
Step 3: Clear the default dummy data.
chart.ChartData.Clear(0, 0, 5, 5);
Step 4: Load an existing Excel file to Workbook instance and get the first worksheet.
Workbook wb = new Workbook();
wb.LoadFromFile("data.xlsx");
Worksheet sheet = wb.Worksheets[0];
Step 5: Import data from the worksheet to chart table.
for (int r = 0; r < sheet.AllocatedRange.RowCount; r++)
{
    for (int c = 0; c < sheet.AllocatedRange.ColumnCount; c++)
    {
        chart.ChartData[r, c].Value = sheet.Range[r + 1, c + 1].Value2;
    }
}
Step 6: Set the series label and categories labels.
chart.Series.SeriesLabel = chart.ChartData["B1", "B1"];
chart.Categories.CategoryLabels = chart.ChartData["A2","A13"];
Step 7: Set the series values.
chart.Series[0].Values = chart.ChartData["B2","B13"];
Step 8: Save the file.
ppt.SaveToFile("chart.pptx",Spire.Presentation.FileFormat.Pptx2013);
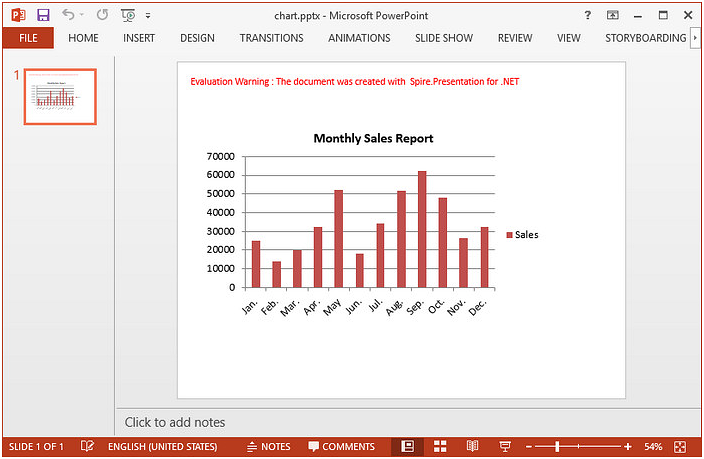
Output:
Full Code:
using System;
using Spire.Presentation;
using System.Drawing;
using Spire.Presentation.Charts;
using Spire.Xls;

namespace CreateChartFromExcelData
{
    class Program
    {
        static void Main(string[] args)
        {
            //initialize an instance of Presentation class
            Presentation ppt = new Presentation();
            RectangleF rect = new RectangleF(40, 100, 550, 320);
            IChart chart = ppt.Slides[0].Shapes.AppendChart(ChartType.ColumnClustered, rect);

            //clear the default dummy data
            chart.ChartData.Clear(0, 0, 5, 5);

            //load an existing Excel file to Workbook object
            Workbook wb = new Workbook();
            wb.LoadFromFile("data.xlsx");
            Worksheet sheet = wb.Worksheets[0];

            //import data from the sheet to chart table
            for (int r = 0; r < sheet.AllocatedRange.RowCount; r++)
            {
                for (int c = 0; c < sheet.AllocatedRange.ColumnCount; c++)
                {
                    chart.ChartData[r, c].Value = sheet.Range[r + 1, c + 1].Value2;
                }
            }

            //add chart title
            chart.ChartTitle.TextProperties.Text = "Monthly Sales Report";
            chart.ChartTitle.TextProperties.IsCentered = true;
            chart.ChartTitle.Height = 30;
            chart.HasTitle = true;

            //set the series label
            chart.Series.SeriesLabel = chart.ChartData["B1", "B1"];

            //set the category labels
            chart.Categories.CategoryLabels = chart.ChartData["A2","A13"];

            //set the series values
            chart.Series[0].Values = chart.ChartData["B2","B13"];

            //save the file
            ppt.SaveToFile("chart.pptx",Spire.Presentation.FileFormat.Pptx2013);
        }
    }
}
Imports Spire.Presentation
Imports System.Drawing
Imports Spire.Presentation.Charts
Imports Spire.Xls

Namespace CreateChartFromExcelData
    Class Program
        Private Shared Sub Main(args As String())
			'initialize an instance of Presentation class
			Dim ppt As New Presentation()

            Dim rect As New RectangleF(40, 100, 550, 320)

            Dim chart As IChart = ppt.Slides(0).Shapes.AppendChart(ChartType.ColumnClustered, rect)

			'clear the default dummy data
			chart.ChartData.Clear(0, 0, 5, 5)

			'load an existing Excel file to Workbook object
			Dim wb As New Workbook()

            wb.LoadFromFile("data.xlsx")
			Dim sheet As Worksheet = wb.Worksheets(0)

			'import data from the sheet to chart table
			For r As Integer = 0 To sheet.AllocatedRange.RowCount - 1
				For c As Integer = 0 To sheet.AllocatedRange.ColumnCount - 1

                    chart.ChartData(r, c).Value = sheet.Range(r + 1, c + 1).Value2
                Next

            Next

			'add chart title
			chart.ChartTitle.TextProperties.Text = "Monthly Sales Report"
			chart.ChartTitle.TextProperties.IsCentered = True
            chart.ChartTitle.Height = 30
			chart.HasTitle = True

			'set the series label

            chart.Series.SeriesLabel = chart.ChartData("B1", "B1")

			'set the category labels

            chart.Categories.CategoryLabels = chart.ChartData("A2", "A13")

			'set the series values

            chart.Series(0).Values = chart.ChartData("B2", "B13")

			'save the file
			ppt.SaveToFile("chart.pptx", Spire.Presentation.FileFormat.Pptx2013)
		End Sub

    End Class
End Namespace
With the help of Spire.XLS, we can set the conditional format the Excel cell in C# and VB.NET. We can also use Spire.XLS to remove the conditional format from a specific cell or the entire Excel worksheet. This article will demonstrate how to remove conditional format from Excel in C#.
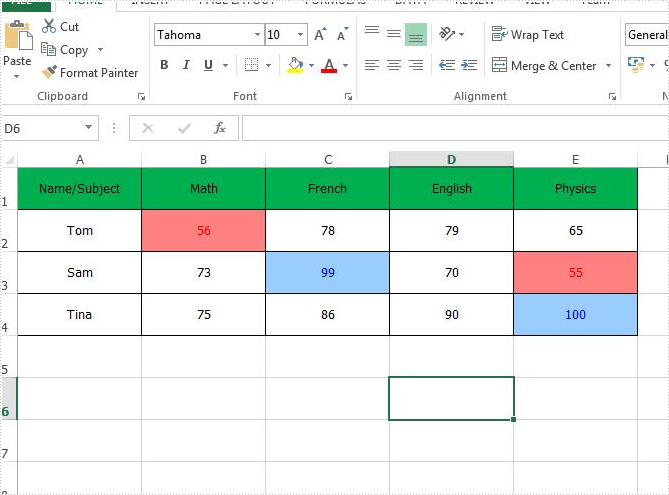
Firstly, view the original Excel worksheet with conditional formats:
Step 1: Create an instance of Excel workbook and load the document from file.
Workbook workbook = new Workbook();
workbook.LoadFromFile("Sample.xlsx");
Step 2: Get the first worksheet from the workbook.
Worksheet sheet = workbook.Worksheets[0];
Step 3: Remove the first conditional format.
sheet.ConditionalFormats.RemoveAt(0);
Step 4: Remove all the conditional formats from the whole Excel worksheet.
for (int i = sheet.ConditionalFormats.Count-1; i >= 0; i--)
{
sheet.ConditionalFormats.RemoveAt(i);
}
Step 5: Save the document to file.
workbook.SaveToFile("Result.xlsx", ExcelVersion.Version2010);
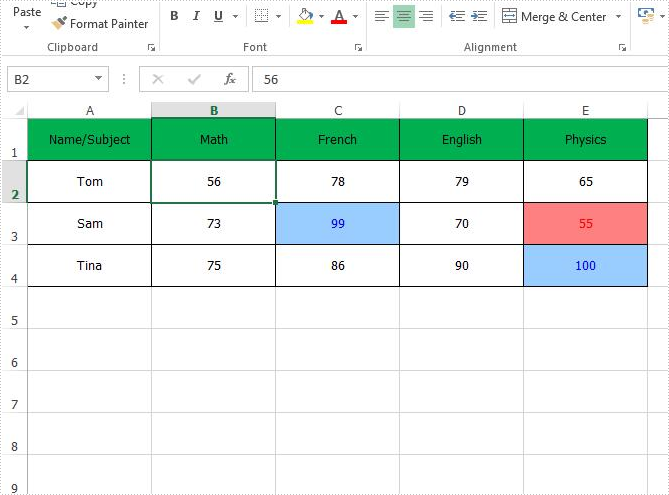
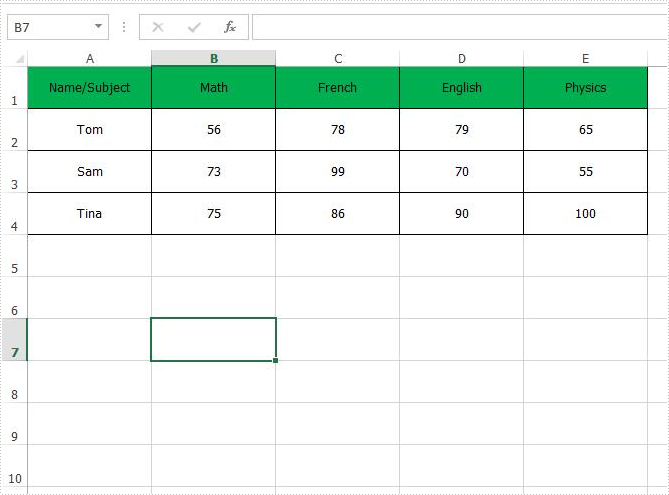
Remove the conditional format from a special Excel range B2:
Remove all the conditional formats from the entire Excel worksheet:
Full codes of how to remove the conditional formats from Excel worksheet:
using Spire.Xls;

namespace RemoveConditionalFormat
{
    class Program
    {
        static void Main(string[] args)
        {
            Workbook workbook = new Workbook();
            workbook.LoadFromFile("Sample.xlsx");

            Worksheet sheet = workbook.Worksheets[0];

            // Remove the first conditional format
            //sheet.ConditionalFormats.RemoveAt(0);

            // Remove all conditional formats
            for (int i = sheet.ConditionalFormats.Count-1; i >= 0; i--)
            {
                sheet.ConditionalFormats.RemoveAt(i);
            }

            workbook.SaveToFile("Result.xlsx", ExcelVersion.Version2010);
        }
    }
}
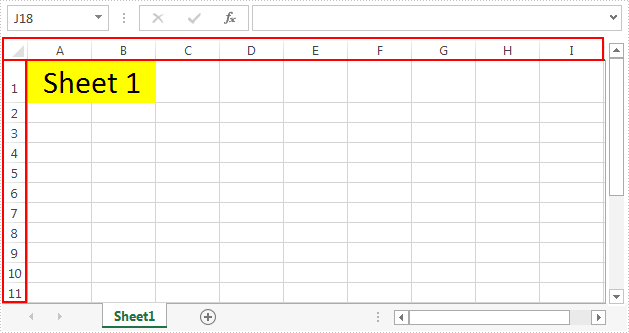
In Spire.XLS, we can hide or show the headers of rows and columns by setting the RowColumnHeadersVisible property of XlsWorksheet class. This article elaborates the steps of how to accomplish this function using Spire.XLS.
The following screenshot shows the input file which contain one worksheet with row and column headers.
Detail steps:
Step 1: Instantiate a Workbook instance and load the Excel file.
Workbook workbook = new Workbook();
workbook.LoadFromFile("Input.xlsx");
Step 2: Get the first worksheet.
Worksheet sheet = workbook.Worksheets[0];
Step 3: Hide or show the headers of rows and columns in the worksheet.
//Hide the headers of rows and columns
sheet.RowColumnHeadersVisible = false;

//Show the headers of rows and columns
//sheet.RowColumnHeadersVisible = true;
Step 4: Save the file.
workbook.SaveToFile("Output.xlsx");
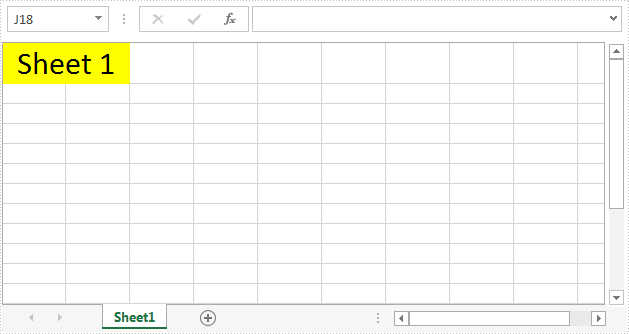
The screenshot after hiding the row and column headers:
Full code:
using Spire.Xls;
namespace ShowRowColumnHeader
{
    class Program
    {

        static void Main(string[] args)
        {
            // Instantiate a Workbook instance
            Workbook workbook = new Workbook();
            //Load the Excel file
            workbook.LoadFromFile("Input.xlsx");

            //Get the first worksheet
            Worksheet sheet = workbook.Worksheets[0];

            //Hide the headers of rows and columns
            sheet.RowColumnHeadersVisible = false;

            //Show the headers of rows and columns
            //sheet.RowColumnHeadersVisible = true;

            //Save the file
            workbook.SaveToFile("Output.xlsx");
        }
    }
}
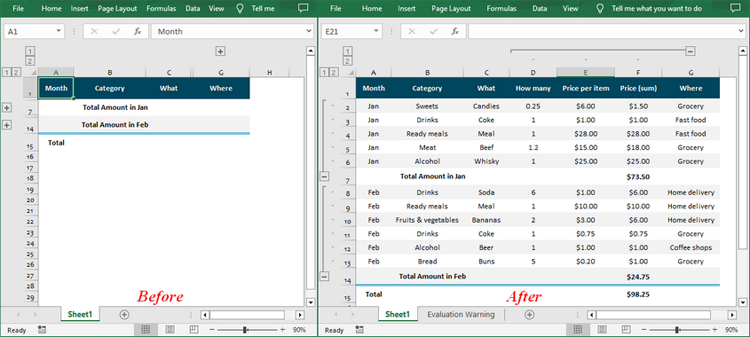
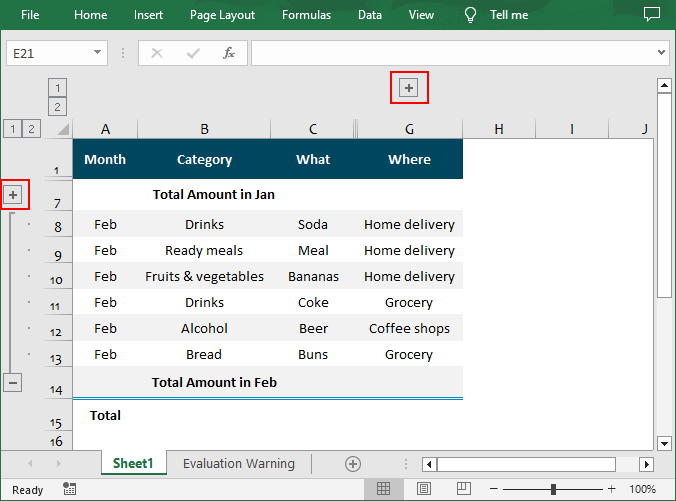
In Excel, you can group related rows and columns to better organize and manage data. This feature is especially useful for simplifying complex spreadsheets, making data easier to navigate and analyze. When data is grouped, Excel provides the option to expand or collapse the groups, allowing users to control how much information is displayed at any given time. In this article, you will learn how to expand or collapse rows and columns in Excel in C# using Spire.XLS for .NET.
Install Spire.XLS for .NET
To begin with, you need to add the DLL files included in the Spire.XLS for .NET package as references in your .NET project. The DLL files can be either downloaded from this link or installed via NuGet.
PM> Install-Package Spire.XLS
Expand Rows and Columns in Excel in C#
Expanding a group reveals all the detailed data within it. Using Spire.XLS for .NET, you can expand the grouped columns or rows through the Worksheet.Range[].ExpandGroup() method. The following are the detailed steps:
- Create a Workbook instance.
- Load an Excel file using Workbook.LoadFromFile() method.
- Get a specified worksheet using Workbook.Worksheets[] property.
- Expand the grouped rows using Worksheet.Range[].ExpandGroup(GroupByType.ByRows) method.
- Expand the grouped columns using Worksheet.Range[].ExpandGroup(GroupByType.ByColumns) method.
- Save the result file using Workbook.SaveToFile() method.
- C#
using Spire.Xls;
namespace ExpandandExcelGroups
{
    class Program
    {
        static void Main(string[] args)
        {
            // Create Workbook instance
            Workbook workbook = new Workbook();

            // Load an Excel file
            workbook.LoadFromFile("Grouped.xlsx");

            // Get the first worksheet
            Worksheet sheet = workbook.Worksheets[0];

            // Expand the grouped rows
            sheet.Range["A2:G6"].ExpandGroup(GroupByType.ByRows, ExpandCollapseFlags.ExpandParent);
            sheet.Range["A8:G13"].ExpandGroup(GroupByType.ByRows);

            // Expand the grouped columns
            sheet.Range["D2:G13"].ExpandGroup(GroupByType.ByColumns);

            // Save the result file
            workbook.SaveToFile("ExpandGroups.xlsx");
        }
    }
}
Collapse Rows and Columns in Excel in C#
Collapsing a group hides the information, showing only the summary or parent data. To collapse rows or columns in Excel, you can use the Worksheet.Range[].CollapseGroup() method. The following are the detailed steps:
- Create a Workbook instance.
- Load an Excel file using Workbook.LoadFromFile() method.
- Get a specified worksheet using Workbook.Worksheets[] property.
- Collapse the rows using Worksheet.Range[].CollapseGroup(GroupByType.ByRows) method.
- Collapse the columns using Worksheet.Range[].CollapseGroup(GroupByType.ByColumns) method.
- Save the result file using Workbook.SaveToFile() method.
- C#
using Spire.Xls;
namespace CollapseExcelGroups
{
    class Program
    {
        static void Main(string[] args)
        {
            // Create Workbook instance
            Workbook workbook = new Workbook();

            // Load an Excel file
            workbook.LoadFromFile("ExpandGroups.xlsx");

            // Get the first worksheet
            Worksheet sheet = workbook.Worksheets[0];

            // Collapse rows
            sheet.Range["A2:A6"].CollapseGroup(GroupByType.ByRows);

            // Collapse Columns
            sheet.Range["D1:G1"].CollapseGroup(GroupByType.ByColumns);

            // Save the result file
            workbook.SaveToFile("CollapseGroups.xlsx");
        }
    }
}
Apply for a Temporary License
If you'd like to remove the evaluation message from the generated documents, or to get rid of the function limitations, please request a 30-day trial license for yourself.
