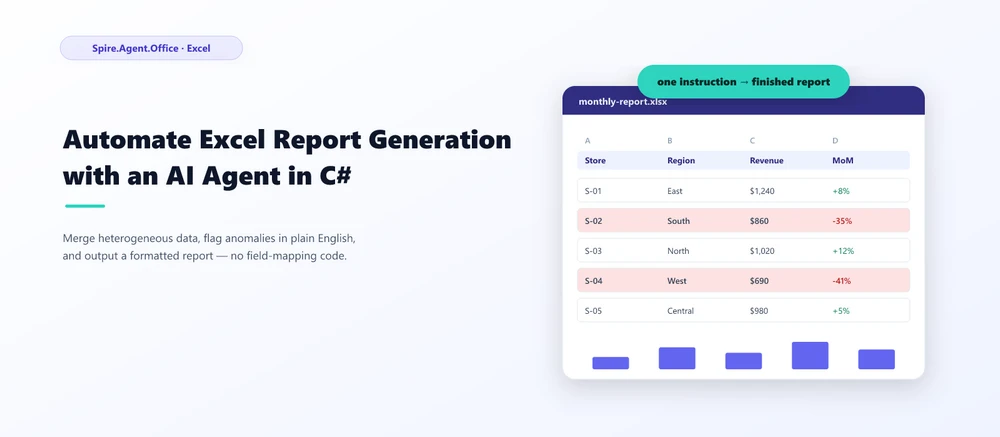
AI for Excel in C# means pairing a language model's judgment with a real Excel-processing library inside a .NET application, so the application can merge, normalize, analyze, and format spreadsheet data from natural-language instructions instead of column-by-column code. The hard part of Excel reporting has rarely been drawing the final chart — it is turning a pile of inconsistent source workbooks into data you can actually trust. With an AI agent you describe the reporting task ("merge these 20 store workbooks and flag stores whose revenue fell more than 30%") and get back a formatted workbook, not a chat answer. Spire.Agent.Office supplies both halves: the language understanding and a deterministic document layer that guarantees a real .xlsx (or PDF) comes out.
Quick Navigation
- From Heterogeneous Workbooks to a Common Data Model
- Turning Business Rules into Natural-Language Analysis
- From Analysis to a Management-Ready Report
- Building the Workflow in C#
- FAQ
1. The Real Bottleneck in Excel Report Automation
Take the recurring task behind most "monthly reporting" requests. An operations team runs 20 regional stores, and each store sends a sales workbook at month-end. In theory this is one report. In practice it is twenty different files that happen to share a filename pattern:
- The columns do not match. One store calls the figure
Revenue, anotherSales Amount, a thirdNet Sales. - The layout does not match. One store puts months across columns, another across rows, a third tacks a notes column in the middle.
- The data types do not match. Dates come in as text, numbers come in as thousands, and at least one store merges a title row into the header.
So before anyone can produce a chart for management, an analyst spends the week opening files, mapping columns, normalizing dates, hunting for typos, and only then checking for anomalies and assembling the report. None of that is the "report generation" part. It is all data preparation.
The point to internalize: the difficult part of Excel reporting is rarely creating the final chart. It is turning inconsistent source workbooks into data that can actually be trusted. A chart library will happily plot wrong data; what the team lacks is a reliable path from raw inbox files to a clean, comparable table. That path is exactly where an AI agent changes the economics.
2. What Changes When an AI Agent Enters the Workflow
Automation of this task is not new — it is just normally expensive. Compare the two workflows:
Traditional automation
Inspect files
→ map columns
→ normalize data
→ write rules
→ generate workbook
Every step before the last one is pre-defined: you write a column map for each known header, a date parser for each known format, and a threshold for each rule. The moment a store renames a column or a business rule changes, the map and the rules are wrong, and a human re-enters the loop.
Agent automation
Describe the reporting task
→ provide source workbooks
→ review result
The agent reads the meaning of each workbook rather than a fixed position, so the column map and the rule set no longer have to be enumerated up front. What it removes is precisely the expensive part: the work of pre-defining a schema and a rule set that will break on the next file.
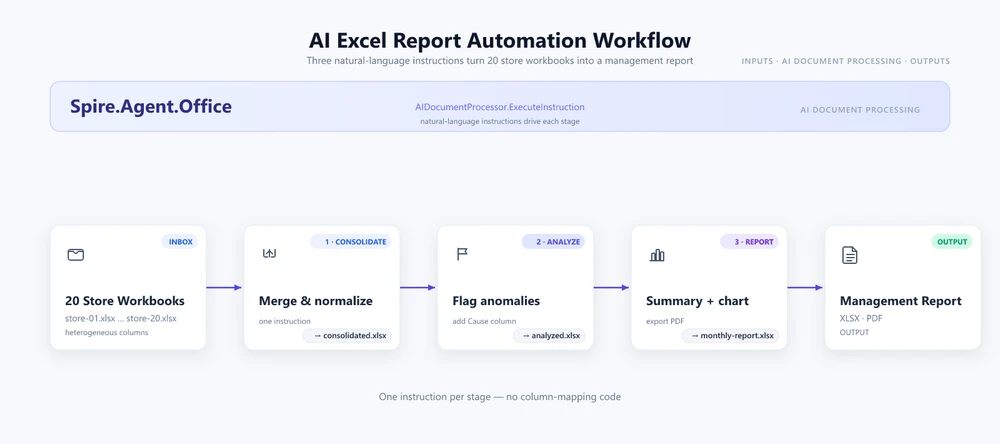
The rest of this article walks that pipeline once, from raw workbooks to a printed PDF, using the 20-store scenario as the running example. Sections 3 through 5 explain what the agent does at each stage; section 6 gives the complete C# that drives it.
3. From Heterogeneous Workbooks to a Common Data Model
The Excel-specific version of the problem is that different workbooks "look the same" without actually being the same. Three stores can each send a table with four columns and still give you no way to merge them without human interpretation:
| Store A | Store B | Store C |
|---|---|---|
| Revenue | Sales Amount | Net Sales |
| Month | Reporting Period | Date |
| Units | Quantity Sold | Qty |
There is no column index that maps these onto each other, because the mapping is semantic, not positional. Revenue, Sales Amount, and Net Sales are three names for the same concept, and only understanding the header means you can align them.
The agent's consolidation step turns that semantic alignment into a single schema:
Store / Region / SKU / UnitsSold / Revenue / Month
It reads each source workbook, resolves the header names against that target model, aligns rows and columns, skips duplicate header and title rows, and writes one normalized table. The developer never writes a FindColumnByHeader("Revenue") routine — the instruction names the target schema, and the agent works out the mapping from each file.
This is the stage with the largest one-off payoff, because it is the stage that currently consumes the most analyst time and breaks most often when a new store joins.
4. Turning Business Rules into Natural-Language Analysis
Once the data is in one place, reporting needs judgment, and judgment is where hardcoded rules fail. The running example uses a typical finance rule:
Flag rows where revenue fell by more than 30% or grew by more than 50% versus the prior month.
Notice how much is packed into that sentence, and how awkward each part is as code:
-
Why 30% and 50%? Those are business thresholds with context — a seasonal store, a new SKU, or a promotion changes what "unusual" means. A hardcoded
if (change < -0.30)treats every store identically and fires false alarms on seasonality. - How do you change it? In code, you recompile and redeploy. In the instruction, the analyst edits one sentence: "fell by more than 20%," or "only for the East region," or "flag only SKUs with more than 100 units sold."
- Add a dimension? Want the rule applied per store and per region and per month? You add a clause to the instruction, not a nested loop.
-
Explain the result? The agent can append a
Causecolumn with a one-sentence likely explanation for each flagged row — something a threshold comparison alone can never produce.
The principle that falls out of this section is worth stating plainly:
Code defines how; instructions define what.
The developer stops encoding the rule and starts describing the outcome. The rule stays readable, editable by the business, and survives a new store or a changed threshold without a code change.
For a complete worked example of the same instruction-driven analysis applied to a ranking workflow, see the Student Score Analysis and Ranking tutorial.
5. From Analysis to a Management-Ready Report
Finding anomalies is only half of reporting. The result still has to become a workbook someone can actually use — the analyst's spreadsheet is not the deliverable; the management summary is.
The pipeline completes like this:
Raw Workbooks
      ↓
Consolidated Data
      ↓
Anomalies
      ↓
Management Summary
      ↓
PDF
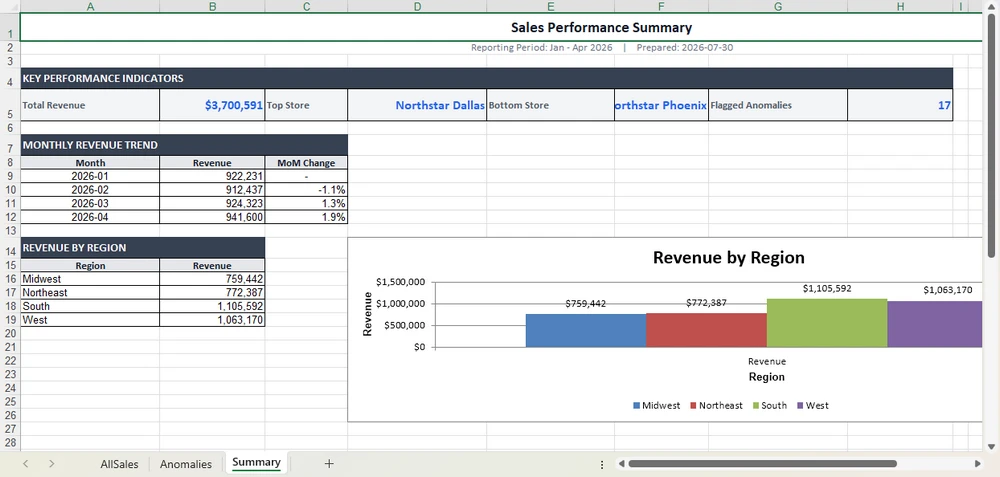
The final instruction composes the deliverable: a Summary sheet up front with a KPI block (total revenue, top store, bottom store, count of flagged anomalies), a monthly trend table, a bar chart of revenue by region, and print-ready formatting. Pointing the same instruction at a .pdf path exports the identical report as a PDF for distribution, with no separate rendering step.
The point to carry forward: analysis and composition are two different jobs, and the agent does both. The analyst's job becomes reviewing the flagged shortlist and signing off, not rebuilding the deck each month.
6. Building the Workflow in C#
All the pieces above are driven by one C# pipeline. Configure the agent once, then run three instructions in sequence: consolidate, analyze, report. The full setup — token, packages, and project wiring — is documented step by step in the Getting Started tutorial; here we focus on the workflow itself.
using System.IO;
using Spire.Xls;
using Spire.Agent.Office.AI;
using Spire.Agent.Office.Extensions;

AIOptions options = new AIOptions {
    SpireToken = spireToken,
    WorkDir = @"C:\retail-ops\output",
    TimeoutMs = 300000
};

string[] storeFiles = Directory.GetFiles(@"C:\retail-ops\inbox", "*.xlsx");
Directory.CreateDirectory(@"C:\retail-ops\output");
1. Consolidate. Pass the 20 inbox files as attachments and name the target schema. The normalization from section 3 happens here, driven by the instruction rather than any column map:
using (Workbook consolidated = new Workbook())
{
    AIResult result = consolidated.AI(options).ExecuteInstruction(
        consolidated,
        "Read every regional sales workbook in the inbox and merge them into one worksheet. " +
        "Each store names its columns differently (for example Sales vs Amount, Month vs Period); " +
        "normalize them to a single schema: Store, Region, SKU, UnitsSold, Revenue, Month. Skip " +
        "duplicate header rows and save the merged result as a workbook.",
        @"C:\retail-ops\output\consolidated.xlsx",
        storeFiles);

    if (result == null || !result.Success)
        throw new InvalidOperationException($"Consolidation failed: {result?.ErrorMessage}");
}
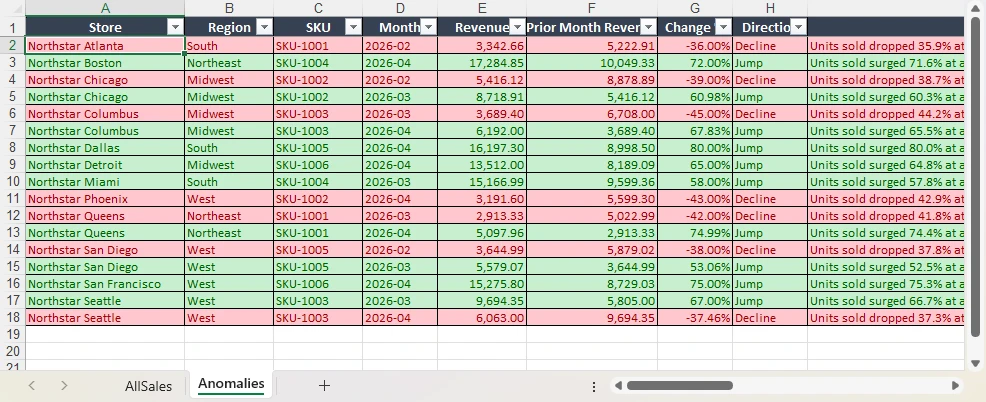
2. Analyze. Load the consolidated file and state the rule from section 4 in plain English. The agent adds an Anomalies sheet and leaves the source data untouched:
using (Workbook analysis = new Workbook())
{
    analysis.LoadFromFile(@"C:\retail-ops\output\consolidated.xlsx");

    AIResult result = analysis.AI(options).ExecuteInstruction(
        analysis,
        "Add an 'Anomalies' sheet. Compare each store and SKU's Revenue against the prior " +
        "month, flag rows where revenue fell by more than 30% or grew by more than 50%, apply " +
        "a red fill to declines and a green fill to jumps, and add a 'Cause' column with a " +
        "one-sentence likely explanation. Leave the original data sheets unchanged.",
        @"C:\retail-ops\output\analyzed.xlsx");

    if (result == null || !result.Success)
        throw new InvalidOperationException($"Analysis failed: {result?.ErrorMessage}");
}
The Anomalies sheet lands alongside the source data, with the flagged rows, fills, and Cause column applied by the instruction:
3. Report. Compose the management summary from section 5 and export it. The savePath alone chooses the format — .xlsx here, .pdf for distribution:
using (Workbook report = new Workbook())
{
    report.LoadFromFile(@"C:\retail-ops\output\analyzed.xlsx");

    AIResult result = report.AI(options).ExecuteInstruction(
        report,
        "Produce a management report. Add a 'Summary' sheet at the front with a KPI block " +
        "(total revenue, top store, bottom store, count of flagged anomalies), a monthly trend " +
        "table, and a bar chart of revenue by region. Format it for print and save the finished " +
        "workbook.",
        @"C:\retail-ops\output\monthly-report.xlsx");

    if (result == null || !result.Success)
        throw new InvalidOperationException($"Report generation failed: {result?.ErrorMessage}");
}
The Summary sheet lands at the front of the workbook, ready for print or PDF export:
Key API Calls
-
Workbook.AI(options)— attaches the AI document processor to an existing workbook object -
ExecuteInstruction(doc, instruction, savePath, attachments)— runs one stage and writes the result -
AIResult.Success/AIResult.ErrorMessage— verifies each stage and surfaces failures
What You Would Write Without the Agent
For contrast, the traditional SDK route for the same three stages locates each column by header string, hardcodes every threshold, and sets every fill cell by cell — and re-tunes all of it when a store renames a column or the rule changes:
foreach (string file in storeFiles)
{
    Workbook wb = new Workbook();
    wb.LoadFromFile(file);
    Worksheet sheet = wb.Worksheets[0];

    // Fails the moment a store names the column "Sales" instead of "Revenue".
    int revenueCol = FindColumnByHeader(sheet, "Revenue");
    int storeCol   = FindColumnByHeader(sheet, "Store");

    for (int r = sheet.LastRow; r >= 2; r--)
    {
        double current = double.Parse(sheet.Range[r, revenueCol].Text);
        double prior   = double.Parse(sheet.Range[r, revenueCol + 1].Text);
        double change  = (current - prior) / prior;

        // One hardcoded threshold; a seasonal store triggers false alarms.
        if (change < -0.30) sheet.Range[r, revenueCol].Style.Color = Color.Red;
    }
    // ... then merge, then summary, then chart -- hundreds of lines per store and per month.
}
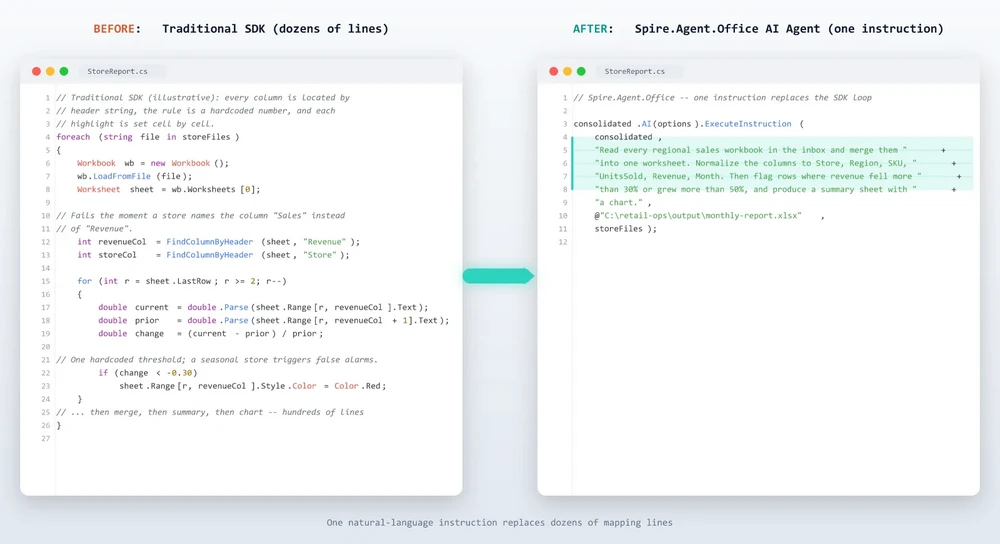
The agent does not remove the need for code — it removes the need for mapping code. The difference is where the logic lives: in a column finder and a threshold, or in a sentence the business can read and edit.
7. Where AI Stops and Application Logic Begins
A more honest way to think about the boundary than a list of "can and cannot": the agent does not eliminate deterministic application logic — it sits on top of it.
The application still owns everything that has nothing to do with understanding the spreadsheet:
- File discovery and access — finding the inbox files, checking permissions, and staging them
- Workflow scheduling — when the report runs, on what trigger, and in what order
- Data source control — which files are authorized inputs and where they come from
- Error handling and retries — what happens when a file is missing or a stage fails
- Final approval — a human reviews the flagged anomalies before sign-off
- External reconciliation — matching the report against a system of record
The agent owns the parts that are genuinely semantic:
- Understanding — reading what each column actually means
- Normalization — aligning heterogeneous schemas into one model
- Interpretation — applying a business rule to decide what is unusual
- Transformation — turning raw data into a summary, a chart, and formatting
- Composition — assembling the final workbook or PDF
This framing is more useful than a capability table because it tells you where to put your engineering effort. Keep the deterministic plumbing in code — where it is testable and auditable — and hand the semantic work to the agent. Each side does what it is good at.
8. Adding AI to an Existing .NET Excel Workflow
The last thing worth making explicit is how little you have to rebuild to get there. If your application already works with Excel through Spire.Xls, the document model you already hold is the integration point:
Workbook
   ↓
Workbook.AI(options)
   ↓
ExecuteInstruction(...)
You are not introducing a new document layer or a separate document-processing service. You are adding a natural-language execution layer onto the Workbook object you already have. The same object that opened, merged, and saved your files now accepts an instruction and carries out the workflow, with the deterministic Excel engine guaranteeing the output is a real, well-formed file — merged cells, number formats, and charts intact. The same ExecuteInstruction pattern extends to Word and PDF documents — see AI Contract Review in C#.
That is the value proposition for an Excel developer, stated in the terms you already think in: not "adopt an AI platform," but "teach the workbook you already use to take instructions." When a store renames a column or the finance team changes the flagging rule, the fix is an edit to a sentence, not a rebuild of the document pipeline.
9. FAQ
Do I need to send my Excel data to the cloud?
Not necessarily. Spire.Agent.Office runs from your own application, so the SDK and the document processing stay inside your environment; your files are not uploaded to a third-party service for storage or conversion. To analyze content, the AI needs the relevant data, and it is sent to the model for processing — an inherent step of any AI workflow. If you deploy your own model on your local network, the content stays entirely within your infrastructure. If you connect through a hosted model API such as OpenAI or Azure OpenAI, the relevant content is transmitted to that provider over the network per your configuration.
Which Excel formats does it support?
Input covers standard workbook files such as XLSX and XLS, and the agent reads the workbook directly in its native format. Output can be saved as XLSX, XLS, CSV, PDF, or HTML, so the finished report can go straight to an archive or a distribution list.
Can it replace my finance or operations review?
No. The agent automates the reading, normalization, analysis, and formatting — the hours an analyst spends each month — but the final sign-off stays with a human reviewer. Treat the flagged anomalies as a shortlist to verify, not a decision already made.
How is this different from pasting my data into ChatGPT?
A chat model can tell you what looks unusual but cannot place that answer into a styled workbook with a summary sheet, conditional formatting, and a chart, and it cannot export a PDF. An AI Excel agent pairs the language model's judgment with a deterministic Excel layer, so the output is a real, well-formed file your team can open and distribute.
Can I use my own AI model?
Yes. Spire.Agent.Office supports flexible AI model integration and is compatible with mainstream AI infrastructure, including hosted model APIs and privately deployed models. You can point the agent at your own endpoint. For questions about which providers are supported in your deployment, contact us.
Ready to Automate Your Excel Reporting?
Consolidation, anomaly analysis, and report generation are the fastest places to get value: point the agent at the inbox, describe the report, and get a formatted workbook or PDF out. Follow the Getting Started tutorial to run your first spreadsheet workflow in .NET.
Further Reading
- Automating Student Score Analysis and Ranking tutorial -- an Excel workflow the agent runs end to end
- AI Contract Review in C# -- the same instruction-driven pattern applied to Word and PDF documents
- Spire.Agent.Office product overview -- AI agent SDKs for every Office document format