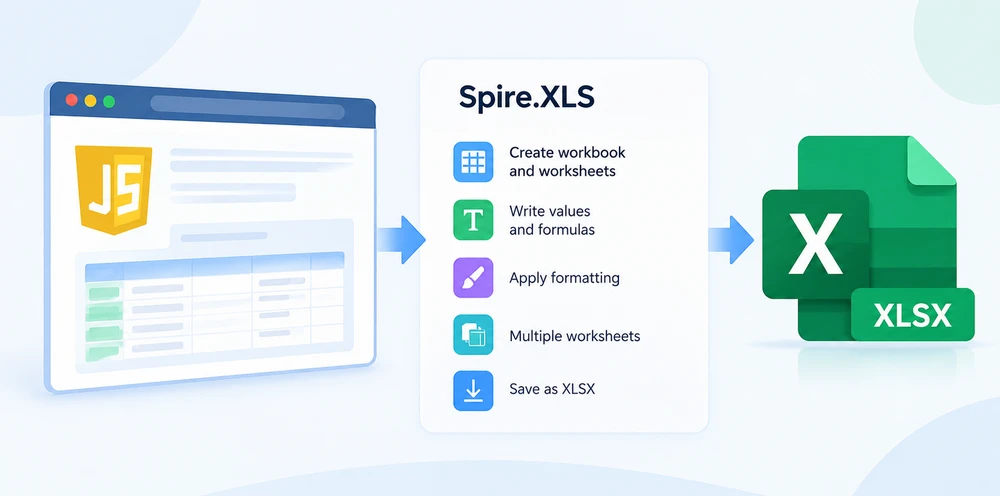
JavaScript can generate Excel workbooks directly in the browser. With Spire.XLS for JavaScript, you can create a workbook, add worksheets, write values and formulas, apply formatting, and save the result as either an XLSX or XLS file—all client-side, with no Microsoft Excel installation required.
This tutorial starts with a basic XLSX workbook and then adds typed cell values, formulas, formatting, multiple worksheets, browser download support, CSV conversion, and XLS output for legacy compatibility.
Install and Initialize Spire.XLS for JavaScript
Spire.XLS for JavaScript ships inside the spire.office package, together with Spire.PDF, Spire.Doc, and Spire.Presentation:
npm i spire.office
Booting the runtime takes two imports. The first starts the shared .NET WebAssembly host; the second registers the spreadsheet API:
// 1. Boot the shared runtime once per page.
const common = await import('/node_modules/spire.office/spire.common.js');
await common.initializeWasm();

// 2. Load the spreadsheet engine — this is what creates window.spirexls.
await import('/node_modules/spire.office/spire.xls.js');
The Spire.*.Wasm.zip archives and the _framework folder must be reachable from the site root. The runtime resolves them against the document URL rather than against the module that performed the import, so in a Vite or Create React App project they have to sit in public/. The process.env.PUBLIC_URL prefix shown in React-based setups is a Create React App convention, not a browser standard — adjust the base path to match your build tool if you are not using CRA. If the archives are missing, the browser logs WebAssembly.compile(): expected magic word — the dev server has answered the archive request with index.html.
Everything then hangs off one global:
const xls = window.spirexls;
In the current package setup used by this tutorial, the spreadsheet API is exposed through window.spirexls. Use that global after the runtime has been initialized. Older releases exposed it as window.wasmModule.spirexls; if you are working with a different package version, check which global is available.
You're now ready to generate Excel files.
Create a Basic Excel File in JavaScript
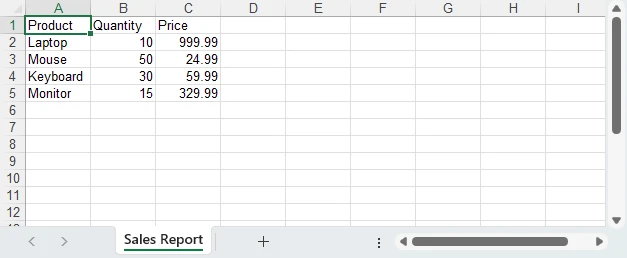
Let's build a sales report. We'll create a workbook, add a worksheet, write product data into cells, and save the result as an XLSX file that downloads automatically.
async function createExcelFile() {
    const xls = window.spirexls;
    if (!xls) {
        console.error('Spire.XLS is not initialized.');
        return;
    }

    // A fresh Workbook() already contains three blank worksheets, so clear them
    // and add the single sheet this report needs.
    const workbook = new xls.Workbook();
    workbook.Worksheets.Clear();
    const sheet = workbook.Worksheets.Add("Sales Report");

    // Sample data: product sales
    const data = [
        ["Product", "Quantity", "Price"],
        ["Laptop", 10, 999.99],
        ["Mouse", 50, 24.99],
        ["Keyboard", 30, 59.99],
        ["Monitor", 15, 329.99]
    ];

    // Write data to cells
    for (let row = 0; row < data.length; row++) {
        for (let col = 0; col < data[row].length; col++) {
            const cell = sheet.Range.get({ row: row + 1, column: col + 1 });
            if (typeof data[row][col] === "string") {
                cell.Text = data[row][col];
            } else {
                cell.NumberValue = data[row][col];
            }
        }
    }

    // Save to the virtual file system, read the bytes, download, then dispose
    const fileName = "SalesReport.xlsx";
    workbook.SaveToFile({
        fileName: fileName,
        version: xls.ExcelVersion.Version2016
    });

    const fileData = window.dotnetRuntime.Module.FS.readFile(fileName);
    const blob = new Blob([fileData], {
        type: "application/vnd.openxmlformats-officedocument.spreadsheetml.sheet"
    });
    const url = URL.createObjectURL(blob);
    const a = document.createElement("a");
    a.href = url;
    a.download = fileName;
    a.click();
    URL.revokeObjectURL(url);

    workbook.Dispose();
}
Call createExcelFile() and you'll get a SalesReport.xlsx with four product rows plus a header. The workflow is simple: create workbook → write data → save → download.
The following sections extend this example. Each code snippet assumes it is added inside createExcelFile() after the workbook and worksheet have been created.
Write Different Data Types to Excel Cells
Excel distinguishes between text, numbers, dates, and booleans. Getting this wrong leads to files where sorting breaks, formulas return errors, and numbers display as text.
const sheet = workbook.Worksheets.get(0);

// Text — for labels, names, descriptions
sheet.Range.get("A1").Text = "Product Name";

// Number — for anything you'll calculate, sort, or filter
sheet.Range.get("B1").NumberValue = 999.99;

// Date — a real DateTimeValue plus a display format
const dateCell = sheet.Range.get("C1");
dateCell.DateTimeValue = new Date(Date.UTC(2025, 2, 15));
dateCell.NumberFormat = "yyyy-mm-dd";

// Boolean — use BooleanValue, not text
sheet.Range.get("D1").BooleanValue = true;
The most common mistake? Writing cell.Text = "999.99" instead of cell.NumberValue = 999.99. The value looks identical when you open the file, but Excel treats it as text—you can't sum it, average it, or sort it numerically. Always use NumberValue for numbers, DateTimeValue for dates, and BooleanValue for booleans.
Dates need one extra precaution. DateTimeValue preserves the UTC instant represented by the JavaScript Date. Creating a date with local midnight can therefore shift the displayed day in some time zones; use Date.UTC() when you want a specific calendar date to be preserved.
Add Formulas to the Excel Worksheet
Formulas make your generated file a real spreadsheet, not just a data dump. Let's add a Total column that calculates Quantity × Price for each row, plus a grand total at the bottom:
// Add "Total" header
sheet.Range.get({ row: 1, column: 4 }).Text = "Total";

// Per-row formula: Total = Quantity × Price
for (let i = 2; i <= 5; i++) {
    sheet.Range.get({ row: i, column: 4 }).Formula = `=B${i}*C${i}`;
}

// Grand total row
sheet.Range.get({ row: 6, column: 1 }).Text = "Total";
sheet.Range.get({ row: 6, column: 2 }).Formula = "=SUM(B2:B5)";
sheet.Range.get({ row: 6, column: 4 }).Formula = "=SUM(D2:D5)";

// Evaluate the formulas once, so their results are written into the file.
workbook.CalculateAllValue();
Call workbook.CalculateAllValue() before saving when you need the generated workbook to contain calculated formula results. This is useful for viewers or applications that rely on cached values instead of recalculating formulas on open.
For a comprehensive guide to Excel functions and formula operations, see Insert or Read Functions and Formulas in Excel Worksheets with JavaScript in React.
Format the Generated Excel File
A spreadsheet with raw data works, but a formatted spreadsheet communicates. Let's turn our sales report into something you'd actually send to a stakeholder:
// Bold, colored header row
const header = sheet.Range.get("A1:D1");
header.Style.Font.IsBold = true;
header.Style.Font.Size = 12;
header.Style.Color = xls.Color.get_LightSkyBlue();

// Currency format for Price and Total columns
for (let i = 2; i <= 5; i++) {
    sheet.Range.get({ row: i, column: 3 }).NumberFormat = "$#,##0.00";
    sheet.Range.get({ row: i, column: 4 }).NumberFormat = "$#,##0.00";
}

// Set column widths explicitly
[26, 10, 12, 12].forEach((width, i) => {
    sheet.Columns.get(i).ColumnWidth = width;
});

// Clean borders
const usedRange = sheet.Range.get("A1:D6");
usedRange.Borders.LineStyle = xls.LineStyleType.Thin;
usedRange.Borders.Color = xls.Color.get_LightSteelBlue();
Two details are worth knowing here. sheet.Columns.get(i) and sheet.Rows.get(i) are 0-based and use get, unlike the get_Item that other collections expose. And in the tested browser setup, AutoFitColumn requires a font that is not available in the WebAssembly sandbox, so setting ColumnWidth explicitly is more reliable.
The result: a bold blue header, currency-formatted prices, properly sized columns, and clean borders.
For detailed guidance on row and column dimensions, see Set Row Height and Column Width in Excel with JavaScript in React.
Create Multiple Worksheets in an Excel Workbook
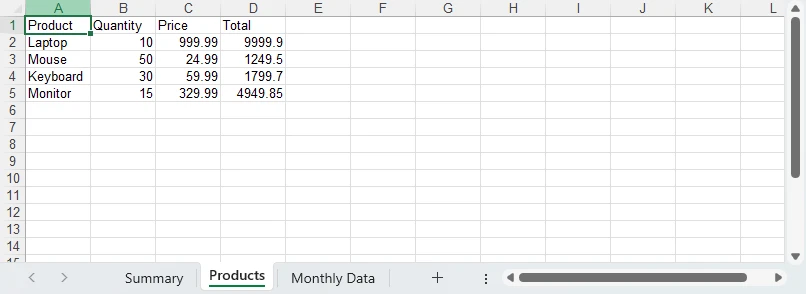
Real reports rarely fit on one sheet. A sales report might have a summary on the first tab, product details on the second, and monthly breakdowns on the third.
workbook.Worksheets.Clear();
const summarySheet = workbook.Worksheets.Add("Summary");
const productsSheet = workbook.Worksheets.Add("Products");
const monthlySheet = workbook.Worksheets.Add("Monthly Data");

// Products sheet — write actual data so cross-sheet formulas work
productsSheet.Range.get("A1").Text = "Product";
productsSheet.Range.get("B1").Text = "Quantity";
productsSheet.Range.get("C1").Text = "Price";
productsSheet.Range.get("D1").Text = "Total";

const products = [
    ["Laptop", 10, 999.99],
    ["Mouse", 50, 24.99],
    ["Keyboard", 30, 59.99],
    ["Monitor", 15, 329.99]
];

for (let i = 0; i < products.length; i++) {
    const row = i + 2;
    productsSheet.Range.get({ row: row, column: 1 }).Text = products[i][0];
    productsSheet.Range.get({ row: row, column: 2 }).NumberValue = products[i][1];
    productsSheet.Range.get({ row: row, column: 3 }).NumberValue = products[i][2];
    productsSheet.Range.get({ row: row, column: 4 }).Formula = `=B${row}*C${row}`;
}

// Summary sheet with cross-sheet reference
summarySheet.Range.get("A1").Text = "Sales Summary";
summarySheet.Range.get("A1").Style.Font.IsBold = true;
summarySheet.Range.get("A2").Text = "Total Products";
summarySheet.Range.get("B2").NumberValue = 4;
summarySheet.Range.get("A3").Text = "Total Revenue";
summarySheet.Range.get("B3").Formula = "=SUM(Products!D2:D5)";
Each Worksheets.Add(name) returns the sheet it just created, in the order the calls are made, so the tab order matches the code order. Notice the cross-sheet formula: =SUM(Products!D2:D5) on the Summary sheet references the Total column on the Products sheet. Excel handles this automatically when the file opens—no extra code needed.
For more on worksheet management — adding, removing, and reordering sheets — see Add, Remove, and Move Excel Worksheets with JavaScript in React.
Save and Download the XLSX File in the Browser
Once your workbook is ready, Spire.XLS saves it to a WebAssembly virtual file system. You then read the file data, convert it to a Blob, and trigger a download:
workbook.SaveToFile({
    fileName: "Report.xlsx",
    version: xls.ExcelVersion.Version2016
});

const fileData = window.dotnetRuntime.Module.FS.readFile("Report.xlsx");
const blob = new Blob([fileData], {
    type: "application/vnd.openxmlformats-officedocument.spreadsheetml.sheet"
});
const url = URL.createObjectURL(blob);
const a = document.createElement("a");
a.href = url;
a.download = "Report.xlsx";
a.click();
URL.revokeObjectURL(url);

workbook.Dispose();
Always call workbook.Dispose() after the download to free memory—especially in apps where users generate multiple files in a session. The workbook itself lives in the WebAssembly heap until you do, and that heap is not reclaimed by the browser's garbage collector.
Looking for React integration or HTML table export? Check out our guide to downloading and exporting Excel files in JavaScript & React.
Putting It Together: A Formatted Sales Report
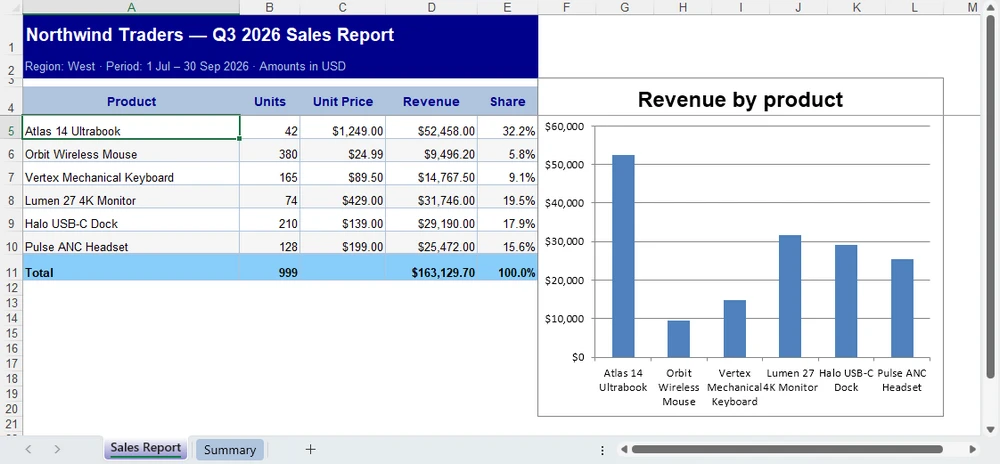
The snippets above build a workbook one concern at a time. Here they are in a single function: a styled worksheet with zebra banding and currency formats, formula-driven revenue and share columns, a column chart, and a second worksheet that rolls the numbers up.
/**
 * Build a formatted sales report workbook in the browser and download it as
 * SalesReport.xlsx.
 *
 * The layout is driven by `products` below — swap it for form input, an API
 * response or component state and nothing else needs to change.
 */
async function createExcelReport() {
  // spire.office 11.7.0 exposes Spire.XLS as `window.spirexls`. Older builds
  // hung it off `window.wasmModule.spirexls`; that global no longer exists.
  const xls = window.spirexls;
  if (!xls) throw new Error('Spire.XLS is not ready yet');

  // [product, units sold, unit price] — revenue and share are derived by formula
  const products = [
    ['Atlas 14 Ultrabook', 42, 1249.0],
    ['Orbit Wireless Mouse', 380, 24.99],
    ['Vertex Mechanical Keyboard', 165, 89.5],
    ['Lumen 27 4K Monitor', 74, 429.0],
    ['Halo USB-C Dock', 210, 139.0],
    ['Pulse ANC Headset', 128, 199.0],
  ];
  const FIRST = 5; // first data row
  const TOTAL = FIRST + products.length; // total row

  const wb = new xls.Workbook();
  wb.Worksheets.Clear();
  const sheet = wb.Worksheets.Add('Sales Report');

  const at = (a) => sheet.Range.get(a);
  const cell = (row, col) => sheet.Range.get({ row: row, column: col });
  const paint = (a, colour) => {
    at(a).Style.Color = colour;
  };

  // ── Sizing ── explicit widths (AutoFitColumn is unreliable in the WASM sandbox)
  [34, 9, 13, 14, 9].forEach((w, i) => {
    sheet.Columns.get(i).ColumnWidth = w;
  });
  sheet.Rows.get(0).RowHeight = 34; // title
  sheet.Rows.get(1).RowHeight = 20; // subtitle
  sheet.Rows.get(2).RowHeight = 8; // spacer
  sheet.Rows.get(3).RowHeight = 24; // header

  // ── Title band ── merge first, then style the whole merged area
  at('A1:E1').Merge();
  cell(1, 1).Text = 'Sales Report — Q3 2026';
  paint('A1:E1', xls.Color.get_DarkBlue());
  at('A1:E1').Style.Font.Color = xls.Color.get_White();
  at('A1:E1').Style.Font.IsBold = true;
  at('A1:E1').Style.Font.Size = 15;
  at('A1:E1').Style.VerticalAlignment = xls.VerticalAlignType.Center;

  at('A2:E2').Merge();
  cell(2, 1).Text = 'Region: West · Period: 1 Jul – 30 Sep 2026 · Amounts in USD';
  paint('A2:E2', xls.Color.get_DarkBlue());
  at('A2:E2').Style.Font.Color = xls.Color.get_LightSteelBlue();
  at('A2:E2').Style.Font.Size = 9.5;
  at('A2:E2').Style.VerticalAlignment = xls.VerticalAlignType.Center;

  // ── Header row ───────────────────────────────────────────────────────────
  ['Product', 'Units', 'Unit Price', 'Revenue', 'Share'].forEach((label, i) => {
    cell(4, i + 1).Text = label;
  });
  paint('A4:E4', xls.Color.get_LightSteelBlue());
  at('A4:E4').Style.Font.Color = xls.Color.get_DarkBlue();
  at('A4:E4').Style.Font.IsBold = true;
  at('A4:E4').Style.Font.Size = 10.5;
  at('A4:E4').Style.HorizontalAlignment = xls.HorizontalAlignType.Center;
  at('A4:E4').Style.VerticalAlignment = xls.VerticalAlignType.Center;

  // ── Data rows ── numbers go in as NumberValue, never as text
  products.forEach(([name, units, price], i) => {
    const r = FIRST + i;
    cell(r, 1).Text = name;
    cell(r, 2).NumberValue = units;
    cell(r, 3).NumberValue = price;
    cell(r, 4).Formula = `=B${r}*C${r}`;
    cell(r, 5).Formula = `=D${r}/$D${TOTAL}`; // share of the grand total
    sheet.Rows.get(r - 1).RowHeight = 20;
    if (i % 2) paint(`A${r}:E${r}`, xls.Color.get_WhiteSmoke()); // zebra banding
  });

  // ── Total row ────────────────────────────────────────────────────────────
  cell(TOTAL, 1).Text = 'Total';
  [2, 4, 5].forEach((col) => {
    const letter = String.fromCharCode(64 + col);
    cell(TOTAL, col).Formula = `=SUM(${letter}${FIRST}:${letter}${TOTAL - 1})`;
  });
  paint(`A${TOTAL}:E${TOTAL}`, xls.Color.get_LightSkyBlue());
  at(`A${TOTAL}:E${TOTAL}`).Style.Font.IsBold = true;
  sheet.Rows.get(TOTAL - 1).RowHeight = 22;

  // ── Number formats and borders ───────────────────────────────────────────
  at(`B${FIRST}:B${TOTAL}`).NumberFormat = '#,##0';
  at(`C${FIRST}:D${TOTAL}`).NumberFormat = '$#,##0.00';
  at(`E${FIRST}:E${TOTAL}`).NumberFormat = '0.0%';

  const table = at(`A4:E${TOTAL}`);
  table.Borders.LineStyle = xls.LineStyleType.Thin;
  table.Borders.Color = xls.Color.get_LightSteelBlue();
  at(`A${TOTAL}:E${TOTAL}`).Borders.get_Item(xls.BordersLineType.EdgeTop).LineStyle =
    xls.LineStyleType.Medium;

  // ── Chart ── build the series by hand (DataRange would mix units)
  const chart = sheet.Charts.Add();
  chart.ChartType = xls.ExcelChartType.ColumnClustered;
  chart.LeftColumn = 6;
  chart.TopRow = 3;
  chart.RightColumn = 13;
  chart.BottomRow = 21;
  const serie = chart.Series.Add();
  serie.CategoryLabels = at(`A${FIRST}:A${TOTAL - 1}`);
  serie.Values = at(`D${FIRST}:D${TOTAL - 1}`);
  serie.Name = 'Revenue';
  chart.ChartTitleArea.Text = 'Revenue by product';
  chart.HasLegend = false;
  chart.PrimaryValueAxis.NumberFormat = '$#,##0';

  // ── Sheet chrome ──
  sheet.FreezePanes(FIRST, 1);
  sheet.GridLinesVisible = false;
  sheet.TabColor = xls.Color.get_DarkBlue();

  // ── Second worksheet: cross-sheet roll-up ──
  const summary = wb.Worksheets.Add('Summary');
  summary.Columns.get(0).ColumnWidth = 26;
  summary.Columns.get(1).ColumnWidth = 18;
  summary.Rows.get(0).RowHeight = 30;
  summary.Rows.get(1).RowHeight = 18;
  summary.Rows.get(3).RowHeight = 22;

  const band = (a, text, size) => {
    summary.Range.get(a).Merge();
    summary.Range.get(a.split(':')[0]).Text = text;
    summary.Range.get(a).Style.Color = xls.Color.get_DarkBlue();
    summary.Range.get(a).Style.Font.Color = xls.Color.get_White();
    summary.Range.get(a).Style.Font.IsBold = true;
    summary.Range.get(a).Style.Font.Size = size;
    summary.Range.get(a).Style.VerticalAlignment = xls.VerticalAlignType.Center;
  };
  band('A1:B1', 'Executive Summary', 14);
  band('A2:B2', 'Sales Report · Q3 2026', 9.5);

  ['Metric', 'Value'].forEach((label, i) => {
    summary.Range.get({ row: 4, column: i + 1 }).Text = label;
  });
  summary.Range.get('A4:B4').Style.Color = xls.Color.get_LightSteelBlue();
  summary.Range.get('A4:B4').Style.Font.Color = xls.Color.get_DarkBlue();
  summary.Range.get('A4:B4').Style.Font.IsBold = true;

  [
    ['Total revenue', "='Sales Report'!D" + TOTAL, '$#,##0.00'],
    ['Units shipped', "='Sales Report'!B" + TOTAL, '#,##0'],
    ['Average unit price', `='Sales Report'!D${TOTAL}/'Sales Report'!B${TOTAL}`, '$#,##0.00'],
  ].forEach(([label, formula, format], i) => {
    summary.Range.get({ row: 5 + i, column: 1 }).Text = label;
    const value = summary.Range.get({ row: 5 + i, column: 2 });
    value.Formula = formula;
    value.NumberFormat = format;
    value.Style.HorizontalAlignment = xls.HorizontalAlignType.Right;
    if (i % 2) summary.Range.get(`A${5 + i}:B${5 + i}`).Style.Color = xls.Color.get_WhiteSmoke();
  });

  // Date — use Date.UTC to avoid timezone shift
  summary.Range.get('A8').Text = 'Report date';
  const reportDate = summary.Range.get('B8');
  reportDate.DateTimeValue = new Date(Date.UTC(2026, 8, 28));
  reportDate.NumberFormat = 'yyyy-mm-dd';
  reportDate.Style.HorizontalAlignment = xls.HorizontalAlignType.Right;

  const kpis = summary.Range.get('A4:B8');
  kpis.Borders.LineStyle = xls.LineStyleType.Thin;
  kpis.Borders.Color = xls.Color.get_LightSteelBlue();
  summary.GridLinesVisible = false;
  summary.TabColor = xls.Color.get_LightSteelBlue();

  // ── Save, then release ──
  wb.CalculateAllValue();
  const fileName = 'SalesReport.xlsx';
  wb.SaveToFile({ fileName: fileName, version: xls.ExcelVersion.Version2016 });

  const fileData = window.dotnetRuntime.Module.FS.readFile(fileName);
  const blob = new Blob([fileData], {
    type: 'application/vnd.openxmlformats-officedocument.spreadsheetml.sheet',
  });
  const url = URL.createObjectURL(blob);
  Object.assign(document.createElement('a'), { href: url, download: fileName }).click();
  URL.revokeObjectURL(url);

  wb.Dispose(); // free the WASM heap — one workbook per generation cycle
}
The layout follows the data. Replace the products array with a response from your own API and everything else — totals, share percentages, the chart range, the summary roll-up — keeps working, because they are all expressed as formulas or derived ranges rather than hard-coded values.
For more chart types and configuration options, see Create Excel Charts with JavaScript in React.
Create an Excel File from CSV Data
You can load tabular data from a CSV file into a worksheet and save the result as XLSX. The resulting workbook can then be formatted or extended with formulas and additional worksheets:
// The library reads from its own virtual file system, so the CSV has to be
// there before you can load it — written from a string here, from the bytes of
// a File object in a real application.
const csv = "Product,Quantity,Price\nLaptop,10,999.99\nMouse,50,24.99\nKeyboard,30,59.99";
window.dotnetRuntime.Module.FS.writeFile("data.csv", new TextEncoder().encode(csv));

workbook.LoadFromFile("data.csv", ",");
workbook.SaveToFile({
    fileName: "ConvertedFromCSV.xlsx",
    version: xls.ExcelVersion.Version2016
});
The imported sheet is named after the file (data), so Worksheets.get(0) picks it up.
The separator is a required second argument. LoadFromFile("data.csv") on its own is rejected with This is not a structured storage file, because the single-argument overload expects a structured format such as .xlsx or .xls and does not sniff CSV.
There is a second catch: the CSV importer writes every field as text. A quantity column arrives as "10" rather than 10, which means it cannot be summed or sorted numerically — the exact problem described earlier in this tutorial. Convert the columns you need before saving:
const csvSheet = workbook.Worksheets.get(0);

// The importer leaves every field as text — coerce each numeric column.
// Columns 2 and 3 hold Quantity and Price; both arrive as "10" and "999.99".
for (let row = 2; row <= 4; row++) {
    [2, 3].forEach((column) => {
        const cell = csvSheet.Range.get({ row: row, column: column });
        if (cell.Text !== "") {
            cell.NumberValue = Number(cell.Text);
        }
    });
}
For a full guide on converting between CSV and Excel formats, see our CSV to Excel conversion tutorial.
Create an XLS File Instead of XLSX
If your application needs to generate the legacy .xls format instead of .xlsx, change the version parameter:
workbook.SaveToFile({
    fileName: "Report.xls",
    version: xls.ExcelVersion.Version97to2003
});
The enum member is Version97to2003 — there is no Version97. Keep charts in XLSX; the tested XLS writer fails when chart font metrics are required.
XLSX (Excel 2007+) is the recommended format for new applications. XLS (Excel 97–2003) is only necessary when backward compatibility is required.
Common Problems
window.wasmModule is undefined. Older samples read the spreadsheet API from window.wasmModule.spirexls. Current releases install it directly on window.spirexls and leave wasmModule undefined, so the very first access throws. Check window.spirexls instead.
WASM module not initialized. If window.spirexls is undefined, the runtime hasn't finished loading. Show a loading indicator and wait for initialization to complete before attempting any Excel operations.
Auto-fit throws a font error. AutoFitColumn and AutoFitRow need a system font to measure text, and the WebAssembly sandbox has none. They fail with Cannot found font(Arial) installed on the system. Compute or hard-code your column widths with sheet.Columns.get(i).ColumnWidth.
Numbers stored as text. Using cell.Text = "100" instead of cell.NumberValue = 100 breaks sorting and calculations. This is the most common issue developers encounter when writing Excel files in JavaScript, and CSV import triggers it automatically—always use NumberValue for numeric data.
An "Evaluation Warning" sheet appears. When using the evaluation build without a valid license, Spire.XLS adds an evaluation sheet to the saved workbook. This sheet is recreated on save, so removing it programmatically is not a reliable workaround. Apply a license key to prevent it.
Memory leaks in long-running apps. Call workbook.Dispose() after every generation cycle. In single-page applications, undisposed workbooks accumulate memory and degrade performance over time.
FAQ
Can JavaScript create Excel files without Microsoft Excel?
Yes. Spire.XLS for JavaScript runs entirely in the browser via WebAssembly. No Microsoft Excel or server-side Office installation is required to generate XLSX files.
Can JavaScript create XLSX files directly in the browser?
Yes. All spreadsheet operations happen client-side. The file is saved to a virtual file system, then downloaded as a Blob—no backend server needed.
What's the difference between XLS and XLSX?
XLSX (Excel 2007 and later) is the modern XML-based format, recommended for new applications. XLS (Excel 97–2003) is the legacy binary format, useful for older system compatibility.
Conclusion
Creating Excel files in JavaScript doesn't require a backend server or Microsoft Excel. With Spire.XLS for JavaScript, you can build workbooks from scratch, write typed data, add formulas, apply formatting, and organize data across multiple sheets—all in the browser.
Start with the basic example above, then layer in formulas and formatting as your needs grow. For React-specific integration and HTML table export, see our dedicated export tutorial.