
Spire.XLS for JavaScript (109)
Children categories
Compress, Resize or Move Excel Pictures in React with JavaScript
2026-09-18 01:57:13 Written by AdministratorOnce a report has accumulated a few pictures, the awkward part is rarely the text: a few hundred kilobytes of product photos pushed straight into a worksheet will swell the file until sending and archiving become painful, and pictures copied in from elsewhere rarely share one size—a large one covers an entire block of data while a small one sits unreadable in a corner. Fixing these by hand in Excel is bearable, but there is no entry point once the work has to be done in code.Spire.XLS for JavaScript performs this work directly in the browser through WebAssembly, managing input and output files with a virtual file system (VFS) and requiring no backend service.
This article covers three key features:
For installation and project setup, see Integrating Spire.XLS for JavaScript in a React Project. The examples below assume Spire.XLS is already installed and the WebAssembly module has been initialized.
Compress Pictures in Excel
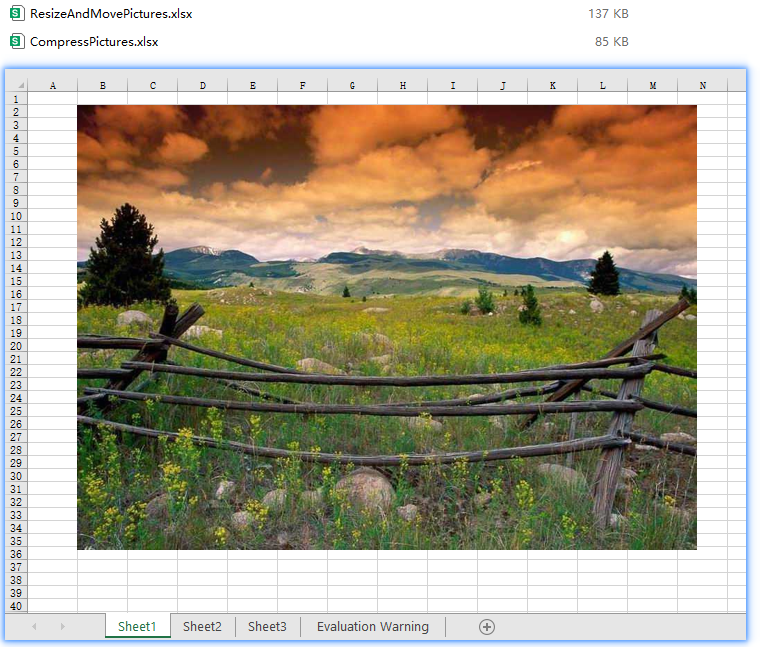
Compress() re-encodes a picture at the quality ratio you pass in: a value of 50 brings the picture quality down to 50%. The lower the quality, the less data the picture takes up and the lighter the workbook becomes. Compression only touches the picture's own data—the picture keeps its position and its display size on the worksheet—so it is the right move when you want a smaller file without disturbing the layout. The steps are:
- Load the workbook.
- Walk every picture of every worksheet.
- Call
Compressto bring each picture down to 50% quality. - Save the workbook.
The following is a complete code example that compresses the pictures in an Excel file in React:
function App() {
  const compressPictures = async () => {
    // Get the Spire.XLS WASM module
    const xlsModule = window.wasmModule?.spirexls;

    // Check if the module is ready
    if (!xlsModule) {
      alert('Spire.Xls is not ready yet');
      return;
    }

    // Load the font into VFS
    await window.spire.FetchFileToVFS('ARIAL.TTF', '/Library/Fonts/', `${process.env.PUBLIC_URL}/font/`);

    // Load the Excel file into VFS
    const inputFileName = 'ResizeAndMovePictures.xlsx';
    await window.spire.FetchFileToVFS(inputFileName, '', `${process.env.PUBLIC_URL}/static/data/`);

    // Load the workbook
    const workbook = new xlsModule.Workbook();
    workbook.LoadFromFile(inputFileName);

    // Walk every picture of every worksheet
    for (const sheet of workbook.Worksheets) {
      for (const picture of sheet.Pictures) {
        // Compress the picture quality down to 50%
        picture.Compress(50);
      }
    }

    // Save the workbook
    const outputFileName = "CompressPictures.xlsx";
    workbook.SaveToFile(outputFileName);

    // Release resources
    workbook.Dispose();

    // Read the result file from VFS and trigger the download
    const fileArray = window.dotnetRuntime.Module.FS.readFile(outputFileName);
    const blob = new Blob([fileArray], { type: "application/vnd.openxmlformats-officedocument.spreadsheetml.sheet" });
    const url = URL.createObjectURL(blob);
    const a = document.createElement('a');
    a.href = url;
    a.download = outputFileName;
    a.click();
    URL.revokeObjectURL(url);
  };

  return (
    <div style={{ textAlign: 'center', height: '300px' }}>
      <h1>Compress, Resize or Move Pictures in Excel</h1>
      <button onClick={compressPictures}>Start</button>
    </div>
  );
}

export default App;
Compress handles every picture it reaches in one pass; the compressed pictures stay where they were and only lose some image quality.
After running, the effect of compressing pictures in Excel:
Resize a Picture in Excel
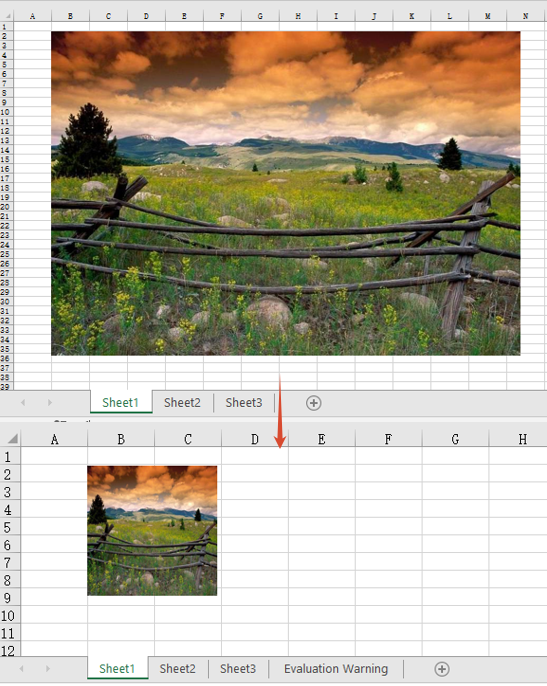
The size a picture is displayed at on a worksheet is controlled by two properties, Width and Height, measured in pixels. Assigning new values to them brings the picture to the size you want—a shrunken picture no longer covers the data next to it, and an enlarged one can fill a reserved picture slot. The steps are:
- Load the workbook and get the first worksheet.
- Get the first picture of the worksheet with
sheet.Pictures.get(0). - Set
WidthandHeightto resize the picture. - Save the workbook.
The following is a complete code example that resizes a picture in Excel in React:
function App() {
  const resizePicture = async () => {
    // Get the Spire.XLS WASM module
    const xlsModule = window.wasmModule?.spirexls;

    // Check if the module is ready
    if (!xlsModule) {
      alert('Spire.Xls is not ready yet');
      return;
    }

    // Load the font into VFS
    await window.spire.FetchFileToVFS('ARIAL.TTF', '/Library/Fonts/', `${process.env.PUBLIC_URL}/font/`);

    // Load the Excel file into VFS
    const inputFileName = 'ResizeAndMovePictures.xlsx';
    await window.spire.FetchFileToVFS(inputFileName, '', `${process.env.PUBLIC_URL}/static/data/`);

    // Load the workbook
    const workbook = new xlsModule.Workbook();
    workbook.LoadFromFile(inputFileName);

    // Get the first worksheet
    const sheet = workbook.Worksheets.get(0);

    // Get the first picture of the worksheet
    const picture = sheet.Pictures.get(0);

    // Resize the picture to 140 pixels wide and 140 pixels high
    picture.Width = 140;
    picture.Height = 140;

    // Save the workbook
    const outputFileName = "ResizePicture.xlsx";
    workbook.SaveToFile(outputFileName);

    // Release resources
    workbook.Dispose();

    // Read the result file from VFS and trigger the download
    const fileArray = window.dotnetRuntime.Module.FS.readFile(outputFileName);
    const blob = new Blob([fileArray], { type: "application/vnd.openxmlformats-officedocument.spreadsheetml.sheet" });
    const url = URL.createObjectURL(blob);
    const a = document.createElement('a');
    a.href = url;
    a.download = outputFileName;
    a.click();
    URL.revokeObjectURL(url);
  };

  return (
    <div style={{ textAlign: 'center', height: '300px' }}>
      <h1>Compress, Resize or Move Pictures in Excel</h1>
      <button onClick={resizePicture}>Start</button>
    </div>
  );
}

export default App;
Width and Height map to the picture's width and height and take effect independently, so the picture shows at its new size as soon as they are assigned. Note that this sets the size of the picture frame rather than scaling proportionally—when the new width and height do not match the original ratio, the picture is stretched. See the FAQ below for how to handle that.
After running, the effect of resizing a picture in Excel:
Move a Picture in Excel
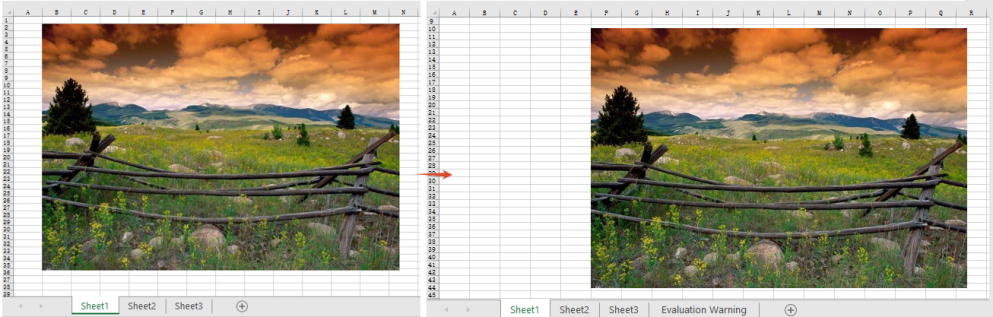
A picture in Excel is a floating object anchored to a cell, so setting its size alone does not change where it shows up. The Left and Top properties are measured in pixels and give the distance from the top-left corner of the worksheet to the top-left corner of the picture; assigning them moves the picture to the new coordinates, which is how you push a picture out of a block of data or line several pictures up in the same column. The steps are:
- Load the workbook and get the first worksheet.
- Get the first picture of the worksheet with
sheet.Pictures.get(0). - Set
LeftandTopto move the picture. - Save the workbook.
The following is a complete code example that moves a picture in Excel in React:
function App() {
  const movePicture = async () => {
    // Get the Spire.XLS WASM module
    const xlsModule = window.wasmModule?.spirexls;

    // Check if the module is ready
    if (!xlsModule) {
      alert('Spire.Xls is not ready yet');
      return;
    }

    // Load the font into VFS
    await window.spire.FetchFileToVFS('ARIAL.TTF', '/Library/Fonts/', `${process.env.PUBLIC_URL}/font/`);

    // Load the Excel file into VFS
    const inputFileName = 'ResizeAndMovePictures.xlsx';
    await window.spire.FetchFileToVFS(inputFileName, '', `${process.env.PUBLIC_URL}/static/data/`);

    // Load the workbook
    const workbook = new xlsModule.Workbook();
    workbook.LoadFromFile(inputFileName);

    // Get the first worksheet
    const sheet = workbook.Worksheets.get(0);

    // Get the first picture of the worksheet
    const picture = sheet.Pictures.get(0);

    // Move the top-left corner of the picture 360 pixels from the left and 180 pixels from the top
    picture.Left = 360;
    picture.Top = 180;

    // Save the workbook
    const outputFileName = "MovePicture.xlsx";
    workbook.SaveToFile(outputFileName);

    // Release resources
    workbook.Dispose();

    // Read the result file from VFS and trigger the download
    const fileArray = window.dotnetRuntime.Module.FS.readFile(outputFileName);
    const blob = new Blob([fileArray], { type: "application/vnd.openxmlformats-officedocument.spreadsheetml.sheet" });
    const url = URL.createObjectURL(blob);
    const a = document.createElement('a');
    a.href = url;
    a.download = outputFileName;
    a.click();
    URL.revokeObjectURL(url);
  };

  return (
    <div style={{ textAlign: 'center', height: '300px' }}>
      <h1>Compress, Resize or Move Pictures in Excel</h1>
      <button onClick={movePicture}>Start</button>
    </div>
  );
}

export default App;
Left and Top describe the absolute coordinates of the picture's top-left corner on the worksheet, regardless of which row or column the picture was originally anchored to.
After running, the effect of moving a picture in Excel:
FAQ
Why does a picture look stretched after resizing?
Cause: Width and Height are two independent properties, and assigning them separately does not preserve the picture's original aspect ratio. Give a rectangular picture the same value for width and height and it is forced into a square.
Solution: read the picture's current width and height first, work out the ratio, and derive the other dimension from it. The size properties only accept integers, so round the result:
// Read the picture's current width and height to work out the ratio
const picture = sheet.Pictures.get(0);
const ratio = picture.Height / picture.Width;

// Fix the width and derive the height from the ratio so the picture is not distorted
picture.Width = 140;
picture.Height = Math.round(140 * ratio);
Does IsLockAspectRatio keep a picture from being distorted?
Cause: no. The property is true by default, and what it sets is the picture's lock flag, which constrains resizing by hand in Excel. It does not scale the other side for you when Width / Height are assigned from code—setting Width to 140 left Height at its original 300 whether IsLockAspectRatio was true or false.
Solution: proportional resizing still has to be computed by hand. The property reads and writes fine and survives a save, so set it when the file's lock state needs to match:
// The lock flag: true by default; setting it to false is written to the file and reads back as false
picture.IsLockAspectRatio = false;

// But it takes no part in the width / height conversion: change Width alone and Height stays put
picture.Width = 140;

// To scale proportionally, work out the ratio first
const ratio = picture.Height / picture.Width;
picture.Width = 140;
picture.Height = Math.round(140 * ratio);
Get a Free License
Spire.XLS for JavaScript offers a 30-day full-featured free trial license with no functional limitations. Apply here to evaluate before purchasing.
Autofit Row Heights and Column Widths in React with JavaScript
2026-09-18 01:55:27 Written by liu taliaOnce the data is in, a table usually needs one last pass before it is usable: a product name squeezed into a sliver of a column, a paragraph of remarks running along a single line until the next non-empty cell cuts it off. Dragging column borders and row dividers by hand is slow, and once there are enough columns it is easy to miss a few. Spire.XLS for JavaScript performs this work directly in the browser through WebAssembly, managing input and output files with a virtual file system (VFS) and requiring no backend service.
This article covers two key features:
- Autofit the Height of a Single Row and the Width of a Single Column
- Autofit the Heights of Multiple Rows and the Widths of Multiple Columns
For installation and project setup, see Integrating Spire.XLS for JavaScript in a React Project. The examples below assume Spire.XLS is already installed and the WebAssembly module has been initialized.
Autofit the Height of a Single Row and the Width of a Single Column
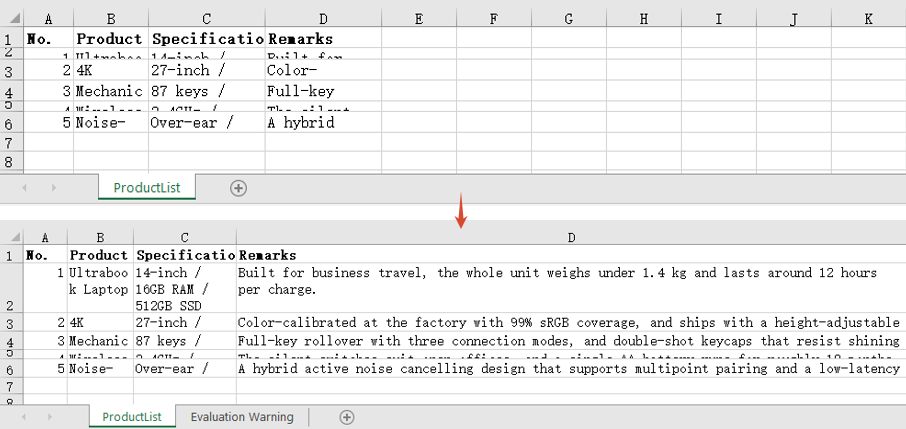
AutoFitRow works out the height of the given row from its content, and AutoFitColumn works out the width of the given column the same way. Each one affects only the row or the column it is pointed at and leaves the rest of the table untouched, which is what you want when a single overflow is the only thing in the way.
Note that row height autofit only means anything for content that needs to wrap: with wrapping turned off the text always sits on one line and the height simply follows the font size, so there is no taller value to calculate. The steps are:
- Load the workbook and get the first worksheet.
- Autofit the height of that row with
AutoFitRow. - Autofit the width of that column with
AutoFitColumn. - Save the workbook.
Here is a complete code example that autofits the height of a single row and the width of a single column in React:
function App() {
  const autoFitSingleRowColumn = async () => {
    // Get the Spire.XLS WASM module
    const xlsModule = window.wasmModule?.spirexls;

    // Check whether the module is ready
    if (!xlsModule) {
      alert('Spire.Xls is not ready yet');
      return;
    }

    // Load the font into the VFS
    await window.spire.FetchFileToVFS('ARIAL.TTF', '/Library/Fonts/', `${process.env.PUBLIC_URL}/font/`);

    // Load the Excel file into the VFS
    const inputFileName = 'AutoFitRowsAndColumns.xlsx';
    await window.spire.FetchFileToVFS(inputFileName, '', `${process.env.PUBLIC_URL}/static/data/`);

    // Load the workbook
    const workbook = new xlsModule.Workbook();
    workbook.LoadFromFile(inputFileName);

    // Get the first worksheet
    const sheet = workbook.Worksheets.get(0);

    // Autofit the height of row 2
    sheet.AutoFitRow(2);

    // Autofit the width of column 4
    sheet.AutoFitColumn(4);

    // Save the workbook
    const outputFileName = "AutoFitSingleRowColumn.xlsx";
    workbook.SaveToFile(outputFileName);

    // Dispose of the workbook object to free resources
    workbook.Dispose();

    // Read the result file from the VFS and trigger the download
    const fileArray = window.dotnetRuntime.Module.FS.readFile(outputFileName);
    const blob = new Blob([fileArray], { type: "application/vnd.openxmlformats-officedocument.spreadsheetml.sheet" });
    const url = URL.createObjectURL(blob);
    const a = document.createElement('a');
    a.href = url;
    a.download = outputFileName;
    a.click();
    URL.revokeObjectURL(url);
  };

  return (
    <div style={{ textAlign: 'center', height: '300px' }}>
      <h1>Autofit Row Height and Column Width</h1>
      <button onClick={autoFitSingleRowColumn}>Start</button>
    </div>
  );
}

export default App;
After running, the effect of autofitting a single row height and a single column width:
Autofit the Heights of Multiple Rows and the Widths of Multiple Columns
When the whole table needs tidying, calling the methods row by row is not realistic. Calling AutoFitRows or AutoFitColumns on a range recalculates every row and every column the range covers from its own content, so a single call lines up the whole block — the kind of pass you want before exporting a report. The steps are:
- Load the workbook and get the first worksheet.
- Autofit the heights of the rows with
AutoFitRows. - Autofit the widths of the columns with
AutoFitColumns. - Save the workbook.
Here is a complete code example that autofits the heights of multiple rows and the widths of multiple columns in React:
function App() {
  const autoFitMultipleRowsColumns = async () => {
    // Get the Spire.XLS WASM module
    const xlsModule = window.wasmModule?.spirexls;

    // Check whether the module is ready
    if (!xlsModule) {
      alert('Spire.Xls is not ready yet');
      return;
    }

    // Load the font into the VFS
    await window.spire.FetchFileToVFS('ARIAL.TTF', '/Library/Fonts/', `${process.env.PUBLIC_URL}/font/`);

    // Load the Excel file into the VFS
    const inputFileName = 'AutoFitRowsAndColumns.xlsx';
    await window.spire.FetchFileToVFS(inputFileName, '', `${process.env.PUBLIC_URL}/static/data/`);

    // Load the workbook
    const workbook = new xlsModule.Workbook();
    workbook.LoadFromFile(inputFileName);

    // Get the first worksheet
    const sheet = workbook.Worksheets.get(0);

    // Get the used range of the worksheet
    const range = sheet.AllocatedRange;

    // Autofit the height of every row in the range
    range.AutoFitRows();

    // Autofit the width of every column in the range
    range.AutoFitColumns();

    // Save the workbook
    const outputFileName = "AutoFitMultipleRowsColumns.xlsx";
    workbook.SaveToFile(outputFileName);

    // Dispose of the workbook object to free resources
    workbook.Dispose();

    // Read the result file from the VFS and trigger the download
    const fileArray = window.dotnetRuntime.Module.FS.readFile(outputFileName);
    const blob = new Blob([fileArray], { type: "application/vnd.openxmlformats-officedocument.spreadsheetml.sheet" });
    const url = URL.createObjectURL(blob);
    const a = document.createElement('a');
    a.href = url;
    a.download = outputFileName;
    a.click();
    URL.revokeObjectURL(url);
  };

  return (
    <div style={{ textAlign: 'center', height: '300px' }}>
      <h1>Autofit Row Height and Column Width</h1>
      <button onClick={autoFitMultipleRowsColumns}>Start</button>
    </div>
  );
}

export default App;
After running, the effect of autofitting multiple row heights and multiple column widths:
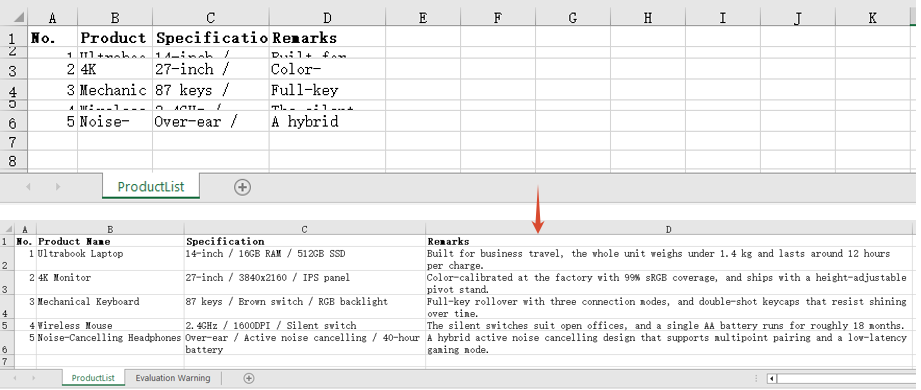
FAQ
I called AutoFitRow() and the row height did not change at all?
Cause: Row height autofit only applies to content that needs to wrap. With wrapping turned off the text stays on a single line and the height follows the font size, so autofit arrives at the same value as the existing height and appears to have done nothing.
Solution: Set WrapText to true first, then autofit the row height:
// With wrapping off, autofitting the row height changes nothing
sheet.Range.get("D2").Style.WrapText = false;
sheet.AutoFitRow(2);

// With wrapping on, the height is recalculated from the wrapped line count
sheet.Range.get("D2").Style.WrapText = true;
sheet.AutoFitRow(2);
AutoFitColumns() has no effect on merged cells?
Cause: Column width autofit measures the content of individual cells. In a merged range only the top-left cell actually holds text and every other position in the range is empty, so the width it works out is only enough for that top-left content.
Solution: Set the width of a merged range by hand with ColumnWidth:
// A7:D7 is a merged range, so autofit cannot work out its combined width
sheet.Range.get("A7:D7").Merge();
sheet.Range.get("A7:D7").AutoFitColumns();

// Set the column width by hand so the merged text fits
sheet.Range.get("A7").ColumnWidth = 40;
Get a Free License
Spire.XLS for JavaScript offers a 30-day full-featured free trial license with no functional limitations. Apply here to evaluate before purchasing.
Modify, Hide and Delete Named Ranges in React with JavaScript
2026-09-17 05:55:53 Written by liu taliaA named range is not something you set up once and forget. As the data table is restructured, the original name may no longer fit, and the referred range can go stale when rows are added or removed. Some named ranges exist only as an intermediate helper for a formula and have no business showing up in the Name Manager. And named ranges that are no longer used, if kept forever, turn the name list into something long and hard to search. Modifying, hiding and deleting are therefore just as much a part of working with named ranges as creating them. Spire.XLS for JavaScript provides a complete named range management API and can perform all of the above in the browser through WebAssembly, with no backend service required.
This article covers three key features:
For installation and project setup, see Integrating Spire.XLS for JavaScript in a React Project. The examples below assume Spire.XLS is already installed and the WebAssembly module has been initialized.
Modify a Named Range
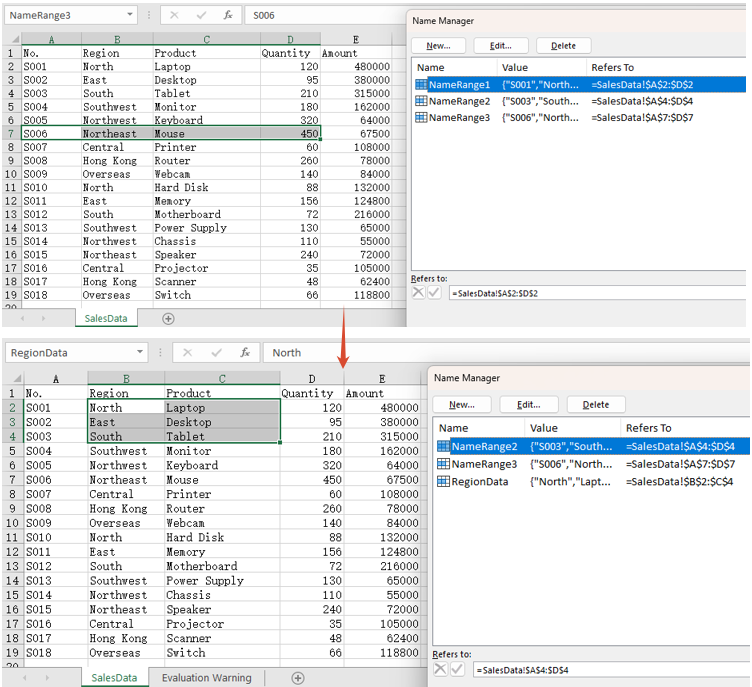
Modifying covers two independent aspects: the name itself and the referred range. The name is reassigned through the Name property and the referred range through the RefersToRange property. The two can be changed separately, or together as in the example below. The steps are:
- Load the workbook and get the first worksheet.
- Take the named range to modify with
workbook.NameRanges.get(0). - Set
Nameto the new name. - Point
RefersToRangeat the new cell range. - Save the workbook.
The following is a complete code example that shows how to modify a named range in React:
function App() {
  const modifyNamedRange = async () => {
    // Get the Spire.XLS WASM module
    const xlsModule = window.wasmModule?.spirexls;

    // Check if the module is ready
    if (!xlsModule) {
      alert('Spire.Xls is not ready yet');
      return;
    }

    // Load the font into VFS
    await window.spire.FetchFileToVFS('ARIAL.TTF', '/Library/Fonts/', `${process.env.PUBLIC_URL}/font/`);

    // Load the Excel file into VFS
    const inputFileName = 'AllNamedRanges.xlsx';
    await window.spire.FetchFileToVFS(inputFileName, '', `${process.env.PUBLIC_URL}/static/data/`);

    // Load the workbook
    const workbook = new xlsModule.Workbook();
    workbook.LoadFromFile(inputFileName);

    // Get the first worksheet
    let sheet = workbook.Worksheets.get(0);

    // Change the name of the named range
    workbook.NameRanges.get(0).Name = "RegionData";

    // Change the cell range the named range refers to
    workbook.NameRanges.get(0).RefersToRange = sheet.Range.get("B2:C4");

    // Save the workbook
    const outputFileName = 'ModifyNamedRange.xlsx';
    workbook.SaveToFile(outputFileName);

    // Release resources
    workbook.Dispose();

    // Read the result file from VFS and trigger the download
    const fileArray = window.dotnetRuntime.Module.FS.readFile(outputFileName);
    const blob = new Blob([fileArray], { type: "application/vnd.openxmlformats-officedocument.spreadsheetml.sheet" });
    const url = URL.createObjectURL(blob);
    const a = document.createElement('a');
    a.href = url;
    a.download = outputFileName;
    a.click();
    URL.revokeObjectURL(url);
  };

  return (
    <div style={{ textAlign: 'center', height: '300px' }}>
      <h1>Modify Named Range</h1>
      <button onClick={modifyNamedRange}>Start</button>
    </div>
  );
}

export default App;
After running, the effect of modifying a named range:
Hide a Named Range
Set the Visible property to false and the named range is hidden. A hidden named range is still stored in the workbook and formulas that refer to it are unaffected — it simply no longer appears in Excel's Name Manager and name box, which keeps the name list tidy. After hiding it, the example below also writes the formula =SUM(NameRange1) into cell F2: the formula still calculates normally, which is exactly what shows that the named range is only hidden, not deleted. The steps are:
- Load the workbook and get the first worksheet.
- Take the named range to hide.
- Set
Visibletofalse. - Write a formula that refers to the named range into a cell, to confirm it still works.
- Save the workbook.
The following is a complete code example that shows how to hide a named range in React:
function App() {
  const hideNamedRange = async () => {
    // Get the Spire.XLS WASM module
    const xlsModule = window.wasmModule?.spirexls;

    // Check if the module is ready
    if (!xlsModule) {
      alert('Spire.Xls is not ready yet');
      return;
    }

    // Load the font into VFS
    await window.spire.FetchFileToVFS('ARIAL.TTF', '/Library/Fonts/', `${process.env.PUBLIC_URL}/font/`);

    // Load the Excel file into VFS
    const inputFileName = 'AllNamedRanges.xlsx';
    await window.spire.FetchFileToVFS(inputFileName, '', `${process.env.PUBLIC_URL}/static/data/`);

    // Load the workbook
    const workbook = new xlsModule.Workbook();
    workbook.LoadFromFile(inputFileName);

    // Get the first worksheet
    let sheet = workbook.Worksheets.get(0);

    // Hide the first named range
    workbook.NameRanges.get(0).Visible = false;

    // Write a formula that refers to the hidden named range, proving it still exists and works
    sheet.Range.get("F1").Text = "Sum After Hiding";
    sheet.Range.get("F2").Formula = "=SUM(NameRange1)";

    // Calculate the formulas so the saved file shows the result as soon as it is opened
    workbook.CalculateAllValue();

    // Save the workbook
    const outputFileName = 'HideNamedRange.xlsx';
    workbook.SaveToFile(outputFileName);

    // Release resources
    workbook.Dispose();

    // Read the result file from VFS and trigger the download
    const fileArray = window.dotnetRuntime.Module.FS.readFile(outputFileName);
    const blob = new Blob([fileArray], { type: "application/vnd.openxmlformats-officedocument.spreadsheetml.sheet" });
    const url = URL.createObjectURL(blob);
    const a = document.createElement('a');
    a.href = url;
    a.download = outputFileName;
    a.click();
    URL.revokeObjectURL(url);
  };

  return (
    <div style={{ textAlign: 'center', height: '300px' }}>
      <h1>Hide Named Range</h1>
      <button onClick={hideNamedRange}>Start</button>
    </div>
  );
}

export default App;
After running, the effect of hiding a named range:
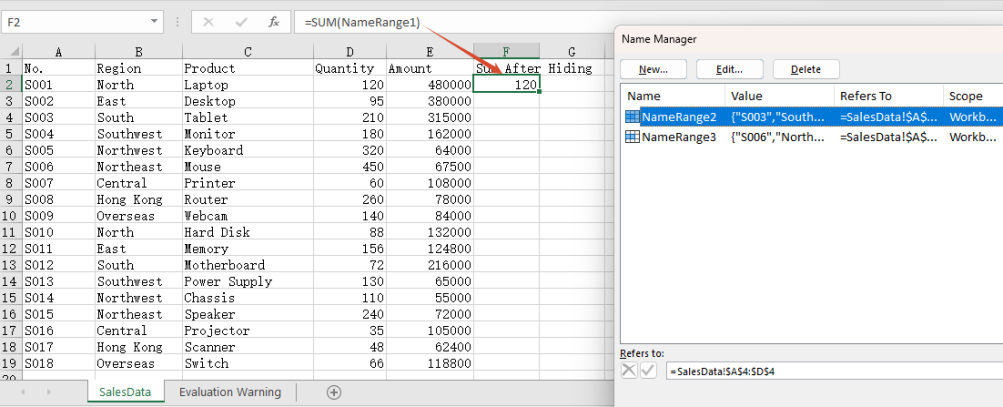
Note: The formula in cell F2 refers to the hidden NameRange1, and it still calculates 120. That shows the named range has only been hidden from view, not removed from the workbook.
Delete a Named Range
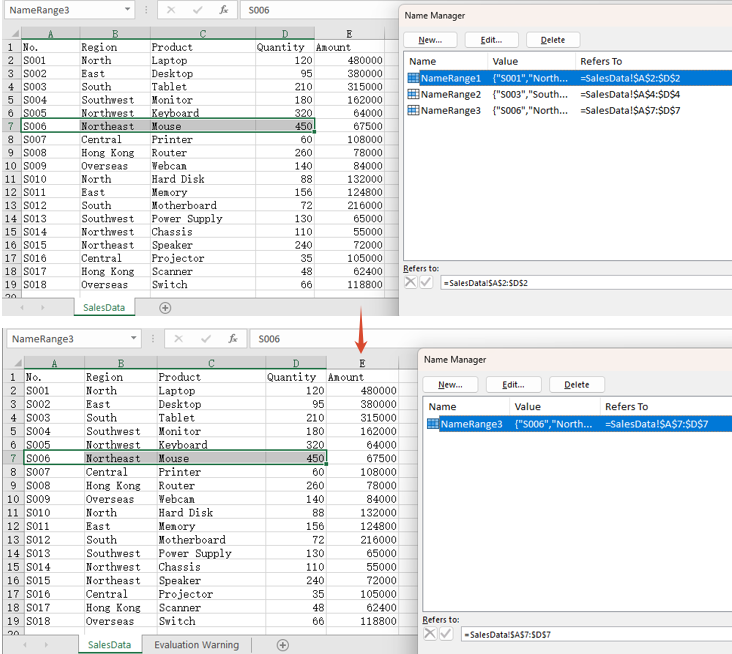
There are two ways to delete a named range: call Remove() when the name is known, or RemoveAt() when the position is known. Both remove the named range from the workbook entirely. The steps are:
- Load the workbook.
- Call
Remove()to delete a named range by name. - Call
RemoveAt()to delete a named range by index. - Save the workbook.
The following is a complete code example that shows how to delete a named range in React:
function App() {
  const deleteNamedRange = async () => {
    // Get the Spire.XLS WASM module
    const xlsModule = window.wasmModule?.spirexls;

    // Check if the module is ready
    if (!xlsModule) {
      alert('Spire.Xls is not ready yet');
      return;
    }

    // Load the font into VFS
    await window.spire.FetchFileToVFS('ARIAL.TTF', '/Library/Fonts/', `${process.env.PUBLIC_URL}/font/`);

    // Load the Excel file into VFS
    const inputFileName = 'AllNamedRanges.xlsx';
    await window.spire.FetchFileToVFS(inputFileName, '', `${process.env.PUBLIC_URL}/static/data/`);

    // Load the workbook
    const workbook = new xlsModule.Workbook();
    workbook.LoadFromFile(inputFileName);

    // Delete a named range by name
    workbook.NameRanges.Remove("NameRange2");

    // Delete a named range by index
    workbook.NameRanges.RemoveAt(0);

    // Save the workbook
    const outputFileName = 'DeleteNamedRange.xlsx';
    workbook.SaveToFile(outputFileName);

    // Release resources
    workbook.Dispose();

    // Read the result file from VFS and trigger the download
    const fileArray = window.dotnetRuntime.Module.FS.readFile(outputFileName);
    const blob = new Blob([fileArray], { type: "application/vnd.openxmlformats-officedocument.spreadsheetml.sheet" });
    const url = URL.createObjectURL(blob);
    const a = document.createElement('a');
    a.href = url;
    a.download = outputFileName;
    a.click();
    URL.revokeObjectURL(url);
  };

  return (
    <div style={{ textAlign: 'center', height: '300px' }}>
      <h1>Delete Named Range</h1>
      <button onClick={deleteNamedRange}>Start</button>
    </div>
  );
}

export default App;
After running, the effect of deleting a named range:
FAQ
Why is the result of a formula missing when the saved file is opened?
Cause: Setting only the Formula property of a cell does not make Spire calculate it. The saved file then contains the formula itself but no calculated result value, so the cell comes up blank when the file is opened.
Solution: Call workbook.CalculateAllValue() before saving, to evaluate the formulas first:
// Calculate all formulas so the result value is written into the saved file
workbook.CalculateAllValue();
Can I pass a named range object to the delete API?
Cause: Remove() takes a name string. Passing a NameRange object does not match the expected type and throws Assert failed: Value is not a String, and nothing is deleted.
Solution: Pass the name when it is known, or the index when the position is known:
// Delete by name
workbook.NameRanges.Remove("NameRange2");

// Delete by index
workbook.NameRanges.RemoveAt(0);
Get a Free License
Spire.XLS for JavaScript offers a 30-day full-featured free trial license with no functional limitations. Apply here to evaluate before purchasing.
Set the Alignment, Indent, Orientation and Wrapping of Excel Cell Text in React with JavaScript
2026-09-17 05:55:07 Written by liu taliaHow readable a table is often has nothing to do with the data itself and everything to do with how the text sits inside its cells. Titles need to be centred, amounts need to be pushed right, multi-line descriptions need to be indented, a long sentence in a narrow column needs to fold, and a header set at an angle fits more information into limited column width. All of these are cell text layout settings. Spire.XLS for JavaScript performs them directly in the browser through WebAssembly, managing input and output files with a virtual file system (VFS) and requiring no backend service.
This article covers four key features:
- Set the Alignment of Text
- Set the Indent of Text
- Set the Orientation of Text
- Set the Wrapping of Text
For installation and project setup, see Integrating Spire.XLS for JavaScript in a React Project. The examples below assume Spire.XLS is already installed and the WebAssembly module has been initialized.
Set the Alignment of Text
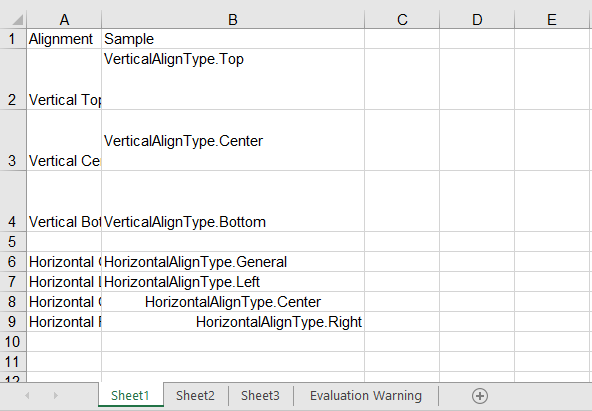
Alignment works along two axes. Vertical alignment decides where the text sits within the height of the cell and is set through the VerticalAlignment property, which accepts Top, Center, Bottom and others. Horizontal alignment decides where the text sits within the width of the cell and is set through the HorizontalAlignment property, which accepts General, Left, Center, Right and others. The two are independent and can be combined freely. The steps are as follows:
- Create a workbook and get the first worksheet.
- Write the sample text.
- Set the vertical alignment through
VerticalAlignment. - Set the horizontal alignment through
HorizontalAlignment. - Save the workbook.
Here is a complete code example that sets the alignment of cell text in React:
function App() {
  const setTextAlignment = async () => {
    // Get the Spire.XLS WASM module
    const xlsModule = window.wasmModule?.spirexls;

    // Check if the module is ready
    if (!xlsModule) {
      alert('Spire.Xls is not ready yet');
      return;
    }

    // Load the font into VFS
    await window.spire.FetchFileToVFS('ARIAL.TTF', '/Library/Fonts/', `${process.env.PUBLIC_URL}/font/`);

    // Create a new workbook
    const workbook = new xlsModule.Workbook();

    // Get the first worksheet
    const sheet = workbook.Worksheets.get(0);

    // Write the sample text for vertical alignment
    sheet.Range.get("A1").Text = "Alignment";
    sheet.Range.get("B1").Text = "Sample";
    sheet.Range.get("A2").Text = "Vertical Top";
    sheet.Range.get("B2").Text = "VerticalAlignType.Top";
    sheet.Range.get("A3").Text = "Vertical Center";
    sheet.Range.get("B3").Text = "VerticalAlignType.Center";
    sheet.Range.get("A4").Text = "Vertical Bottom";
    sheet.Range.get("B4").Text = "VerticalAlignType.Bottom";

    // Write the sample text for horizontal alignment
    sheet.Range.get("A6").Text = "Horizontal General";
    sheet.Range.get("B6").Text = "HorizontalAlignType.General";
    sheet.Range.get("A7").Text = "Horizontal Left";
    sheet.Range.get("B7").Text = "HorizontalAlignType.Left";
    sheet.Range.get("A8").Text = "Horizontal Center";
    sheet.Range.get("B8").Text = "HorizontalAlignType.Center";
    sheet.Range.get("A9").Text = "Horizontal Right";
    sheet.Range.get("B9").Text = "HorizontalAlignType.Right";

    // Set the vertical alignment
    sheet.Range.get("B2").Style.VerticalAlignment = xlsModule.VerticalAlignType.Top;
    sheet.Range.get("B3").Style.VerticalAlignment = xlsModule.VerticalAlignType.Center;
    sheet.Range.get("B4").Style.VerticalAlignment = xlsModule.VerticalAlignType.Bottom;

    // Set the horizontal alignment
    sheet.Range.get("B6").Style.HorizontalAlignment = xlsModule.HorizontalAlignType.General;
    sheet.Range.get("B7").Style.HorizontalAlignment = xlsModule.HorizontalAlignType.Left;
    sheet.Range.get("B8").Style.HorizontalAlignment = xlsModule.HorizontalAlignType.Center;
    sheet.Range.get("B9").Style.HorizontalAlignment = xlsModule.HorizontalAlignType.Right;

    // Widen column B and raise rows 2-4 so the alignment differences are visible
    sheet.Range.get("B1:B9").ColumnWidth = 32;
    sheet.Range.get("A2:B4").RowHeight = 40;

    // Save the workbook
    const outputFileName = "TextAlignment.xlsx";
    workbook.SaveToFile(outputFileName);

    // Release resources
    workbook.Dispose();

    // Read the result file from VFS and trigger the download
    const fileArray = window.dotnetRuntime.Module.FS.readFile(outputFileName);
    const blob = new Blob([fileArray], { type: "application/vnd.openxmlformats-officedocument.spreadsheetml.sheet" });
    const url = URL.createObjectURL(blob);
    const a = document.createElement('a');
    a.href = url;
    a.download = outputFileName;
    a.click();
    URL.revokeObjectURL(url);
  };

  return (
    <div style={{ textAlign: 'center', height: '300px' }}>
      <h1>Set Text Alignment</h1>
      <button onClick={setTextAlignment}>Start</button>
    </div>
  );
}

export default App;
Vertical alignment is only visible once the row is tall enough, which is why the example sets rows 2-4 to a height of 40; horizontal alignment is at its clearest once the column is wide enough.
After running, the effect of setting the alignment of text:
Set the Indent of Text
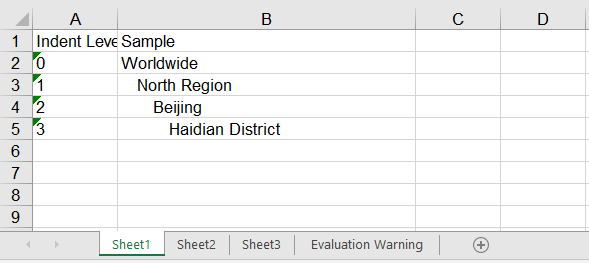
Indentation leaves blank space on the left (or right) inside a cell, which suits data that has a hierarchy, such as "region → city". The indent level is set through the IndentLevel property, where one level is roughly one character wide. The steps are as follows:
- Create a workbook and get the first worksheet.
- Write the sample text.
- Set the horizontal alignment to left so the indentation takes effect.
- Set an increasing indent level through
IndentLevel. - Save the workbook.
Here is a complete code example that sets the indent of cell text in React:
function App() {
  const setTextIndent = async () => {
    // Get the Spire.XLS WASM module
    const xlsModule = window.wasmModule?.spirexls;

    // Check if the module is ready
    if (!xlsModule) {
      alert('Spire.Xls is not ready yet');
      return;
    }

    // Load the font into VFS
    await window.spire.FetchFileToVFS('ARIAL.TTF', '/Library/Fonts/', `${process.env.PUBLIC_URL}/font/`);

    // Create a new workbook
    const workbook = new xlsModule.Workbook();

    // Get the first worksheet
    const sheet = workbook.Worksheets.get(0);

    // Write the sample text
    sheet.Range.get("A1").Text = "Indent Level";
    sheet.Range.get("B1").Text = "Sample";
    sheet.Range.get("A2").Text = "0";
    sheet.Range.get("B2").Text = "Worldwide";
    sheet.Range.get("A3").Text = "1";
    sheet.Range.get("B3").Text = "North Region";
    sheet.Range.get("A4").Text = "2";
    sheet.Range.get("B4").Text = "Beijing";
    sheet.Range.get("A5").Text = "3";
    sheet.Range.get("B5").Text = "Haidian District";

    // Indentation only takes effect together with left alignment
    sheet.Range.get("B2:B5").Style.HorizontalAlignment = xlsModule.HorizontalAlignType.Left;

    // Set the indentation level of the text
    sheet.Range.get("B2").Style.IndentLevel = 0;
    sheet.Range.get("B3").Style.IndentLevel = 1;
    sheet.Range.get("B4").Style.IndentLevel = 2;
    sheet.Range.get("B5").Style.IndentLevel = 3;

    // Widen column B so the indentation differences are visible
    sheet.Range.get("B1:B5").ColumnWidth = 32;

    // Save the workbook
    const outputFileName = "Indentation.xlsx";
    workbook.SaveToFile(outputFileName);

    // Release resources
    workbook.Dispose();

    // Read the result file from VFS and trigger the download
    const fileArray = window.dotnetRuntime.Module.FS.readFile(outputFileName);
    const blob = new Blob([fileArray], { type: "application/vnd.openxmlformats-officedocument.spreadsheetml.sheet" });
    const url = URL.createObjectURL(blob);
    const a = document.createElement('a');
    a.href = url;
    a.download = outputFileName;
    a.click();
    URL.revokeObjectURL(url);
  };

  return (
    <div style={{ textAlign: 'center', height: '300px' }}>
      <h1>Set Text Indent</h1>
      <button onClick={setTextIndent}>Start</button>
    </div>
  );
}

export default App;
The four rows step in one level at a time, forming exactly the hierarchy "Worldwide → North Region → Beijing → Haidian District". Cell B5 has an IndentLevel of 3, so its text starts about three characters in from the left edge.
After running, the effect of setting the indent of text:
Set the Orientation of Text
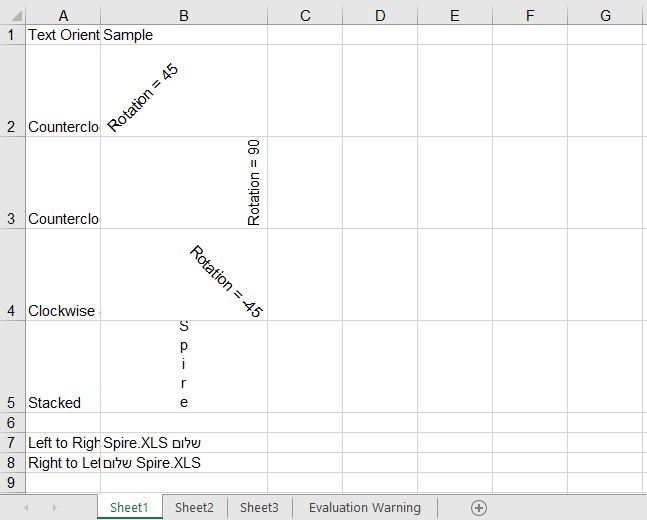
Text orientation covers two independent settings. The first is the rotation angle, set through the Rotation property, where values 0 to 90 are degrees counterclockwise and -1 to -90 are degrees clockwise. There is also the special value 255, which stacks the text vertically one character per line; rotation is often used to fit a long header into a narrow column. The second is the reading order, set through the ReadingOrder property, which accepts LeftToRight, RightToLeft and Context. It decides which direction the mixed content in a cell is laid out from, and is used for languages written from right to left such as Arabic and Hebrew. Rotated or stacked text takes up far more height than usual, so the row height has to be raised at the same time to keep the text inside the cell. The steps are as follows:
- Create a workbook and get the first worksheet.
- Write the sample text.
- Set the rotation angle through
Rotation. - Set the reading order through
ReadingOrder. - Save the workbook.
Here is a complete code example that sets the orientation of cell text in React:
function App() {
  const setTextOrientation = async () => {
    // Get the Spire.XLS WASM module
    const xlsModule = window.wasmModule?.spirexls;

    // Check if the module is ready
    if (!xlsModule) {
      alert('Spire.Xls is not ready yet');
      return;
    }

    // Load the font into VFS
    await window.spire.FetchFileToVFS('ARIAL.TTF', '/Library/Fonts/', `${process.env.PUBLIC_URL}/font/`);

    // Create a new workbook
    const workbook = new xlsModule.Workbook();

    // Get the first worksheet
    const sheet = workbook.Worksheets.get(0);

    // Write the sample text for the rotation angle
    sheet.Range.get("A1").Text = "Text Orientation";
    sheet.Range.get("B1").Text = "Sample";
    sheet.Range.get("A2").Text = "Counterclockwise 45";
    sheet.Range.get("B2").Text = "Rotation = 45";
    sheet.Range.get("A3").Text = "Counterclockwise 90";
    sheet.Range.get("B3").Text = "Rotation = 90";
    sheet.Range.get("A4").Text = "Clockwise 45";
    sheet.Range.get("B4").Text = "Rotation = -45";
    sheet.Range.get("A5").Text = "Stacked";
    sheet.Range.get("B5").Text = "Spire";

    // Write the sample text for the reading order: Latin mixed with Hebrew, so the
    // difference between the two directions is actually visible
    sheet.Range.get("A7").Text = "Left to Right";
    sheet.Range.get("B7").Text = "Spire.XLS שלום";
    sheet.Range.get("A8").Text = "Right to Left";
    sheet.Range.get("B8").Text = "Spire.XLS שלום";

    // Set the rotation angle of the text; 255 stacks the text vertically
    sheet.Range.get("B2").Style.Rotation = 45;
    sheet.Range.get("B3").Style.Rotation = 90;
    sheet.Range.get("B4").Style.Rotation = -45;
    sheet.Range.get("B5").Style.Rotation = 255;

    // Set the reading order of the text
    sheet.Range.get("B7").Style.ReadingOrder = xlsModule.ReadingOrderType.LeftToRight;
    sheet.Range.get("B8").Style.ReadingOrder = xlsModule.ReadingOrderType.RightToLeft;

    // Widen column B and raise rows 2-5 so the rotated and stacked text fits
    sheet.Range.get("B1:B8").ColumnWidth = 20;
    sheet.Range.get("A2:B5").RowHeight = 60;

    // Save the workbook
    const outputFileName = "TextOrientation.xlsx";
    workbook.SaveToFile(outputFileName);

    // Release resources
    workbook.Dispose();

    // Read the result file from VFS and trigger the download
    const fileArray = window.dotnetRuntime.Module.FS.readFile(outputFileName);
    const blob = new Blob([fileArray], { type: "application/vnd.openxmlformats-officedocument.spreadsheetml.sheet" });
    const url = URL.createObjectURL(blob);
    const a = document.createElement('a');
    a.href = url;
    a.download = outputFileName;
    a.click();
    URL.revokeObjectURL(url);
  };

  return (
    <div style={{ textAlign: 'center', height: '300px' }}>
      <h1>Set Text Orientation</h1>
      <button onClick={setTextOrientation}>Start</button>
    </div>
  );
}

export default App;
In the example, B2, B3 and B4 are rotated 45 degrees, 90 degrees and -45 degrees respectively, and B5 uses a Rotation of 255, which stacks the text into a column running top to bottom; all five rows are given a height of 60. B7 and B8 hold the same mixed Latin and Hebrew string with opposite reading orders, and the Hebrew ends up on opposite sides in the two rows — which is exactly what reading order does to mixed content.
After running, the effect of setting the orientation of text:
Set the Wrapping of Text
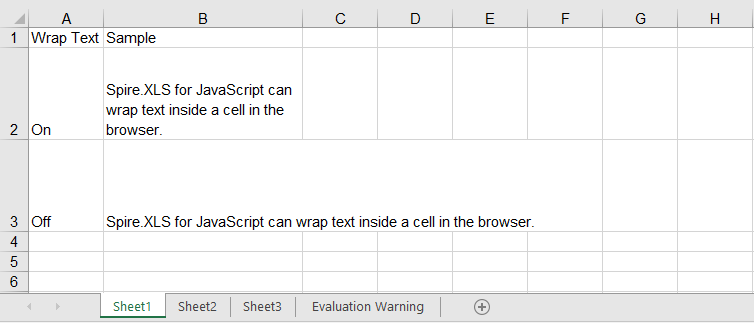
When a piece of text is longer than the column, it spills over onto the neighbouring empty cell by default, and is cut off as soon as that neighbour has content of its own. Setting the WrapText property to true folds the text inside the cell instead; setting it to false returns the text to a single line. As with rotation, wrapping only changes how the text is laid out and does not adjust the row height by itself, so the row height is usually raised as well to show every folded line in full. The steps are as follows:
- Create a workbook and get the first worksheet.
- Write a long piece of text.
- Turn wrapping on or off through
WrapText. - Adjust the column width and row height so the folding is fully visible.
- Save the workbook.
Here is a complete code example that sets the wrapping of cell text in React:
function App() {
  const setTextWrap = async () => {
    // Get the Spire.XLS WASM module
    const xlsModule = window.wasmModule?.spirexls;

    // Check if the module is ready
    if (!xlsModule) {
      alert('Spire.Xls is not ready yet');
      return;
    }

    // Load the font into VFS
    await window.spire.FetchFileToVFS('ARIAL.TTF', '/Library/Fonts/', `${process.env.PUBLIC_URL}/font/`);

    // Create a new workbook
    const workbook = new xlsModule.Workbook();

    // Get the first worksheet
    const sheet = workbook.Worksheets.get(0);

    // Write the sample text
    sheet.Range.get("A1").Text = "Wrap Text";
    sheet.Range.get("B1").Text = "Sample";
    sheet.Range.get("A2").Text = "On";
    sheet.Range.get("B2").Text = "Spire.XLS for JavaScript can wrap text inside a cell in the browser.";
    sheet.Range.get("A3").Text = "Off";
    sheet.Range.get("B3").Text = "Spire.XLS for JavaScript can wrap text inside a cell in the browser.";

    // Turn wrapping on so the text folds inside the cell when it is wider than the column
    sheet.Range.get("B2").Style.WrapText = true;

    // Turn wrapping off so the text stays on a single line
    sheet.Range.get("B3").Style.WrapText = false;

    // Narrow column B and raise rows 2-3 so the wrapping is visible
    sheet.Range.get("B1:B3").ColumnWidth = 24;
    sheet.Range.get("A2:B3").RowHeight = 60;

    // Save the workbook
    const outputFileName = "WrapText.xlsx";
    workbook.SaveToFile(outputFileName);

    // Release resources
    workbook.Dispose();

    // Read the result file from VFS and trigger the download
    const fileArray = window.dotnetRuntime.Module.FS.readFile(outputFileName);
    const blob = new Blob([fileArray], { type: "application/vnd.openxmlformats-officedocument.spreadsheetml.sheet" });
    const url = URL.createObjectURL(blob);
    const a = document.createElement('a');
    a.href = url;
    a.download = outputFileName;
    a.click();
    URL.revokeObjectURL(url);
  };

  return (
    <div style={{ textAlign: 'center', height: '300px' }}>
      <h1>Set Text Wrap</h1>
      <button onClick={setTextWrap}>Start</button>
    </div>
  );
}

export default App;
B2 and B3 hold the very same sentence; the only difference is the value of WrapText. B2 folds into several lines and shows in full, while B3 stays on one line. The cell to the right of B3 is empty, so the text spills into it; if there were content there, the overflow would simply be cut off.
After running, the effect of setting the wrapping of text:
FAQ
I set IndentLevel and the text is not indented at all?
Cause: Indentation is only displayed when the horizontal alignment is a non-General value such as Left or Right. Cells default to General alignment, and IndentLevel is ignored outright in that case — so setting only the indent level shows no change.
Solution: Set HorizontalAlignment first, then IndentLevel:
// Indentation only takes effect together with left alignment
sheet.Range.get("B2").Style.HorizontalAlignment = xlsModule.HorizontalAlignType.Left;
sheet.Range.get("B3").Style.HorizontalAlignment = xlsModule.HorizontalAlignType.Left;

// Set the indent level of the text
sheet.Range.get("B2").Style.IndentLevel = 1;
sheet.Range.get("B3").Style.IndentLevel = 2;
I want the text stacked vertically, one character per line — why does Rotation = 90 not do it?
Cause: The 0 to 90 and -1 to -90 ranges of Rotation only deal with the rotation angle. 90 merely lays the text on its side; it never breaks it into a column of single characters.
Solution: Stacked text needs the special value 255:
// 90 degrees simply rotates the text
sheet.Range.get("B2").Style.Rotation = 90;

// 255 stacks the text vertically, one character per line
sheet.Range.get("B3").Style.Rotation = 255;
Get a Free License
Spire.XLS for JavaScript offers a 30-day full-featured free trial license with no functional limitations. Apply here to evaluate before purchasing.
In Excel, formulas usually have to hard-code a specific cell range, such as =SUM(D2:D10). As such formulas multiply, maintenance costs rise: when the data range changes, every related formula must be updated one by one, and a single missed edit produces a wrong result. A named range is designed to solve exactly this problem — give a cell range a meaningful name and refer to that name in the formula. The range and the formula are thereby separated: changing the range takes a single edit, every formula that refers to it updates automatically, and the result is both less error-prone and easier to read. Spire.XLS for JavaScript ships a complete named range API and can create both global (workbook-level) and local (worksheet-level) named ranges in the browser through WebAssembly, with no backend service required.
This article covers two key features:
For installation and project setup, see Integrating Spire.XLS for JavaScript in a React Project. The examples below assume Spire.XLS is already installed and the WebAssembly module has been initialized.
Global Named Range
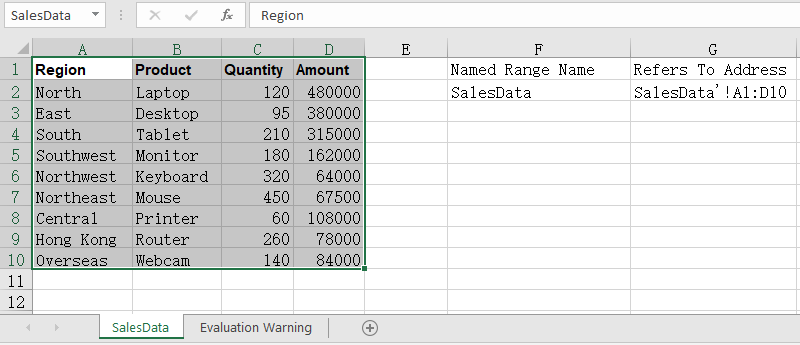
A global named range is stored in the workbook's name collection Workbook.NameRanges, its name is unique across the whole workbook, and any worksheet can refer to it directly. Create it with Workbook.NameRanges.Add() and point it at a cell range through the RefersToRange property. The steps are:
- Load the Excel file that contains the data and get the first worksheet.
- Create a global named range with
workbook.NameRanges.Add("SalesData"). - Set
namedRange.RefersToRangetosheet.Range.get("A1:D10"), that is, the range A1:D10. - Read
namedRange.NameandnamedRange.RefersToRange.RangeAddressand write the name and the referred address back into cells. - Save the workbook with the
Workbook.SaveToFile()method.
The following is a complete code example that shows how to create a global named range in React:
function App() {
  const createGlobalNamedRange = async () => {
    // Get the Spire.XLS WASM module
    const xlsModule = window.wasmModule?.spirexls;

    // Check if the module is ready
    if (!xlsModule) {
      alert('Spire.Xls is not ready yet');
      return;
    }

    // Load the font into VFS
    await window.spire.FetchFileToVFS('ARIAL.TTF', '/Library/Fonts/', `${process.env.PUBLIC_URL}/font/`);

    // Load the Excel file into VFS
    const inputFileName = 'NamedRanges.xlsx';
    await window.spire.FetchFileToVFS(inputFileName, '', `${process.env.PUBLIC_URL}/static/data/`);

    // Load the workbook
    const workbook = new xlsModule.Workbook();
    workbook.LoadFromFile(inputFileName);

    // Get the first worksheet
    let sheet = workbook.Worksheets.get(0);

    // Create a workbook-level (global) named range
    let namedRange = workbook.NameRanges.Add("SalesData");

    // Set the cell range the named range refers to
    namedRange.RefersToRange = sheet.Range.get("A1:D10");

    // Read the name and the referred address
    sheet.Range.get("F1").Text = "Named Range Name";
    sheet.Range.get("F2").Text = namedRange.Name;
    sheet.Range.get("G1").Text = "Refers To Address";
    sheet.Range.get("G2").Text = namedRange.RefersToRange.RangeAddress;

    // Auto-fit the columns
    sheet.AllocatedRange.AutoFitColumns();

    // Save the workbook
    const outputFileName = 'GlobalNamedRange.xlsx';
    workbook.SaveToFile(outputFileName);

    // Release resources
    workbook.Dispose();

    // Read the result file from VFS and trigger the download
    const fileArray = window.dotnetRuntime.Module.FS.readFile(outputFileName);
    const blob = new Blob([fileArray], { type: "application/vnd.openxmlformats-officedocument.spreadsheetml.sheet" });
    const url = URL.createObjectURL(blob);
    const a = document.createElement('a');
    a.href = url;
    a.download = outputFileName;
    a.click();
    URL.revokeObjectURL(url);
  };

  return (
    <div style={{ textAlign: 'center', height: '300px' }}>
      <h1>Create Global Named Range</h1>
      <button onClick={createGlobalNamedRange}>Start</button>
    </div>
  );
}

export default App;
After running, the effect of creating a global named range:
Local Named Range
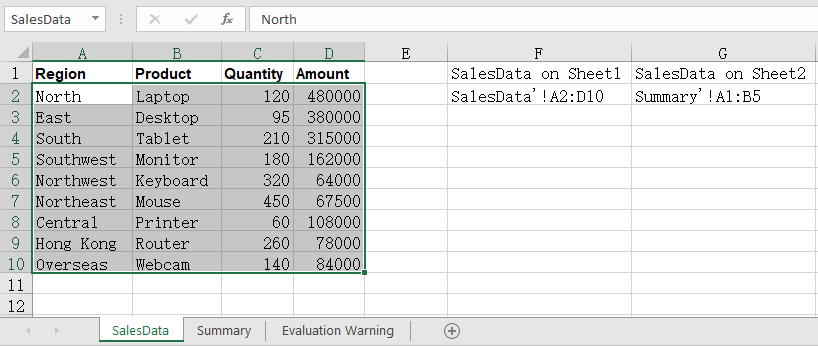
A global named range requires its name to be unique across the entire workbook. When different worksheets all want to use the same name while pointing at different data areas, switch to a local named range instead — added through Worksheet.Names.Add(), its name only takes effect inside the owning worksheet, so same-named ranges can live on several worksheets at once without interfering with each other. The steps are:
- Load the workbook and get the first worksheet.
- Create a local named range on the first worksheet with
sheet.Names.Add("SalesData"), pointing atA2:D10. - Add another worksheet with
workbook.Worksheets.Add()and create a same-named local named range on it, pointing at a different area. - Read the referred address of both ranges back into cells.
- Save the workbook.
The following is a complete code example that shows how to create a local named range in React:
function App() {
  const createLocalNamedRange = async () => {
    // Get the Spire.XLS WASM module
    const xlsModule = window.wasmModule?.spirexls;

    // Check if the module is ready
    if (!xlsModule) {
      alert('Spire.Xls is not ready yet');
      return;
    }

    // Load the font into VFS
    await window.spire.FetchFileToVFS('ARIAL.TTF', '/Library/Fonts/', `${process.env.PUBLIC_URL}/font/`);

    // Load the Excel file into VFS
    const inputFileName = 'NamedRanges.xlsx';
    await window.spire.FetchFileToVFS(inputFileName, '', `${process.env.PUBLIC_URL}/static/data/`);

    // Load the workbook
    const workbook = new xlsModule.Workbook();
    workbook.LoadFromFile(inputFileName);

    // Get the first worksheet
    let sheet = workbook.Worksheets.get(0);

    // Create a local named range on the first worksheet
    let localRange = sheet.Names.Add("SalesData");
    localRange.RefersToRange = sheet.Range.get("A2:D10");

    // Add another worksheet and create a same-named local range on it
    let sheet2 = workbook.Worksheets.Add("Summary");
    let localRange2 = sheet2.Names.Add("SalesData");
    localRange2.RefersToRange = sheet2.Range.get("A1:B5");

    // Read the addresses of the same-named ranges in both worksheets
    sheet.Range.get("F1").Text = "SalesData on Sheet1";
    sheet.Range.get("F2").Text = localRange.RefersToRange.RangeAddress;
    sheet.Range.get("G1").Text = "SalesData on Sheet2";
    sheet.Range.get("G2").Text = localRange2.RefersToRange.RangeAddress;

    // Auto-fit the columns
    sheet.AllocatedRange.AutoFitColumns();

    // Save the workbook
    const outputFileName = 'LocalNamedRange.xlsx';
    workbook.SaveToFile(outputFileName);

    // Release resources
    workbook.Dispose();

    // Read the result file from VFS and trigger the download
    const fileArray = window.dotnetRuntime.Module.FS.readFile(outputFileName);
    const blob = new Blob([fileArray], { type: "application/vnd.openxmlformats-officedocument.spreadsheetml.sheet" });
    const url = URL.createObjectURL(blob);
    const a = document.createElement('a');
    a.href = url;
    a.download = outputFileName;
    a.click();
    URL.revokeObjectURL(url);
  };

  return (
    <div style={{ textAlign: 'center', height: '300px' }}>
      <h1>Create Local Named Range</h1>
      <button onClick={createLocalNamedRange}>Start</button>
    </div>
  );
}

export default App;
After running, the effect of creating a local named range:
FAQ
How do I use a named range in a formula?
Cause: The real value of a named range is being referenced from formulas. Once the amount column is defined as a named range, the formula no longer needs a literal address, and the summed range expands automatically when rows are inserted later.
Solution: Simply write the name of the named range into the formula:
let namedRange = workbook.NameRanges.Add("SalesAmount");
namedRange.RefersToRange = sheet.Range.get("D2:D10");

// Refer to the named range in a formula
sheet.Range.get("F2").Formula = "=SUM(SalesAmount)";
How do I read the named ranges that already exist in a workbook?
Cause: A named range is saved together with the workbook, so it has to be read back before you can tell which names currently exist and which area each one points to.
Solution: Walk the NameRanges collection: take the count first, then read the name and the refers-to address of each entry by index:
// Total number of named ranges
let count = workbook.NameRanges.Count;

// Read the name and the refers-to address of each one
for (let i = 0; i < count; i++) {
  let namedRange = workbook.NameRanges.get(i);
  sheet.Range.get(`F${i + 2}`).Text = namedRange.Name;
  sheet.Range.get(`G${i + 2}`).Text = namedRange.RefersToRange.RangeAddress;
}
This walks workbook-level named ranges; worksheet-level ones are read through sheet.Names, in exactly the same way.
Get a Free License
Spire.XLS for JavaScript offers a 30-day full-featured free trial license with no functional limitations. Apply here to evaluate before purchasing.
When you need to compare several metrics across multiple dimensions at the same time, a radar chart is a very intuitive way to present them — each dimension is placed on an axis radiating out from the center, and the values on those axes are joined into a polygon, so the shape immediately shows where the strengths and weaknesses are. Spire.XLS for JavaScript provides a complete charting API that supports creating radar charts directly in the browser via WebAssembly, without requiring a backend service.
This article covers two core features:
For installation and project configuration, please refer to Integrating Spire.XLS for JavaScript in a React Project. The following examples assume Spire.XLS is already installed and the WebAssembly module has been initialized.
Create a Radar Chart
You can add a radar chart to a worksheet with the sheet.Charts.Add() method. The steps are as follows:
- Load the Excel file that contains the data and get the first worksheet.
- Add a radar chart with
Charts.Add({ chartType: ExcelChartType.Radar }). - Set the
DataRangeproperty to specify the chart data range: the first row holds the series names, the first column holds the category names for each axis, and the remaining cells hold the values. - Set
SeriesDataFromRange = falseso that the data is not taken from a row/column layout. - Set the chart title, position, and legend position.
- Save the workbook with the
Workbook.SaveToFile()method.
Below is a complete code example that shows how to create a radar chart in React:
function App() {
  const createRadarChart = async () => {
    // Get the Spire.XLS WASM module
    const xlsModule = window.wasmModule?.spirexls;

    // Check if the module is ready
    if (!xlsModule) {
      alert('Spire.Xls is not ready yet');
      return;
    }

    // Load the Excel file into VFS
    const inputFileName = 'RadarChartData.xlsx';
    await window.spire.FetchFileToVFS(inputFileName, '', `${process.env.PUBLIC_URL}/static/data/`);

    // Load the workbook
    const workbook = new xlsModule.Workbook();
    workbook.LoadFromFile(inputFileName);

    // Get the first worksheet
    let sheet = workbook.Worksheets.get(0);

    // Add a radar chart
    let chart = sheet.Charts.Add({ chartType: xlsModule.ExcelChartType.Radar });

    // Set the chart data range
    chart.DataRange = sheet.Range.get("A1:C5");
    chart.SeriesDataFromRange = false;

    // Set the chart position
    chart.LeftColumn = 7;
    chart.TopRow = 6;
    chart.RightColumn = 16;
    chart.BottomRow = 29;

    // Set the chart title
    chart.ChartTitle = "Product Sales by Region";
    chart.ChartTitleArea.IsBold = true;
    chart.ChartTitleArea.Size = 12;

    // Set the legend position
    chart.Legend.Position = xlsModule.LegendPositionType.Corner;

    // Save the workbook
    const outputFileName = 'CreateRadarChart.xlsx';
    workbook.SaveToFile(outputFileName);

    // Release resources
    workbook.Dispose();

    // Read the converted file from VFS and trigger download
    const fileArray = window.dotnetRuntime.Module.FS.readFile(outputFileName);
    const blob = new Blob([fileArray], { type: "application/vnd.openxmlformats-officedocument.spreadsheetml.sheet" });
    const url = URL.createObjectURL(blob);
    const a = document.createElement('a');
    a.href = url;
    a.download = outputFileName;
    a.click();
    URL.revokeObjectURL(url);
  };

  return (
    <div style={{ textAlign: 'center', height: '300px' }}>
      <h1>Create a Radar Chart</h1>
      <button onClick={createRadarChart}>Start</button>
    </div>
  );
}

export default App;
After running, the effect of creating a radar chart:

Style the Radar Chart
After creating the radar chart, you can further improve its appearance by setting the chart area, plot area, and series line colors. The steps are as follows:
- Get the radar chart object that has been created.
- Set the
ChartArea.Fill.ForeColorproperty to set the chart background color. - Set the
PlotArea.Fill.ForeColorproperty to set the plot area background color. - Set the
Series[i].Format.LineProperties.Colorproperty to specify the line color of each series;Series.get(0)andSeries.get(1)correspond to the two series in the data range. - Save the workbook.
Below is a complete code example that shows how to style the radar chart:
function App() {
  const styleRadarChart = async () => {
    // Get the Spire.XLS WASM module
    const xlsModule = window.wasmModule?.spirexls;

    // Check if the module is ready
    if (!xlsModule) {
      alert('Spire.Xls is not ready yet');
      return;
    }

    // Load the Excel file into VFS
    const inputFileName = 'RadarChartData.xlsx';
    await window.spire.FetchFileToVFS(inputFileName, '', `${process.env.PUBLIC_URL}/static/data/`);

    // Load the workbook
    const workbook = new xlsModule.Workbook();
    workbook.LoadFromFile(inputFileName);

    // Get the first worksheet
    let sheet = workbook.Worksheets.get(0);

    // Add a radar chart
    let chart = sheet.Charts.Add({ chartType: xlsModule.ExcelChartType.Radar });

    // Set the chart data range
    chart.DataRange = sheet.Range.get("A1:C5");
    chart.SeriesDataFromRange = false;

    // Set the chart position
    chart.LeftColumn = 7;
    chart.TopRow = 6;
    chart.RightColumn = 16;
    chart.BottomRow = 29;

    // Set the chart title
    chart.ChartTitle = "Product Sales by Region";
    chart.ChartTitleArea.IsBold = true;
    chart.ChartTitleArea.Size = 12;

    // Style the radar chart
    // Set the chart area background color
    chart.ChartArea.Fill.ForeColor = xlsModule.Color.get_LightCyan();
    // Set the plot area background color
    chart.PlotArea.Fill.ForeColor = xlsModule.Color.get_LightYellow();
    // Set the color of the first series line
    chart.Series.get(0).Format.LineProperties.Color = xlsModule.Color.get_Orange();
    // Set the color of the second series line
    chart.Series.get(1).Format.LineProperties.Color = xlsModule.Color.get_CornflowerBlue();

    // Save the workbook
    const outputFileName = 'StyledRadarChart.xlsx';
    workbook.SaveToFile(outputFileName);

    // Release resources
    workbook.Dispose();

    // Read the converted file from VFS and trigger download
    const fileArray = window.dotnetRuntime.Module.FS.readFile(outputFileName);
    const blob = new Blob([fileArray], { type: "application/vnd.openxmlformats-officedocument.spreadsheetml.sheet" });
    const url = URL.createObjectURL(blob);
    const a = document.createElement('a');
    a.href = url;
    a.download = outputFileName;
    a.click();
    URL.revokeObjectURL(url);
  };

  return (
    <div style={{ textAlign: 'center', height: '300px' }}>
      <h1>Style the Radar Chart</h1>
      <button onClick={styleRadarChart}>Start</button>
    </div>
  );
}

export default App;
After running, the effect of styling the radar chart:

Frequently Asked Questions
The radar chart does not change after setting a series color
Reason: A radar chart draws each series as a line, so setting a fill color with Series.get(i).Format.Fill has no effect.
Solution: Set the line color through Series.get(i).Format.LineProperties.Color, for example:
chart.Series.get(0).Format.LineProperties.Color = xlsModule.Color.get_Orange();
How do I adjust the legend position of a radar chart?
Reason: The legend is docked to the right of the chart by default, where it competes with the plot area for width — especially noticeable on a radar chart, which already takes up a lot of horizontal space.
Solution: Set the legend position with the chart.Legend.Position property. The available values are LegendPositionType.Bottom, Corner, Top, Right, Left, and NotDocked. For example, to move the legend to the top-right corner:
chart.Legend.Position = xlsModule.LegendPositionType.Corner;
Get a Free License
Spire.XLS for JavaScript offers a 30-day full-featured free trial license with no functional limitations. Apply here to evaluate before purchasing.
In data analysis scenarios, bubble charts help intuitively display multi-dimensional data relationships. Each data point in a bubble chart is defined by three values: X-axis value, Y-axis value, and bubble size. Spire.XLS for JavaScript provides rich charting APIs that support creating bubble charts directly in the browser via WebAssembly, without requiring a backend service.
This article covers two core features:
For installation and project configuration, please refer to Integrating Spire.XLS for JavaScript in a React Project. The following examples assume Spire.XLS is already installed and the WebAssembly module has been initialized.
Create a Bubble Chart
A bubble chart can be added to a worksheet using the sheet.Charts.Add() method. The specific steps are as follows:
- Create a
Workbookobject and get the first worksheet. - Add a bubble chart via
Charts.Add(ExcelChartType.Bubble). - Set the
DataRangeproperty to specify the chart data area. - Set
SeriesDataFromRange = falseto indicate that data is not obtained from row/column layout. - Set
Series[0].Bubblesto specify the bubble size data range. - Set the chart title, position, and dimensions.
- Save the workbook via
Workbook.SaveToFile().
The following is a complete code example that demonstrates creating a bubble chart in React:
function App() {
  const createBubbleChart = async () => {
    // Get the Spire.XLS WASM module
    const xlsModule = window.wasmModule?.spirexls;

    // Check if the module is ready
    if (!xlsModule) {
      alert('Spire.Xls is not ready yet');
      return;
    }

    // Load the Excel file into VFS
    const inputFileName = 'CreateBubbleChart.xlsx';
    await window.spire.FetchFileToVFS(inputFileName, '', `${process.env.PUBLIC_URL}/static/data/`);

    // Load the workbook
    const workbook = new xlsModule.Workbook();
    workbook.LoadFromFile(inputFileName);

    // Get the first worksheet
    let sheet = workbook.Worksheets.get(0);

    // Add a bubble chart
    let chart = sheet.Charts.Add({ chartType: xlsModule.ExcelChartType.Bubble });

    // Set the chart data range
    chart.DataRange = sheet.Range.get("A1:C5");
    chart.SeriesDataFromRange = false;

    // Set the bubble sizes
    chart.Series.get(0).Bubbles = sheet.Range.get("C2:C5");

    // Set the chart position
    chart.LeftColumn = 7;
    chart.TopRow = 6;
    chart.RightColumn = 16;
    chart.BottomRow = 29;

    // Set the chart title
    chart.ChartTitle = "Bubble Chart";
    chart.ChartTitleArea.IsBold = true;
    chart.ChartTitleArea.Size = 12;

    // Save the workbook
    const outputFileName = 'CreateBubbleChart.xlsx';
    workbook.SaveToFile(outputFileName);

    // Dispose resources
    workbook.Dispose();

    // Read the converted file from VFS and trigger download
    const fileArray = window.dotnetRuntime.Module.FS.readFile(outputFileName);
    const blob = new Blob([fileArray], { type: "application/vnd.openxmlformats-officedocument.spreadsheetml.sheet" });
    const url = URL.createObjectURL(blob);
    const a = document.createElement('a');
    a.href = url;
    a.download = outputFileName;
    a.click();
    URL.revokeObjectURL(url);
  };

  return (
    <div style={{ textAlign: 'center', height: '300px' }}>
      <h1>Create Bubble Chart</h1>
      <button onClick={createBubbleChart}>Start</button>
    </div>
  );
}

export default App;
After running the code, the effect of creating a bubble chart is as follows:

Style the Bubble Chart
After creating a bubble chart, you can enhance its appearance by setting the chart area, plot area, and series colors. The specific steps are as follows:
- Get the created bubble chart object.
- Set the
ChartArea.Fill.ForeColorproperty to set the chart background color. - Set the
PlotArea.Fill.ForeColorproperty to set the plot area background color. - Set the
Series[0].Format.Fill.ForeColorproperty to set the series color. - Set the
Series[0].HasDataLabelsproperty to enable data labels, and specify the label content throughDataPoints.DefaultDataPoint.DataLabels. - Save the workbook.
The following is a complete code example that demonstrates how to style a bubble chart:
function App() {
  const styleBubbleChart = async () => {
    // Get the Spire.XLS WASM module
    const xlsModule = window.wasmModule?.spirexls;

    // Check if the module is ready
    if (!xlsModule) {
      alert('Spire.Xls is not ready yet');
      return;
    }

    // Load the Excel file into VFS
    const inputFileName = 'CreateBubbleChart.xlsx';
    await window.spire.FetchFileToVFS(inputFileName, '', `${process.env.PUBLIC_URL}/static/data/`);

    // Load the workbook
    const workbook = new xlsModule.Workbook();
    workbook.LoadFromFile(inputFileName);

    // Get the first worksheet
    let sheet = workbook.Worksheets.get(0);

    // Add a bubble chart
    let chart = sheet.Charts.Add({ chartType: xlsModule.ExcelChartType.Bubble });

    // Set the chart data range
    chart.DataRange = sheet.Range.get("A1:C5");
    chart.SeriesDataFromRange = false;

    // Set the bubble sizes
    chart.Series.get(0).Bubbles = sheet.Range.get("C2:C5");

    // Set the chart position
    chart.LeftColumn = 7;
    chart.TopRow = 6;
    chart.RightColumn = 16;
    chart.BottomRow = 29;

    // Set the chart title
    chart.ChartTitle = "Bubble Chart";
    chart.ChartTitleArea.IsBold = true;
    chart.ChartTitleArea.Size = 12;

    // Style the bubble chart
    // Set chart area background color
    chart.ChartArea.Fill.ForeColor = xlsModule.Color.get_LightCyan();
    // Set plot area background color
    chart.PlotArea.Fill.ForeColor = xlsModule.Color.get_LightYellow();
    // Set series color
    chart.Series.get(0).Format.Fill.FillType = xlsModule.ShapeFillType.SolidColor;
    chart.Series.get(0).Format.Fill.ForeColor = xlsModule.Color.get_Orange();
    // Enable and set data labels
    chart.Series.get(0).HasDataLabels = true;
    chart.Series.get(0).DataPoints.DefaultDataPoint.DataLabels.HasCategoryName = true;
    chart.Series.get(0).DataPoints.DefaultDataPoint.DataLabels.HasValue = true;

    // Save the workbook
    const outputFileName = 'StyledBubbleChart.xlsx';
    workbook.SaveToFile(outputFileName);

    // Dispose resources
    workbook.Dispose();

    // Read the converted file from VFS and trigger download
    const fileArray = window.dotnetRuntime.Module.FS.readFile(outputFileName);
    const blob = new Blob([fileArray], { type: "application/vnd.openxmlformats-officedocument.spreadsheetml.sheet" });
    const url = URL.createObjectURL(blob);
    const a = document.createElement('a');
    a.href = url;
    a.download = outputFileName;
    a.click();
    URL.revokeObjectURL(url);
  };

  return (
    <div style={{ textAlign: 'center', height: '300px' }}>
      <h1>Style Bubble Chart</h1>
      <button onClick={styleBubbleChart}>Start</button>
    </div>
  );
}

export default App;
After running the code, the effect of styling the bubble chart is as follows:

Frequently Asked Questions
What do columns A, B, and C in DataRange represent?
Reason: Each data point in a bubble chart needs three values — an X-axis value, a Y-axis value, and a bubble size — and the three columns specified by DataRange correspond to them exactly.
Solution: Taking chart.DataRange = sheet.Range.get("A1:C5") as an example, column A serves as the category (X axis), column B as the Y-axis value, and column C is set as the bubble size through chart.Series.get(0).Bubbles = sheet.Range.get("C2:C5"). The order of these three columns cannot be swapped, or both the point positions and the bubble sizes will be wrong.
Why does the data range start at A1 instead of A2?
Reason: The first row of the data range is used as the series name.
Solution: Include the header row in DataRange. In the example, the "Sales" shown in the legend comes from cell B1, so the data range is written as A1:C5 rather than A2:C5.
Get a Free License
Spire.XLS for JavaScript offers a 30-day full-featured free trial license with no functional limitations. Apply here to evaluate before purchasing.
In data analysis scenarios, trendlines help you visually identify data trends and predict directions from Excel charts. Spire.XLS for JavaScript provides rich trendline APIs that allow you to add various types of trendlines to chart series directly in the browser via WebAssembly, without requiring a backend service.
This article covers two core features:
For installation and project configuration, please refer to Integrating Spire.XLS for JavaScript in a React Project. The following examples assume Spire.XLS is installed and the WebAssembly module has been initialized.
Add Trendline to Chart
You can add trendlines to any series in a chart through the chart.Series.get(i).TrendLines.Add() method. Spire.XLS for JavaScript supports 4 types of trendlines defined in the TrendLineType enumeration:
Linear— Linear trendline, suitable for data showing steady increase or decreaseExponential— Exponential trendline, suitable for scenarios where the growth or decline rate acceleratesLogarithmic— Logarithmic trendline, suitable for data that changes rapidly then stabilizesMoving_Average— Moving average trendline, suitable for smoothing data fluctuations
Specific steps:
- Create a
Workbookobject and get the first worksheet. - Get the chart that needs a trendline through
Worksheet.Charts.get(i). - Call
chart.Series.get(0).TrendLines.Add()with thetypeparameter specifying the trendline type. - Save the workbook through
Workbook.SaveToFile().
Below is a complete code example showing how to add four different types of trendlines to an Excel chart in React:
function App() {
  const addTrendline = async () => {
    // Get the Spire.XLS WASM module
    const xlsModule = window.wasmModule?.spirexls;

    // Check if the module is ready
    if (!xlsModule) {
      alert('Spire.Xls is not ready yet');
      return;
    }

    // Load the Excel file into VFS
    const inputFileName = 'ChartTrendline_en.xlsx';
    await window.spire.FetchFileToVFS(inputFileName, '', `${process.env.PUBLIC_URL}data/`);

    // Load the workbook
    const workbook = new xlsModule.Workbook();
    workbook.LoadFromFile({ fileName: inputFileName });

    // Get the first chart from the first worksheet
    let chart = workbook.Worksheets.get(0).Charts.get(0);

    // Add linear trendline
    chart.ChartTitle = "Linear Trendline";
    chart.Series.get(0).TrendLines.Add({ type: xlsModule.TrendLineType.Linear });

    // Add exponential trendline
    chart = workbook.Worksheets.get(0).Charts.get(0);
    chart.ChartTitle = "Exponential Trendline";
    chart.Series.get(0).TrendLines.Add({ type: xlsModule.TrendLineType.Exponential });

    // Add logarithmic trendline
    chart.ChartTitle = "Logarithmic Trendline";
    chart.Series.get(0).TrendLines.Add({ type: xlsModule.TrendLineType.Logarithmic });

    // Add moving average trendline
    chart.ChartTitle = "Moving Average Trendline";
    chart.Series.get(0).TrendLines.Add({ type: xlsModule.TrendLineType.Moving_Average });

    // Save the document
    const outputFileName = 'AddTrendline.xlsx';
    workbook.SaveToFile({ fileName: outputFileName, version: xlsModule.ExcelVersion.Version2010 });

    // Release resources
    workbook.Dispose();

    // Read the converted file from VFS and trigger download
    const fileArray = window.dotnetRuntime.Module.FS.readFile(outputFileName);
    const blob = new Blob([fileArray], { type: 'application/vnd.openxmlformats-officedocument.spreadsheetml.sheet' });
    const url = URL.createObjectURL(blob);
    const a = document.createElement('a');
    a.href = url;
    a.download = outputFileName;
    a.click();
    URL.revokeObjectURL(url);
  };

  return (
    <div style={{ textAlign: 'center', height: '300px' }}>
      <h1>Add Trendline to Chart</h1>
      <button onClick={addTrendline}>Start</button>
    </div>
  );
}

export default App;
After running the code, you get the effect of adding four different types of trendlines to a chart:

Extract Trendline Formula
You can obtain the mathematical formula of a trendline through the trendLine.Formula property, making it easy to display the trendline's analytical expression in reports.
Specific steps:
- Load the
AddTrendline.xlsxfile generated in Step 1, which contains four charts. - Use
Worksheet.Charts.get(i)to iterate through all four charts. - Read the
trendLine.Formulaproperty from each chart to obtain the formula string, then save all formulas to a text file.
Below is a complete code example showing how to extract trendline formulas in React:
function App() {
  const extractTrendlineFormula = async () => {
    // Get the Spire.XLS WASM module
    const xlsModule = window.wasmModule?.spirexls;

    // Check if the module is ready
    if (!xlsModule) {
      alert('Spire.Xls is not ready yet');
      return;
    }

    // Load the AddTrendline.xlsx file generated in Step 1 into VFS
    const inputFileName = 'AddTrendline.xlsx';
    await window.spire.FetchFileToVFS(inputFileName, '', `${process.env.PUBLIC_URL}data/`);

    // Load the workbook
    const workbook = new xlsModule.Workbook();
    workbook.LoadFromFile({ fileName: inputFileName });

    // Get the first worksheet
    let sheet = workbook.Worksheets.get(0);
    let result = "Extracted trendline formulas from four charts:\n\n";

    // Iterate through all four charts and extract trendline formulas
    for (let i = 0; i < 4; i++) {
      let chart = sheet.Charts.get(i);
      let trendLine = chart.Series.get(0).TrendLines.get(0);
      // Moving average trendline has no mathematical formula
      if (trendLine.Type === xlsModule.TrendLineType.Moving_Average) {
        result += `Chart ${i + 1} (${chart.ChartTitle}): N/A (Moving Average)\n`;
      } else {
        let formula = trendLine.Formula;
        result += `Chart ${i + 1} (${chart.ChartTitle}): ${formula}\n`;
      }
    }

    // Release resources
    workbook.Dispose();

    // Save the formulas to a text file and trigger download
    const outputFileName = 'ExtractTrendline.txt';
    const blob = new Blob([result], { type: "text/plain;charset=utf-8" });
    const url = URL.createObjectURL(blob);
    const a = document.createElement('a');
    a.href = url;
    a.download = outputFileName;
    a.click();
    URL.revokeObjectURL(url);
  };

  return (
    <div style={{ textAlign: 'center', height: '300px' }}>
      <h1>Extract Trendline Formula</h1>
      <button onClick={extractTrendlineFormula}>Start</button>
    </div>
  );
}

export default App;
After running the code, you get the effect of extracting trendline formulas:

FAQ
How to delete an added trendline from a chart?
Cause: A trendline has already been added to the chart, but it needs to be removed or replaced.
Solution: Use the TrendLines.RemoveAt(index) method to remove a trendline at a specific index. Indexing starts from 0. For example, chart.Series.get(0).TrendLines.RemoveAt(0) removes the first trendline from the first series.
How to set forward/backward prediction periods for a trendline?
Cause: A trendline can not only fit existing data, but also predict future or past values based on the trend.
Solution: Use the trendLine.Forward and trendLine.Backward properties to set the number of prediction periods forward and backward respectively. For example, trendLine.Forward = 2 predicts two periods beyond the current data, while trendLine.Backward = 1 extrapolates one period before the data.
Get Free License
Spire.XLS for JavaScript offers a 30-day full-featured free trial license with no functional limitations. Apply here to evaluate before purchasing.
When creating flowcharts, relationship diagrams, or data annotations, inserting lines into an Excel worksheet is a common requirement. Spire.XLS for JavaScript provides rich line APIs for creating various line types (straight lines, curved lines, elbow connectors, etc.) and arrow-tipped connectors. All operations are performed directly in the browser based on WebAssembly, with no backend service required.
This article covers two core features:
For installation and project configuration, refer to Integrating Spire.XLS for JavaScript in a React Project. The examples below assume Spire.XLS is installed and the WebAssembly module is initialized.
Insert Different Types of Lines
The sheet.Lines.AddLine() method inserts line shapes at a specified position. Using the LineShapeType enum, you can create various line types: straight lines (Line), curved lines (CurveLine), elbow connectors (ElbowLine), and inverted lines (LineInv). The appearance of lines can be customized through properties such as DashStyle (dash style), Color (color), and Weight (thickness).
The main steps are as follows:
- Create a
Workbookobject and get the first worksheet. - Call the
Worksheet.Lines.AddLine()method, passing position parameters andLineShapeTypeto specify the line type. - Customize line appearance through the
DashStyle,Color,Weight, andEndArrowHeadStyleproperties. - Save the workbook with the
Workbook.SaveToFile()method.
Here is a complete code example showing how to insert four different types of lines into Excel in React:
function App() {
  const addLineShapes = async () => {
    // Get the Spire.XLS WASM module
    const xlsModule = window.wasmModule?.spirexls;

    // Check whether the module is ready
    if (!xlsModule) {
      alert('Spire.Xls is not ready yet');
      return;
    }

    // Load the font into the VFS for text measurement and column auto-fit
    await window.spire.FetchFileToVFS('ARIAL.TTF', '/Library/Fonts/', `${process.env.PUBLIC_URL}/font/`);

    // Create a new workbook and get the first worksheet
    const workbook = new xlsModule.Workbook();
    const sheet = workbook.Worksheets.get(0);

    // Add a straight line - solid, CadetBlue, weight 2, with arrow
    let line1 = sheet.Lines.AddLine({ row: 10, column: 2, width: 200, height: 1, lineShapeType: xlsModule.LineShapeType.Line });
    line1.DashStyle = xlsModule.ShapeDashLineStyleType.Solid;
    line1.Color = xlsModule.Color.get_CadetBlue();
    line1.Weight = 2;
    line1.EndArrowHeadStyle = xlsModule.ShapeArrowStyleType.LineArrow;

    // Add a curved line - dotted, OrangeRed, weight 2
    let line2 = sheet.Lines.AddLine({ row: 12, column: 2, width: 200, height: 1, lineShapeType: xlsModule.LineShapeType.CurveLine });
    line2.DashStyle = xlsModule.ShapeDashLineStyleType.Dotted;
    line2.Color = xlsModule.Color.get_OrangeRed();
    line2.Weight = 2;

    // Add an elbow connector - DashDotDot, Purple, weight 2
    let line3 = sheet.Lines.AddLine({ row: 14, column: 2, width: 200, height: 1, lineShapeType: xlsModule.LineShapeType.ElbowLine });
    line3.DashStyle = xlsModule.ShapeDashLineStyleType.DashDotDot;
    line3.Color = xlsModule.Color.get_Purple();
    line3.Weight = 2;

    // Add an inverted line - Dashed, Green, weight 2
    let line4 = sheet.Lines.AddLine({ row: 16, column: 2, width: 200, height: 1, lineShapeType: xlsModule.LineShapeType.LineInv });
    line4.DashStyle = xlsModule.ShapeDashLineStyleType.Dashed;
    line4.Color = xlsModule.Color.get_Green();
    line4.Weight = 2;

    // Save the workbook
    const outputFileName = 'AddLineShapes.xlsx';
    workbook.SaveToFile({ fileName: outputFileName, version: xlsModule.ExcelVersion.Version2010 });

    // Release resources
    workbook.Dispose();

    // Read the saved file from the VFS and trigger the download
    const fileArray = window.dotnetRuntime.Module.FS.readFile(outputFileName);
    const blob = new Blob([fileArray], { type: 'application/vnd.openxmlformats-officedocument.spreadsheetml.sheet' });
    const url = URL.createObjectURL(blob);
    const a = document.createElement('a');
    a.href = url;
    a.download = outputFileName;
    a.click();
    URL.revokeObjectURL(url);
  };

  return (
    <div style={{ textAlign: 'center', height: '300px' }}>
      <h1>Add Line Shapes</h1>
      <button onClick={addLineShapes}>Start</button>
    </div>
  );
}

export default App;
Effect of inserting different line types:

Insert Arrow-Tipped Lines
The sheet.TypedLines.AddLine() method inserts arrow-tipped lines. Unlike Lines.AddLine(), TypedLines supports precise positioning using pixel coordinates or row/column coordinates, and supports setting different arrow head styles on both ends (beginning BeginArrowHeadStyle and end EndArrowHeadStyle).
The main steps are as follows:
- Create a
Workbookobject and get the first worksheet. - Call the
Worksheet.TypedLines.AddLine()method to create a line. - Set line position through the
Top,Left,Width, andHeightproperties (in pixels). - Set arrow styles on both ends through
BeginArrowHeadStyleandEndArrowHeadStyle. - Specify the line type through
LineShapeType(straight, elbow, curved, etc.). - Save the workbook with the
Workbook.SaveToFile()method.
Here is a complete code example showing how to insert six different types of arrow lines into Excel in React:
function App() {
  const addArrowLines = async () => {
    // Get the Spire.XLS WASM module
    const xlsModule = window.wasmModule?.spirexls;

    // Check whether the module is ready
    if (!xlsModule) {
      alert('Spire.Xls is not ready yet');
      return;
    }

    // Load the font into the VFS for text measurement and column auto-fit
    await window.spire.FetchFileToVFS('ARIAL.TTF', '/Library/Fonts/', `${process.env.PUBLIC_URL}/font/`);

    // Create a new workbook and get the first worksheet
    const workbook = new xlsModule.Workbook();
    const sheet = workbook.Worksheets.get(0);

    // Add a double-arrow line - solid blue
    let line = sheet.TypedLines.AddLine();
    line.Top = 10;
    line.Left = 20;
    line.Width = 100;
    line.Height = 0;
    line.Color = xlsModule.Color.get_Blue();
    line.BeginArrowHeadStyle = xlsModule.ShapeArrowStyleType.LineArrow;
    line.EndArrowHeadStyle = xlsModule.ShapeArrowStyleType.LineArrow;

    // Add a single-arrow line - solid red
    let line_1 = sheet.TypedLines.AddLine();
    line_1.Top = 50;
    line_1.Left = 30;
    line_1.Width = 100;
    line_1.Height = 100;
    line_1.Color = xlsModule.Color.get_Red();
    line_1.BeginArrowHeadStyle = xlsModule.ShapeArrowStyleType.LineNoArrow;
    line_1.EndArrowHeadStyle = xlsModule.ShapeArrowStyleType.LineArrow;

    // Add an elbow arrow connector
    let line3 = sheet.TypedLines.AddLine();
    line3.LineShapeType = xlsModule.LineShapeType.ElbowLine;
    line3.Width = 30;
    line3.Height = 50;
    line3.EndArrowHeadStyle = xlsModule.ShapeArrowStyleType.LineArrow;
    line3.Top = 100;
    line3.Left = 50;

    // Add an elbow double-arrow connector
    let line2 = sheet.TypedLines.AddLine();
    line2.LineShapeType = xlsModule.LineShapeType.ElbowLine;
    line2.Width = 50;
    line2.Height = 50;
    line2.EndArrowHeadStyle = xlsModule.ShapeArrowStyleType.LineArrow;
    line2.BeginArrowHeadStyle = xlsModule.ShapeArrowStyleType.LineArrow;
    line2.Left = 120;
    line2.Top = 100;

    // Add a curved arrow connector
    line3 = sheet.TypedLines.AddLine();
    line3.LineShapeType = xlsModule.LineShapeType.CurveLine;
    line3.Width = 30;
    line3.Height = 50;
    line3.EndArrowHeadStyle = xlsModule.ShapeArrowStyleType.LineArrowOpen;
    line3.Top = 100;
    line3.Left = 200;

    // Add a curved double-arrow connector
    line2 = sheet.TypedLines.AddLine();
    line2.LineShapeType = xlsModule.LineShapeType.CurveLine;
    line2.Width = 30;
    line2.Height = 50;
    line2.EndArrowHeadStyle = xlsModule.ShapeArrowStyleType.LineArrowOpen;
    line2.BeginArrowHeadStyle = xlsModule.ShapeArrowStyleType.LineArrowOpen;
    line2.Left = 250;
    line2.Top = 100;

    // Save the workbook
    const outputFileName = 'AddArrowLines.xlsx';
    workbook.SaveToFile({ fileName: outputFileName, version: xlsModule.ExcelVersion.Version2010 });

    // Release resources
    workbook.Dispose();

    // Read the saved file from the VFS and trigger the download
    const fileArray = window.dotnetRuntime.Module.FS.readFile(outputFileName);
    const blob = new Blob([fileArray], { type: 'application/vnd.openxmlformats-officedocument.spreadsheetml.sheet' });
    const url = URL.createObjectURL(blob);
    const a = document.createElement('a');
    a.href = url;
    a.download = outputFileName;
    a.click();
    URL.revokeObjectURL(url);
  };

  return (
    <div style={{ textAlign: 'center', height: '300px' }}>
      <h1>Add Arrow Lines</h1>
      <button onClick={addArrowLines}>Start</button>
    </div>
  );
}

export default App;
Effect of inserting arrow-tipped lines:

Frequently Asked Questions
How do I retrieve and modify existing lines in a worksheet?
Reason: An Excel file with existing lines was imported, but it's unclear how to read or modify them.
Solution: Traverse the sheet.Shapes collection to retrieve line shape objects, then modify their properties via the ILineShape interface. For example, sheet.Shapes.get(0) gets the first shape, and after confirming it's a line type, you can modify properties like color, dash style, etc.
How do I delete lines from an Excel worksheet?
Reason: Need to remove excess lines that were created or imported.
Solution: Use sheet.Shapes.Remove(index) to delete a line object at a specified index from the shapes collection, or iterate through the Shapes collection to delete them one by one based on name or type conditions.
Get a Free License
Spire.XLS for JavaScript offers a 30-day full-featured free trial license with no functional limitations. Apply here to evaluate before purchasing.
Create Exploded Pie and Doughnut Charts in Excel with JavaScript in React
2026-09-10 08:16:03 Written by liu taliaPie charts and doughnut charts are the most intuitive chart types for showing the proportion of each data item. An exploded pie chart or exploded doughnut chart pulls all the slices apart, which makes every part stand out more clearly. Spire.XLS for JavaScript completes this directly in the browser based on WebAssembly, managing input/output files through a virtual file system (VFS), with no backend service required.
This article introduces two core features:
For installation and project configuration, refer to Integrating Spire.XLS for JavaScript in a React Project. The examples below assume Spire.XLS is installed and the WebAssembly module is initialized.
Create an Exploded Pie Chart
The slices of an exploded pie chart are separated from each other, which is suitable for highlighting the proportion of each data item. To create an exploded pie chart, follow these steps:
- Create a
Workbookobject and use theLoadFromFile()method to load the Excel file that contains the data. - Use the
Workbook.Worksheets.get()method to get the worksheet that contains the data. - Call the
Charts.Add()method to add a chart and set theChartTypetoExcelChartType.PieExploded. - Use the
Series.CategoryLabelsandSeries.Valuesproperties to specify the categories and values of the chart. - Set properties such as the chart title, position and data labels.
- Use the
Workbook.SaveToFile()method to save the workbook.
Here is a complete code example showing how to create an exploded pie chart from the product sales data in a worksheet in React:
function App() {
  const createExplodedPieChart = async () => {
    // Get the Spire.XLS WASM module
    const xlsModule = window.wasmModule?.spirexls;

    // Check whether the module is ready
    if (!xlsModule) {
      alert('Spire.Xls is not ready yet');
      return;
    }

    // Load the font and Excel file into the VFS
    await window.spire.FetchFileToVFS('ARIAL.TTF', '/Library/Fonts/', `${process.env.PUBLIC_URL}/font/`);
    const inputFileName = 'SalesData.xlsx';
    await window.spire.FetchFileToVFS(inputFileName, '', `${process.env.PUBLIC_URL}data/`);

    // Load the workbook and get the worksheet that contains the data
    const workbook = new xlsModule.Workbook();
    workbook.LoadFromFile({ fileName: inputFileName });
    const sheet = workbook.Worksheets.get(0);

    // Add a chart and set its chart type to an exploded pie chart
    const chart = sheet.Charts.Add();
    chart.ChartType = xlsModule.ExcelChartType.PieExploded;

    // Set the data range and the title of the chart
    chart.DataRange = sheet.Range.get("B2:B7");
    chart.SeriesDataFromRange = false;
    chart.ChartTitle = "Product Sales Share";
    chart.ChartTitleArea.IsBold = true;
    chart.ChartTitleArea.Size = 12;

    // Set the category labels and the values of the chart, and show the value labels
    const cs = chart.Series.get(0);
    cs.CategoryLabels = sheet.Range.get("A2:A7");
    cs.Values = sheet.Range.get("B2:B7");
    cs.DataPoints.DefaultDataPoint.DataLabels.HasValue = true;

    // Set the position of the chart
    chart.LeftColumn = 4;
    chart.TopRow = 1;
    chart.RightColumn = 15;
    chart.BottomRow = 25;

    // Hide the background of the plot area and set the position of the legend
    chart.PlotArea.Fill.Visible = false;
    chart.Legend.Position = xlsModule.LegendPositionType.Right;

    // Save the document
    const outputFileName = 'ExplodedPieChart_output.xlsx';
    workbook.SaveToFile({ fileName: outputFileName });

    // Release resources
    workbook.Dispose();

    // Read the converted file from the VFS and trigger a download
    const fileArray = window.dotnetRuntime.Module.FS.readFile(outputFileName);
    const blob = new Blob([fileArray], { type: 'application/vnd.openxmlformats-officedocument.spreadsheetml.sheet' });
    const url = URL.createObjectURL(blob);
    const a = document.createElement('a');
    a.href = url;
    a.download = outputFileName;
    a.click();
    URL.revokeObjectURL(url);
  };

  return (
    <div style={{ textAlign: 'center', height: '300px' }}>
      <h1>Create Exploded Pie Chart</h1>
      <button onClick={createExplodedPieChart}>
        Start
      </button>
    </div>
  );
}

export default App;
After running the code, you can see the effect of the exploded pie chart:
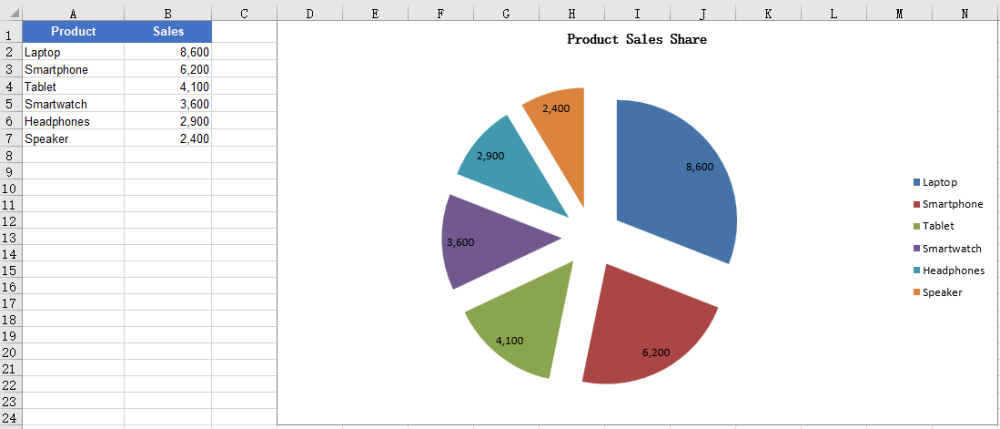
Create an Exploded Doughnut Chart
A doughnut chart is similar to a pie chart, but it has a hole in the center and can also show the proportion of each part in the whole. An exploded doughnut chart further pulls the slices apart. To create an exploded doughnut chart, follow these steps:
- Create a
Workbookobject and use theLoadFromFile()method to load the Excel file that contains the data. - Use the
Workbook.Worksheets.get()method to get the worksheet that contains the data. - Call the
Charts.Add()method to add a chart and set theChartTypetoExcelChartType.DoughnutExploded. - Use the
Series.CategoryLabelsandSeries.Valuesproperties to specify the categories and values of the chart. - Set properties such as the chart title, position and data labels.
- Use the
Workbook.SaveToFile()method to save the workbook.
Here is a complete code example showing how to create an exploded doughnut chart from the product sales data in a worksheet in React:
function App() {
  const createExplodedDoughnutChart = async () => {
    // Get the Spire.XLS WASM module
    const xlsModule = window.wasmModule?.spirexls;

    // Check whether the module is ready
    if (!xlsModule) {
      alert('Spire.Xls is not ready yet');
      return;
    }

    // Load the font and Excel file into the VFS
    await window.spire.FetchFileToVFS('ARIAL.TTF', '/Library/Fonts/', `${process.env.PUBLIC_URL}/font/`);
    const inputFileName = 'SalesData.xlsx';
    await window.spire.FetchFileToVFS(inputFileName, '', `${process.env.PUBLIC_URL}data/`);

    // Load the workbook and get the worksheet that contains the data
    const workbook = new xlsModule.Workbook();
    workbook.LoadFromFile({ fileName: inputFileName });
    const sheet = workbook.Worksheets.get(0);

    // Add a chart and set its chart type to an exploded doughnut chart
    const chart = sheet.Charts.Add();
    chart.ChartType = xlsModule.ExcelChartType.DoughnutExploded;

    // Set the data range and the title of the chart
    chart.DataRange = sheet.Range.get("B2:B7");
    chart.SeriesDataFromRange = false;
    chart.ChartTitle = "Sales Share by Product";
    chart.ChartTitleArea.IsBold = true;
    chart.ChartTitleArea.Size = 12;

    // Set the category labels and the values of the chart, and show the value labels
    const cs = chart.Series.get(0);
    cs.CategoryLabels = sheet.Range.get("A2:A7");
    cs.Values = sheet.Range.get("B2:B7");
    cs.DataPoints.DefaultDataPoint.DataLabels.HasValue = true;

    // Set the position of the chart
    chart.LeftColumn = 4;
    chart.TopRow = 1;
    chart.RightColumn = 15;
    chart.BottomRow = 25;

    // Hide the background of the plot area and set the position of the legend
    chart.PlotArea.Fill.Visible = false;
    chart.Legend.Position = xlsModule.LegendPositionType.Right;

    // Save the document
    const outputFileName = 'ExplodedDoughnutChart_output.xlsx';
    workbook.SaveToFile({ fileName: outputFileName });

    // Release resources
    workbook.Dispose();

    // Read the converted file from the VFS and trigger a download
    const fileArray = window.dotnetRuntime.Module.FS.readFile(outputFileName);
    const blob = new Blob([fileArray], { type: 'application/vnd.openxmlformats-officedocument.spreadsheetml.sheet' });
    const url = URL.createObjectURL(blob);
    const a = document.createElement('a');
    a.href = url;
    a.download = outputFileName;
    a.click();
    URL.revokeObjectURL(url);
  };

  return (
    <div style={{ textAlign: 'center', height: '300px' }}>
      <h1>Create Exploded Doughnut Chart</h1>
      <button onClick={createExplodedDoughnutChart}>
        Start
      </button>
    </div>
  );
}

export default App;
After running the code, you can see the effect of the exploded doughnut chart:
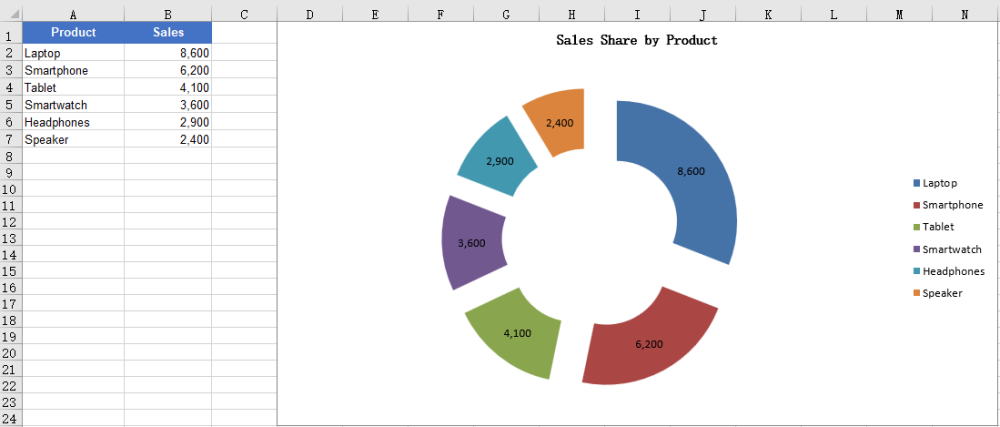
FAQ
The created chart is blank with no slices
Cause: The chart has no valid data series. For example, the DataRange or Values points to an empty range or a range without numbers, so the chart has no data to draw.
Solution: Assign a data range that contains the data to the chart, for example:
chart.DataRange = sheet.Range.get("A1:B7");

const cs = chart.Series.get(0);
cs.CategoryLabels = sheet.Range.get("A2:A7");
cs.Values = sheet.Range.get("B2:B7");
Want to show percentages instead of values in the data labels
Cause: Pie and doughnut charts are usually used to show proportions, but the data labels show values by default, or the percentage labels are not enabled.
Solution: Disable the value labels and enable the percentage labels, for example:
const cs = chart.Series.get(0);
cs.DataPoints.DefaultDataPoint.DataLabels.HasValue = false;
cs.DataPoints.DefaultDataPoint.DataLabels.HasPercentage = true;
Obtain a Free License
Spire.XLS for JavaScript offers a 30-day full-featured free trial license with no functional limitations. Apply here to evaluate before purchasing.
