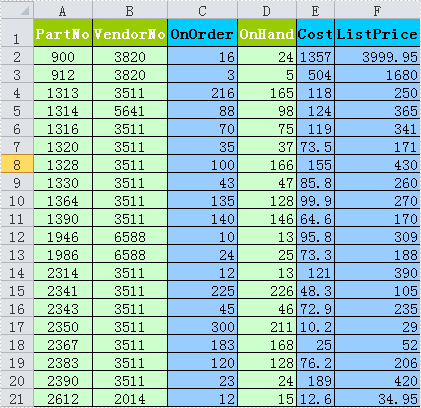
Knowledgebase (2328)
Children categories
Convert Excel to DataTable in C#: Worksheets, Ranges & Beyond
2024-11-14 03:59:00 Written by hayes Liu
Working with Excel data is a common requirement in .NET development. Developers often need to convert Excel files into a DataTable, which provides a structured way to manipulate data, perform LINQ queries, bind to UI controls, or import into a database.
Although this task is common, the implementation details are not always straightforward. Converting Excel data into a DataTable in C# can be achieved in several ways, but traditional approaches often depend on OLEDB drivers or involve lengthy OpenXML programming, both of which add unnecessary complexity and external dependencies. In this guide, we’ll use Spire.XLS for .NET to simplify the process of importing Excel data into a DataTable with C# code. The library provides built-in methods to load Excel files, export worksheets or specific ranges, and work with the data directly in a DataTable.
Quick Navigation
- What is a DataTable and Why Use It?
- Preparing the Environment
- Converting Excel to DataTable in C#
- Bonus: Exporting DataTable Back to Excel
- Handling Large Excel Files and Performance Tips
- Best Practices
- Conclusion
- FAQ
What is a DataTable and Why Use It?
A DataTable in C# is a memory-resident representation of structured data. It allows developers to:
- Store Excel data in tabular form.
- Perform filtering, sorting, and LINQ queries.
- Bind to UI components like DataGridView.
- Bulk insert into relational databases.
Compared with DataSet, a DataTable is lightweight and especially well-suited for working with a single worksheet or range of data.
Preparing the Environment
Before starting, install Spire.XLS for .NET in your project. The easiest way is through NuGet:
Install-Package Spire.XLS
Then, import the required namespaces in your C# code:
using Spire.Xls;
using System.Data;
Converting Excel to DataTable in C#
The following sections demonstrate how to load an Excel file and convert its contents into a DataTable using Spire.XLS. Unlike older methods that depend on OLEDB, this library works without Microsoft Office installation, making it reliable for both desktop and server-side applications.
Load an Excel File
Workbook workbook = new Workbook();
workbook.LoadFromFile("Sample.xlsx");
This creates a Workbook object from the specified Excel file, which you can then use to access individual worksheets.
Convert a Worksheet to DataTable
Worksheet sheet = workbook.Worksheets[0];
DataTable dataTable = sheet.ExportDataTable(sheet.AllocatedRange, true);
Here, the entire first worksheet is exported to a DataTable.
- sheet.AllocatedRange retrieves the used range of the worksheet.
- The true parameter means the first row will be treated as column headers.
This approach is useful when you want to import all data from a sheet directly into a DataTable, for example when binding to a DataGridView or performing bulk inserts into a database.
Convert a Specific Range to DataTable
DataTable partialTable = sheet.ExportDataTable(sheet.Range["A1:C10"], true);
This snippet converts only the range A1:C10 into a DataTable. It’s a practical choice when dealing with large Excel files, where only part of the sheet is needed for processing, or when extracting a specific report section.
Complete Example: Excel Worksheet to DataTable with C#
The following example demonstrates the entire workflow of loading an Excel file and converting it into a DataTable. After running this code, you can process the table further, such as querying, filtering, or inserting into a database.
using Spire.Xls;
using System.Data;
class Program
{
static void Main()
{
// Load Excel file
Workbook workbook = new Workbook();
workbook.LoadFromFile("Sample.xlsx");
// Convert first worksheet to DataTable
Worksheet sheet = workbook.Worksheets[0];
DataTable dataTable = sheet.ExportDataTable(sheet.AllocatedRange, true);
// Print row count
Console.WriteLine("Rows imported: " + dataTable.Rows.Count);
// Print column names
foreach (DataColumn col in dataTable.Columns)
{
Console.Write(col.ColumnName + "\t");
}
Console.WriteLine();
// Print all rows
foreach (DataRow row in dataTable.Rows)
{
foreach (var item in row.ItemArray)
{
Console.Write(item + "\t");
}
Console.WriteLine();
}
}
}
This code loads the first worksheet from an Excel file, exports its content into a DataTable, and prints the table to the console. The following screenshot shows an example of the output:

For scenarios where you need to read Excel data cell by cell, see our guide on reading Excel files in C#.
Bonus: Exporting DataTable Back to Excel in C#
In some cases, you may also need to write modified data from a DataTable back to Excel. This can be done easily:
Workbook wb = new Workbook();
Worksheet ws = wb.Worksheets[0];
// Assume dataTable is already populated
ws.InsertDataTable(dataTable, true, 1, 1);
wb.SaveToFile("Output.xlsx", ExcelVersion.Version2016);
This code inserts the DataTable starting at cell A1 and saves the file. It demonstrates the reverse workflow, ensuring smooth two-way data exchange between Excel and C#. For more details, you can check How to Export DataTable into Excel in C#.
Handling Large Excel Files and Performance Tips
When working with large Excel files, performance optimization is key. Here are a few best practices:
- Read only the required worksheets instead of loading all.
- Export specific ranges rather than entire sheets if possible.
- Use stream-based methods (LoadFromStream) to avoid file locks.
- Minimize memory usage by processing rows iteratively when handling very large DataTables.
Spire.XLS supports .xls, .xlsx, and .csv formats consistently, making it suitable across different scenarios.
Best Practices
When converting Excel to DataTable, keep in mind:
- Data type handling: Excel stores values as text by default. Convert them to int, decimal, or DateTime as needed.
- Null or empty cells: Always check for missing values to prevent runtime errors.
- Database integration: Before bulk inserting into SQL Server or another database, validate and sanitize the DataTable.
Conclusion
Converting Excel data into a DataTable is a common but critical task in .NET development. With Spire.XLS for .NET, you can achieve this efficiently without relying on OLEDB drivers or complex OpenXML parsing.
Whether you need to convert an entire worksheet, extract a specific range, or write data back to Excel, the process remains straightforward and reliable. Mastering this workflow ensures smoother integration between Excel data and your C# applications.
If you want to unlock the full feature set of Spire.XLS, you can apply for a free temporary license. For smaller projects, you can also use Free Spire.XLS for .NET.
FAQ
Q: How do I import data from Excel to DataTable in C#?
Use Worksheet.ExportDataTable() to directly convert worksheet data into a DataTable.
Q: Can I read Excel into DataTable without OLEDB?
Yes. Spire.XLS does not require OLEDB or Microsoft Office installation.
Q: How to read only a specific worksheet or range into a DataTable?
Pass the target Worksheet or Range to ExportDataTable().
Q: Can I export a DataTable back to Excel in C#?
Yes. Use Worksheet.InsertDataTable() and then save the file with SaveToFile().
The sample demonstrates how to convert Excel workbook to PDF file via Spire.XLS.

Excel radar charts, also known as spider charts or web charts, are used to compare multiple data series in different categories. By plotting data points on a multi-axis chart, radar charts provide a clear and intuitive representation of data balance and skewness. This makes them particularly useful for visualizing performance metrics, market analysis, and other situations where multiple dimensions need to be compared. In this article, you will learn how to create a radar chart in Excel in C# using Spire.XLS for .NET.
Install Spire.XLS for .NET
To begin with, you need to add the DLL files included in the Spire.XLS for .NET package as references in your .NET project. The DLL files can be either downloaded from this link or installed via NuGet.
PM> Install-Package Spire.XLS
Create a Simple Radar Chart in Excel in C#
Spire.XLS for .NET provides the Worksheet.Charts.Add(ExcelChartType.Radar) method to add a standard radar chart to an Excel worksheet. The following are the detailed steps:
- Create a Workbook instance.
- Get a specified worksheet using Workbook.Worksheets[sheetIndex] property.
- Add the chart data to specified cells and set the cell styles.
- Add a simple radar chart to the worksheet using Worksheet.Charts.Add(ExcelChartType.Radar) method.
- Set data range for the chart using Chart.DataRange property.
- Set the position, legend and title of the chart.
- Save the result file using Workbook.SaveToFile() method.
- C#
using Spire.Xls;
using System.Drawing;
namespace ExcelRadarChart
{
class Program
{
static void Main(string[] args)
{
//Create a Workbook instance
Workbook workbook = new Workbook();
//Get the first worksheet
Worksheet sheet = workbook.Worksheets[0];
//Add chart data to specified cells
sheet.Range["A1"].Value = "Rating";
sheet.Range["A2"].Value = "Communication";
sheet.Range["A3"].Value = "Experience";
sheet.Range["A4"].Value = "Work Efficiency";
sheet.Range["A5"].Value = "Leadership";
sheet.Range["A6"].Value = "Problem-solving";
sheet.Range["A7"].Value = "Teamwork";
sheet.Range["B1"].Value = "Jonathan";
sheet.Range["B2"].NumberValue = 4;
sheet.Range["B3"].NumberValue = 3;
sheet.Range["B4"].NumberValue = 4;
sheet.Range["B5"].NumberValue = 3;
sheet.Range["B6"].NumberValue = 5;
sheet.Range["B7"].NumberValue = 5;
sheet.Range["C1"].Value = "Ryan";
sheet.Range["C2"].NumberValue = 2;
sheet.Range["C3"].NumberValue = 5;
sheet.Range["C4"].NumberValue = 4;
sheet.Range["C5"].NumberValue = 4;
sheet.Range["C6"].NumberValue = 3;
sheet.Range["C7"].NumberValue = 3;
//Set font styles
sheet.Range["A1:C1"].Style.Font.IsBold = true;
sheet.Range["A1:C1"].Style.Font.Size = 11;
sheet.Range["A1:C1"].Style.Font.Color = Color.White;
//Set row height and column width
sheet.Rows[0].RowHeight = 20;
sheet.Range["A1:C7"].Columns[0].ColumnWidth = 15;
//Set cell styles
sheet.Range["A1:C1"].Style.Color = Color.DarkBlue;
sheet.Range["A2:C7"].Borders[BordersLineType.EdgeBottom].LineStyle = LineStyleType.Thin;
sheet.Range["A2:C7"].Style.Borders[BordersLineType.EdgeBottom].Color = Color.DarkBlue;
sheet.Range["B1:C7"].HorizontalAlignment = HorizontalAlignType.Center;
sheet.Range["A1:C7"].VerticalAlignment = VerticalAlignType.Center;
//Add a radar chart to the worksheet
Chart chart = sheet.Charts.Add(ExcelChartType.Radar);
//Set position of chart
chart.LeftColumn = 4;
chart.TopRow = 4;
chart.RightColumn = 14;
chart.BottomRow = 29;
//Set data range for the chart
chart.DataRange = sheet.Range["A1:C7"];
chart.SeriesDataFromRange = false;
//Set and format chart title
chart.ChartTitle = "Employee Performance Appraisal";
chart.ChartTitleArea.IsBold = true;
chart.ChartTitleArea.Size = 14;
//Set position of chart legend
chart.Legend.Position = LegendPositionType.Corner;
//Save the result file
workbook.SaveToFile("ExcelRadarChart.xlsx", ExcelVersion.Version2016);
}
}
}

Create a Filled Radar Chart in Excel in C#
A filled radar chart is a variation of a standard radar chart, with the difference that the area between each data point is filled with color. The following are the steps to create a filled radar chart using C#:
- Create a Workbook instance.
- Get a specified worksheet using Workbook.Worksheets[sheetIndex] property.
- Add the chart data to specified cells and set the cell styles.
- Add a filled radar chart to the worksheet using Worksheet.Charts.Add(ExcelChartType.RadarFilled) method.
- Set data range for the chart using Chart.DataRange property.
- Set the position, legend and title of the chart.
- Save the result file using Workbook.SaveToFile() method.
- C#
using Spire.Xls;
using System.Drawing;
namespace ExcelRadarChart
{
class Program
{
static void Main(string[] args)
{
//Create a Workbook instance
Workbook workbook = new Workbook();
//Get the first worksheet
Worksheet sheet = workbook.Worksheets[0];
//Add chart data to specified cells
sheet.Range["A1"].Value = "Rating";
sheet.Range["A2"].Value = "Communication";
sheet.Range["A3"].Value = "Experience";
sheet.Range["A4"].Value = "Work Efficiency";
sheet.Range["A5"].Value = "Leadership";
sheet.Range["A6"].Value = "Problem-solving";
sheet.Range["A7"].Value = "Teamwork";
sheet.Range["B1"].Value = "Jonathan";
sheet.Range["B2"].NumberValue = 4;
sheet.Range["B3"].NumberValue = 3;
sheet.Range["B4"].NumberValue = 4;
sheet.Range["B5"].NumberValue = 3;
sheet.Range["B6"].NumberValue = 5;
sheet.Range["B7"].NumberValue = 5;
sheet.Range["C1"].Value = "Ryan";
sheet.Range["C2"].NumberValue = 2;
sheet.Range["C3"].NumberValue = 5;
sheet.Range["C4"].NumberValue = 4;
sheet.Range["C5"].NumberValue = 4;
sheet.Range["C6"].NumberValue = 3;
sheet.Range["C7"].NumberValue = 3;
//Set font styles
sheet.Range["A1:C1"].Style.Font.IsBold = true;
sheet.Range["A1:C1"].Style.Font.Size = 11;
sheet.Range["A1:C1"].Style.Font.Color = Color.White;
//Set row height and column width
sheet.Rows[0].RowHeight = 20;
sheet.Range["A1:C7"].Columns[0].ColumnWidth = 15;
//Set cell styles
sheet.Range["A1:C1"].Style.Color = Color.DarkBlue;
sheet.Range["A2:C7"].Borders[BordersLineType.EdgeBottom].LineStyle = LineStyleType.Thin;
sheet.Range["A2:C7"].Style.Borders[BordersLineType.EdgeBottom].Color = Color.DarkBlue;
sheet.Range["B1:C7"].HorizontalAlignment = HorizontalAlignType.Center;
sheet.Range["A1:C7"].VerticalAlignment = VerticalAlignType.Center;
//Add a filled radar chart to the worksheet
Chart chart = sheet.Charts.Add(ExcelChartType.RadarFilled);
//Set position of chart
chart.LeftColumn = 4;
chart.TopRow = 4;
chart.RightColumn = 14;
chart.BottomRow = 29;
//Set data range for the chart
chart.DataRange = sheet.Range["A1:C7"];
chart.SeriesDataFromRange = false;
//Set and format chart title
chart.ChartTitle = "Employee Performance Appraisal";
chart.ChartTitleArea.IsBold = true;
chart.ChartTitleArea.Size = 14;
//Set position of chart legend
chart.Legend.Position = LegendPositionType.Corner;
//Save the result file
workbook.SaveToFile("FilledRadarChart.xlsx", ExcelVersion.Version2016);
}
}
}

Apply for a Temporary License
If you'd like to remove the evaluation message from the generated documents, or to get rid of the function limitations, please request a 30-day trial license for yourself.